. 2019 Jun 17;8:e45185. doi: 10.7554/eLife.45185

Figure 1. The 18S rRNA domains recruit assembly factors independent of the 5’ ETS.

(a) Schematics of rRNA mimics with color-coded rRNA domains. (b) Bait-normalized (MS2-protein) iBAQ based heat-map (proteins not detected in light brown, low abundance to high abundance in gradient from white to black) of ribosome biogenesis factors co-purified with pre-rRNA constructs shown in (a). Each biological replicate (n = 2) is labeled at the bottom and all technical replicates (n = 3, n = 2) are shown. (c) Three 90° related views of the cryo-EM structure of the 5’ ETS RNP lowpass-filtered to 5 Å with density colored according to subunits. Subunits of UtpA (shades of blue), UtpB (shades of red) and U3 snoRNP (shades of purple with U3 snoRNA in red) are shown.

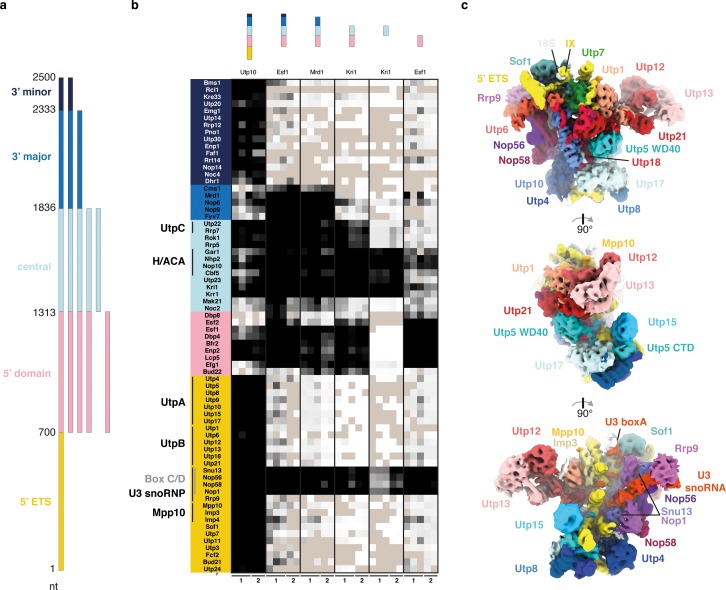
Figure 1.

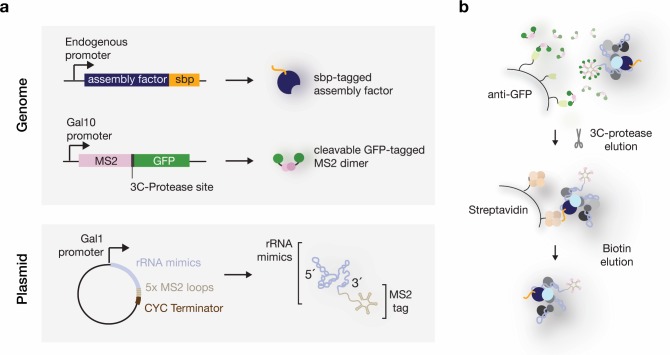
Figure 1—figure supplement 1. Expression and purification system used to isolate RNPs containing defined rRNA mimics.

Figure 1—figure supplement 1.

(a) Schematic overview of the genetic components in yeast strains used to purify rRNA mimics and associated proteins. rRNA mimics (light-blue) tagged at their 3’ ends with five MS2-aptamer stem-loops (beige) are expressed from a plasmid. A galactose inducible promoter (Gal1) and a CYC terminator are used to control the RNA polymerase-II-driven expression of the pre-rRNA sequences. A single galactose-inducible copy of the GFP (green) tagged MS2 protein (pink) is integrated in the yeast genome. Endogenous ribosome assembly factors (dark-blue) are tagged with a streptavidin binding peptide (sbp) (orange). (b) In vivo, the galactose induced rRNA mimics recruit endogenous ribosome assembly proteins and the MS2-3C-GFP dimers. The RNPs are immobilized on anti-GFP nanobody (light-green) covered beads through the MS2-3C-GFP moiety. 3C-protease cleavage elutes the particles, which are then subjected to a second affinity purification step on streptavidin (light-orange) coated beads. Biotin elutes the RNPs.
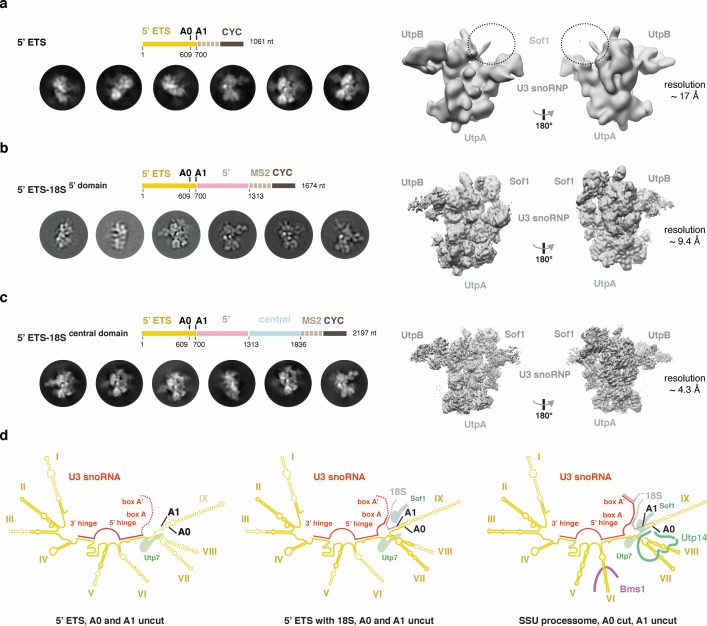
Figure 1—figure supplement 2. Cryo-EM analyses of the 5’ ETS RNP in different pre-ribosomal intermediates.

Figure 1—figure supplement 2.

(a-c) 2D class averages and 3D reconstructions obtained from cryo-EM datasets of the 5’ ETS alone (a), 5’ ETS with 5’ domain (b), and the 5’ ETS with the 5’- and central domains (c). A schematic drawing above the 2D class averages represents the pre-rRNA content of the particles. Estimated overall resolutions of all three cryo-EM reconstructions are indicated as well as the position of architectural landmark proteins and complexes. A dashed circle highlights the position of Sof1, which is disordered in the reconstruction containing the 5’ ETS alone (a). (d), Schematic representation of the secondary structure of the 5’ ETS (yellow) and its interaction with U3 snoRNA (red) and the 18S pre-rRNA (gray) in the context of two 5’ ETS RNP-containing particles and the SSU processome. Regions disordered in the 5’ ETS RNA and the U3 snoRNA are indicated with dashes and selected proteins interacting with nearby pre-rRNA are shown.
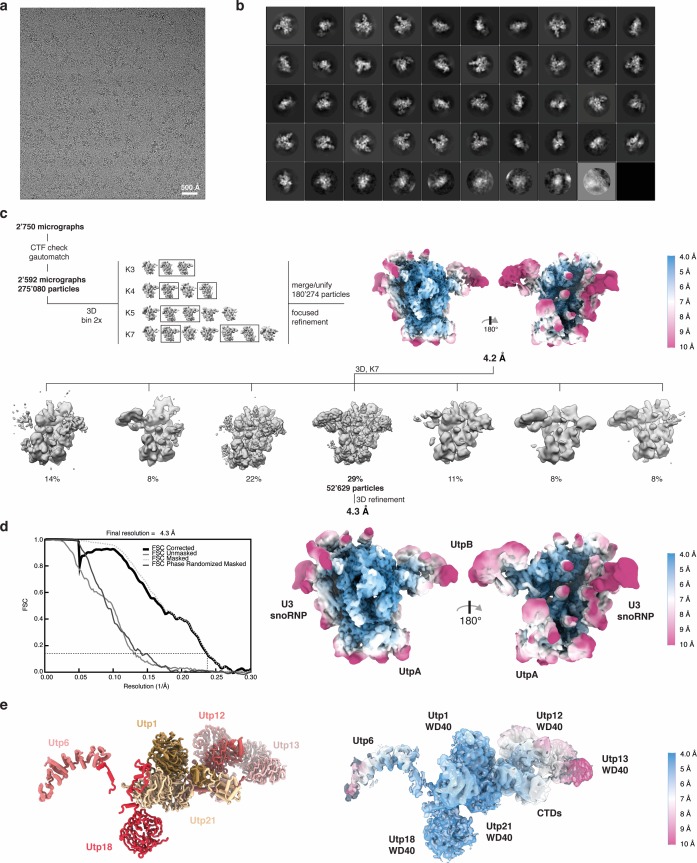
Figure 1—figure supplement 3. Cryo-EM data processing strategy, overall and local resolution estimation of the 5’ ETS RNP.

Figure 1—figure supplement 3.

(a) Representative micrograph and (b) 2D class averages of the 5’ ETS RNP. (c) Manual inspection of 2’750 collected micrographs resulted in 2’592 micrographs of good quality used to extract 275’080 particles picked with gautomatch. These particles were subjected to 3D classification with varying numbers of classes. Particles from boxed out classes (180’275 particles combined) were used for 3D refinement. A subsequent 3D classification with seven classes resulted in a single class (52’629 particles) with better-resolved features in the periphery of the RNP, which yielded a reconstruction at 4.3 Å. (d) Overall and local resolution estimation of the 5’ ETS RNP. An FSC value of 0.143 is indicated. RELION-3 (Zivanov et al., 2018) was used to estimate local resolution. A volume filtered to the local resolution is shown. (e) UtpB model (left) with subunits colored and labeled, and the corresponding density fit of the model with local resolution color-coded (right).