

Abstract
Background:
We compared the diagnostic accuracy of longitudinal strain (LS) imaging during stress echocardiography with visual assessment of wall-motion (WM) for detecting significant coronary artery disease (CAD).
Methods:
Our systematic search included studies reporting diagnostic measures for LS imaging and visual assessment of WM for detecting significant CAD during stress echocardiography. Summary diagnostic accuracy measures including area under the curve (AUC), sensitivity, specificity, diagnostic odds ratio (DOR), and, likelihood ratios (LRs) were estimated.
Results:
In thirteen studies with 978 patients, ten studies used invasive coronary angiography as the reference standard. Pooled AUC for diagnosing significant CAD was 0.92 [95% confidence interval (CI) 0.89 to 0.94] for LS imaging as compared to 0.83 (95% CI 0.80 to 0.86), p=0.000 for visual assessment of WM. LS imaging had higher sensitivity [88% (95% CI 84 to 92) vs. 74% (95% CI 68 to 80), p=0.000] and comparable specificity to visual assessment of WM [80% (95% CI 72 to 87) vs. 83% (95% CI 74 to 90), p=0.592]. The DOR for LS imaging and visual assessment of WM was 31 and 15, p=0.254, respectively. The positive LR was 4.5 for both; negative LR was 0.14 and 0.31, p=0.002 for LS imaging and visual assessment of WM, respectively.
Conclusions:
LS imaging during stress echocardiography has better diagnostic accuracy for detecting significant CAD as compared to visual assessment of WM. Studies using larger sample size and standardized techniques of strain measurement are required to further ascertain the added advantage of strain measurement over visual assessment alone.
Keywords: Longitudinal strain imaging, deformation analysis, wall-motion analysis, meta-analysis
Introduction
Stress echocardiography is a well-established modality for identifying myocardial ischemia.1 Detection of wall-motion (WM) abnormalities during stress echocardiography are a cornerstone for diagnosing myocardial ischemia.2 Wall motion abnormalities occur later in the ischemic cascade, and may be transient. Therefore, technical limitations of WM abnormality detection during stress echocardiography include the inability to obtain images at peak heart rate due to the rapid return of heart rate after stress, as well as off-axis imaging, and observer dependency.3,4 Hence, sensitivity and overall diagnostic accuracy of visual assessment during stress echocardiography are thought to be lower than other non-invasive imaging modalities.5
Myocardial deformation analysis using longitudinal strain (LS) analysis with stress echocardiography is an objective and reliable modality to detect abnormalities of myocardial motion better than visual assessment given its quantitative nature, ability to differentiate tethering from surrounding segments, and the fact that deformation abnormalities are seen early in the natural history of ischemic heart disease which may help detect at-risk territories earlier.6–8 Several studies have evaluated the role of LS imaging in diagnosing significant coronary artery disease (CAD) but these studies had a small sample size(s),8,9 reported the varying degree of diagnostic accuracy,10–12 and used different LS parameters.1,8,13–15 Given the lack of systematic evaluation of LS imaging during stress echocardiography, we conducted the current study to assess the diagnostic performance of LS imaging during stress echocardiography compared to visual assessment of WM in patients with suspected significant CAD. We hypothesized that the addition of LS analysis will improve the diagnostic accuracy of stress echocardiography beyond the visual assessment of WM.
Methods
Given this is a meta-analysis of the previously published literature, ethics committee approval is not applicable.
Study Protocol and Search strategy
Studies reporting diagnostic measures including sensitivity and specificity of LS imaging as well as a visual assessment of WM for myocardial ischemia detection during stress echocardiography in patients with suspected significant CAD were included. This study was designed and conducted in accordance with the Preferred Reporting Items for Systematic Reviews and Meta-Analyses (PRISMA) statement (Supplemental Table 1). A systematic PubMed/MEDLINE database search from origin till September 1, 2018, was performed by two independent investigators (KG and TSK) for studies comparing LS imaging to visual assessment of stress echocardiography images to detect significant CAD using predefined criteria (Supplement). Studies in a language other than English, animal studies, studies reporting results taking myocardial segments as the unit of the study and those with <5 subjects in each group were excluded. Disagreements, if any, were resolved through consensus and after discussion with a third author (NSB).
Reference standard, stress echocardiography protocols, and LS imaging
Reference standard
Ten studies used invasive coronary angiography (ICA) as the reference standard. One study used single-photon emission computed tomography (SPECT) and another used coronary computed tomography angiography (CCTA) as the reference standard. One study used both ICA and adenosine-stress myocardial perfusion imaging. The angiographic cut-off for the diagnosis of significant CAD varied; >50% obstruction in seven studies, >70% in three studies and fractional flow reserve <0.75 in one study.
Stress echocardiography
Pharmacological stress was utilized most commonly (9 studies), followed by exercise stress (3 study) and one study reporting both exercise and pharmacological agents for stressing patients. Stress echocardiographic images were obtained from within one minute to five minutes after termination of exercise (Table II).
Table II:
Stress echocardiography and LS imaging protocols
| Author/year | Stress | LS imaging technique | LS | Strain at | LS parameter | Diagnostic values (to detect significant CAD) |
|---|---|---|---|---|---|---|
| Wiedemann et al.24/2007 | P | TVI | G | Rest, Stress | Δ peak systolic strain rate | < −0.6 s−1 |
| Bjork Ingul et al.36/2007 | P | 2D speckle tracking | G | Stress | Peak systolic strain rate | < −1.3 s−1 |
| Ng et al.12/2009 | P | 2D speckle tracking | G | Stress | Peak GLS | <−20% |
| Takagi et al.1/2010 | E | TVI | G | Rest, Stress | Time to peak strain (TPS) ratio | ≥ 1.10 |
| Takagi et al. 8/2011 | E | TVI | G | Rest, Stress | Δ time-to-peak strain 5 min after stress echocardiography | >70 ms |
| Montgomery et al.15/2012 | P, E | 2D speckle tracking | G | Rest | Rest systolic strain rate | < −0.95 |
| Gaibazzi et al./201416 | - | 2D speckle tracking | G | Rest | Rest GLS | <−20.7% |
| Cusma-Piccione et al.10/2015 | P | 2D speckle tracking | G | Rest, Stress | ΔGLS between low and peak dose | Not available |
| Aggeli et al.13/2015 | P | 2D speckle tracking | G | Rest, Stress | ΔGLS between stress and rest | ≤ 0% |
| Nagy et al.11/2015 | P | TVI | S | Stress | Post-systolic index, peak systolic strain rate | PSI < 35%; peak systolic strain rate < −1.3−1 |
| Rumbinaite et al.23/2016 | P | 2D speckle tracking | G | Stress | Peak GLS | >−21.6% |
| Yang et al. 25/2017 | P | 2D speckle tracking | S | Rest, Stress | Δ strain between stress, post-systolic shortening | >1% reduction in LS, new post-systolic shortening |
| Mansour et al.14/2018 | E | 2D speckle tracking | S | Rest, Stress | Peak GLS | >−16% |
LS: Longitudinal strain; CAD: Coronary artery disease; P:Pharmacological; E: Exercise; TVI: Tissue-velocity imaging; G: Global; S: Segmental GLS: Global longitudinal strain; TPS ratio: Defined as TPS at delayed post-exercise/baseline; Post-systolic index is the ratio of post-systolic to maximal systolic strain
Left ventricular deformation with LS imaging
LS measurements were performed in all thirteen studies to assess left ventricular deformation. In all studies, the investigator interpreting LS analysis was blinded to the results of the reference standard. For plotting LS curves, tissue velocity imaging (TVI) was utilized in four studies and whereas nine studies used 2D speckle tracking (Table II). Two out of thirteen studies reported diagnostic accuracy of longitudinal strain at rest compared to WM abnormality at stress.15,16 Ten studies used global LS (GLS) whereas three studies used segmental LS measures. Variable LS measures and cut-offs for LS measures were used across studies for the detection of significant CAD (Table II). The most commonly utilized software for LS measurement was EchoPAC Workstation software provided by General Electric (GE) Medical systems (9 studies) other software including QLAB 9.0 (1 study), TVI® by GE (1 study), TomTec (1 study) and GcMat by GE (1 study) were also used.
Outcome measures
The outcomes evaluated in this meta-analysis were the area under the curve (AUC) for receiver operator characteristic (ROC), sensitivity, specificity, diagnostic odds ratio (DOR) and likelihood ratios (LRs). These were compared between LS imaging and visual assessment of WM during stress echocardiography.
Data items
Data items extracted from each study included demographic and clinical characteristics, the risk of bias items, the reference standard for diagnosis, software for LS assessment, LS parameters, positive (PPV) and negative predictive value (NPV), sensitivity, specificity, and AUC. Data for subgroup analyses by type of LS measure, strain measurement technique, the timing of strain measure, stress modality, and reference standard for CAD diagnosis was also extracted.
Data extraction
Two authors (KG and TSK) independently extracted the relevant data from the studies. Inconsistencies were resolved by a third author (NSB).
Quality assessment
We used the Quality Assessment of Diagnostic Accuracy Studies (QUADAS-2) criteria to assess the quality of studies.17 Based on the data required for the present meta-analysis, studies were classified as having a low, unclear or high risk of bias and were classified according to the concerns regarding applicability by two independent authors (KG, TSK). The discrepancy, if any, were resolved through consensus as described above. Domain flow and timing was marked as high-risk of bias if the interval between the LS imaging and reference standard was >6 months.
Statistical analysis
A bivariate mixed-effects binary regression modeling was used to estimate summary sensitivity, specificity, DOR and LRs for LS imaging and visual assessment.18 The summary measures were compared using LR tests. Summary ROC curves were constructed to assess the overall accuracy of each technique from the aforementioned model.18 Data were analyzed for heterogeneity using the I2 statistic proposed by Higgins and Thompson.19 Deek’s funnel plot asymmetry test was used for assessment of publication bias.20 We also constructed Fagan’s plots to understand the effect of the diagnostic likelihood ratios for LS and visual analysis on the post-test probability of significant CAD.18,21 All of the p-values were two-tailed, with statistical significance specified at p <0.05. Sub-group analyses were performed to evaluate the effect of the type of LS measure (global or segmental), strain measurement technique (2D speckle tracking or TVI), timing of strain measure (stress or rest), stress modality (pharmacological or exercise), and reference standard for CAD diagnosis (invasive or non-invasive) on sensitivity and specificity of strain measures. All analyses were conducted in STATA version 15.0 (StataCorp, College Station, Texas).
Results
Of the 317 records screened from the PubMed database, we found 13 studies1,8–13,15,16,22–25 (9 prospective and 4 retrospective studies) with 978 patients that were eligible for (Figure 1). The included studies were published from 2007 to 2018. The sample size of individual studies ranged from 20-137 patients and the mean age ranged from 60-73 years. Among the included studies 53.3% of patients were confirmed to have significant CAD as per reference standard. Three studies included patients with a previous history of myocardial infarction and four studies included patients with a history of coronary revascularization. Table I highlights the baseline characteristics across the included studies. The items of the PRISMA checklist are presented in Supplement Table 1. The risk of bias and applicability concerns were assessed using QUADAS-2 and were deemed acceptable (Supplement Figure 1). Stress echocardiography and strain imaging protocols with cut-offs to define significant CAD are given in Table II. Sensitivity and specificity of individual studies and derived values are presented in Supplement Table 2.
Figure 1:
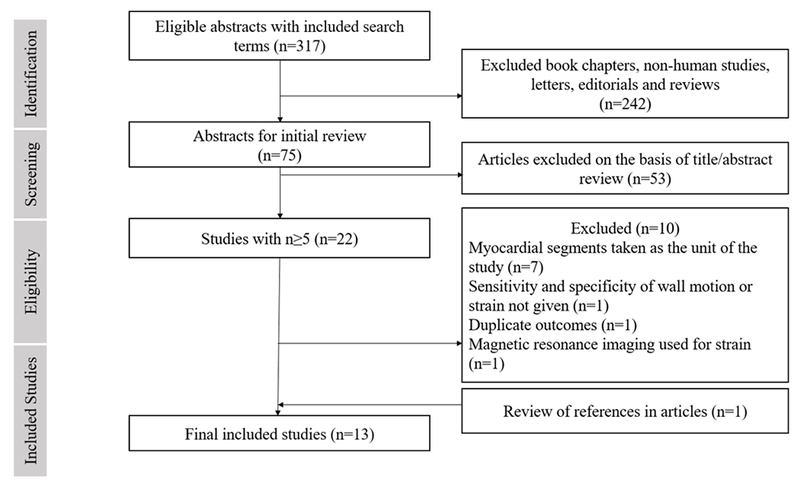
Flow diagram for study selection
Table I:
Baseline characteristics
| Author/year | Reference standard/cut-off | Total subjects (n) | CAD (n) | No CAD (n) | Mean Age (in years) | Males (n) | Htn (in %) | DM (in %) | Previous MI included | Previous PCI/CABG | Mean LVEF (%) |
|---|---|---|---|---|---|---|---|---|---|---|---|
| Wiedemann et al.24/2007 | ICA/FFR<0.75 | 30 | 17 | 13 | NR | NR | 86.7 | 16.7 | No | Yes | 59.5 |
| Bjork Ingul et al.36/2007 | ICA/>50% | 137 | 76 | 61 | NR | NR | 39.8 | 15.3 | NR | NR | NR |
| Ng et al.12/2009 | ICA/>50% | 62 | 48 | 14 | 65 | 48 | NR | NR | Yes | NR | 58.8 |
| Takagi et al.1/2010 | ICA/>50% | 45 | 30 | 15 | 73 | 37 | 87 | 51 | NR | Yes | NR |
| Takagi et al.8/2011 | SPECT | 20 | 8 | 12 | 65 | 14 | 40 | 40 | NR | NR | NR |
| Montgomery et al.15/2012 | ICA/>50% | 123 | 56 | 67 | 60 | 73 | 68 | 27 | NR | Yes | NR |
| Gaibazzi et al./201416 | ICA/>50% | 82 | 49 | 33 | 64 | 46 | 62.2 | 24.4 | No | No | NR |
| Cusma-Piccione et al.10/2015 | ICA/>50% | 52 | 38 | 14 | 65 | 22 | 44 | 30 | NR | NR | 55.2 |
| Aggeli et al.13/2015 | ICA/>70% | 100 | 67 | 33 | 61 | 72 | 59 | 23 | No | No | 55 |
| Nagy et al.11/2015 | ICA/>50% | 60 | 35 | 25 | 63 | 46 | 63.3 | 26.7 | Yes | Yes | NR |
| Rumbinaite et al.23/2016 | ICA/≥70%, adenosine stress MPI | 127 | 60 | 67 | NR | 67 | 49.6 | 14.9 | No | NR | NR |
| Yang et al. 25/2017 | ICA/>70% | 37 | 25 | 12 | 73 | 21 | 65 | 43 | Yes | NR | 68 |
| Mansour et al.14/2018 | CCTA/>70% | 103 | 12 | 91 | 52 | 84 | 35.9 | 21.3 | NR* | NR | 64 |
CAD: Coronary artery disease Htn: Hypertension; DM: Diabetes mellitus; ICA: Invasive coronary angiography; SPECT: Single photon emission computed tomography; MPI: Myocardial perfusion imaging; CCTA: Coronary computed tomographic angiography; FFR: Fractional flow reserve; 2D: 2-dimensional; NR: Not reported; CABG: Coronary artery bypass grafting; PCI: Percutaneous coronary intervention.
excluded recent MI (6 months)
Meta-analysis of diagnostic measures for visual assessment of WM for significant CAD detection
All studies had an AUC for ROC of greater than 0.5 for visual assessment; indicating in most of the studies visual assessment was better than random prediction. The summary AUC for visual assessment was 0.83 [95% confidence interval (CI), 0.80 to 0.86] (Figure 2, panel a) indicating good diagnostic accuracy. Sensitivity and specificity in individual studies for visual assessment varied from 44 to 89% and 55 to 100%, respectively. Pooled sensitivity and specificity for visual assessment for diagnosing significant CAD were 74% (95% CI 68 to 80) and 83% (95% CI 74 to 90), respectively (Figure 3, panel a & Figure 4, panel a). The positive and negative LR was 4.5 (95% CI, 2.6 to 7.7) and 0.31 (95% CI, 0.23 to 0.41) for visual assessment, respectively. The summary DOR (ratio of LR+/LR-) of 15 (95% CI, 7 to 32) indicated good discriminating power for visual assessment.
Figure 2 (a) and (b):
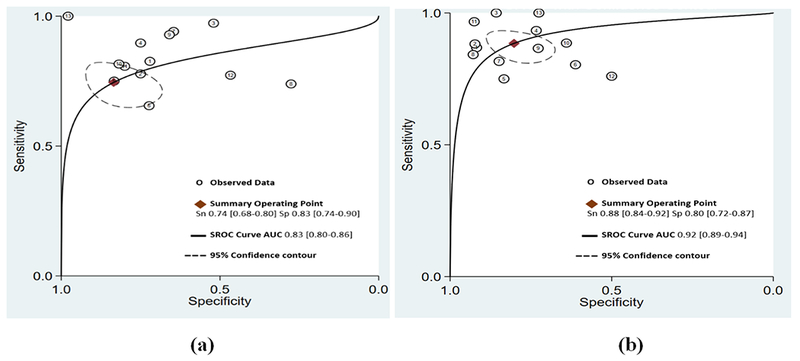
Summary receiver-operating curves (SROC) and area under the curve (AUC) for (a) visual assessment of wall motion and (b) LS imaging. Confidence contour highlights possible combinations of mean sensitivity and specificity
Figure 3 (a) and (b):
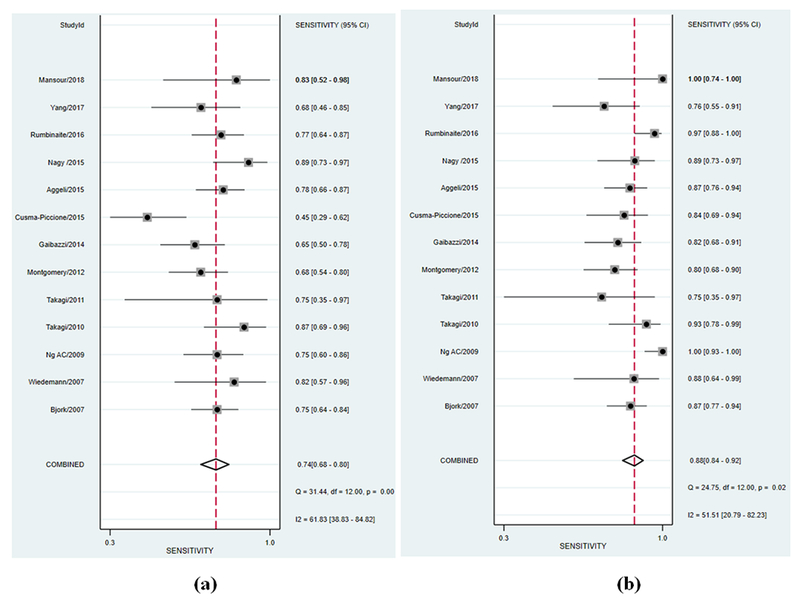
Forest plot of sensitivity of included studies for (a) visual assessment of wall motion and (b) LS imaging. Squares represent point estimates of the sensitivity of each study. Solid lines represent 95% confidence interval (CI) around the point estimate. The diamond represents a summary estimate of pooled sensitivity.
Figure 4 (a) and (b):
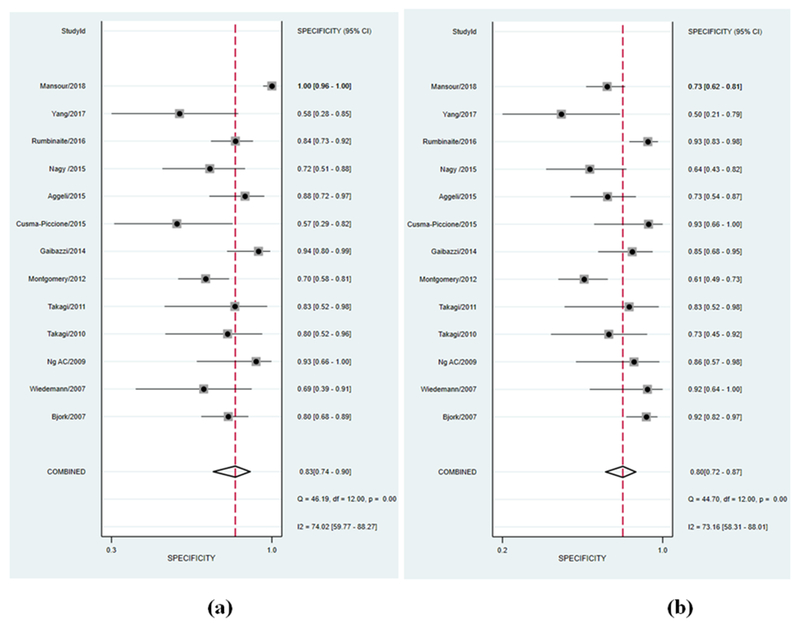
Forest plot of specificity of included studies for (a) visual assessment of wall motion and (b) LS imaging. Squares represent point estimates of the specificity of each study. Solid lines represent 95% confidence interval (CI) around the point estimate. The diamond represents a summary estimate of pooled specificity.
Meta-analysis of diagnostic measures for LS imaging for significant CAD detection
All studies had AUC of greater than 0.5 for LS analysis to detect significant CAD; indicating LS imaging was better than random prediction in all included studies. The summary AUC for LS imaging was 0.92 (95% CI, 0.89 to 0.94) (Figure 2, panel b) indicating excellent diagnostic accuracy. Sensitivity and specificity in individual studies for LS imaging varied from 77 to 100% and 49 to 93%, respectively. Pooled sensitivity and specificity for LS imaging were 88% (95% CI 84 to 92) and 80% (95% CI 72 to 87), respectively (Figure 3, panel b & Figure 4, panel b). The positive and negative LR was 4.5 (95% CI, 3 to 6.6) and 0.14 (95% CI, 0.10 to 0.22) for LS imaging, respectively. The summary DOR for LS imaging was 31 (95% CI, 15 to 64) indicating excellent discriminatory power.
Comparison of diagnostic performance of visual assessment of WM and LS imaging
Pooled data from included studies show that out of 521/978 patients with significant CAD as per reference standard, LS imaging was able to detect 458/521 (88%) patients with true significant CAD as compared to 386/521 (74%) with visual assessment. Summary ROC curves suggest that LS imaging had a higher diagnostic accuracy for significant CAD detection than visual assessment of WM summary AUC (0.92 vs 0.83, p<0.001) (Figure 2) which was driven by an improved sensitivity (88% vs. 74%, p<0.001) (Figure 3) for LS imaging as compared to visual assessment and a comparable specificity (80% vs. 83%, p=0.592) (Figure 4). These findings suggest that for every 100 patients referred for stress echocardiography, LS imaging will pick-up ~ 14 more patients with significant CAD as compared to visual assessment alone, with a comparable number of false positives. Interestingly, the variability in sensitivity by LS imaging was lower than visual assessment as indicated by I2 statistic (52% vs. 62%) likely driven by quantitative and objective nature of LS imaging. LS imaging had a numerically higher but statically non-significant summary DOR of 31 (95% CI, 15 to 64) as compared to 15 (95% CI, 7 to 32) for visual assessment of WM, p=0.524. The positive LR was 4.5 for both; while the negative LR was lower for LS imaging as compared to visual assessment of wall motion (0.14 vs. 0.31, p=0.002).
We did not observe any publication bias with Deeks test for both LS imaging and visual assessment, p>0.05 (Supplement Figure 2).
Post-test probabilities for LS imaging and visual assessment
We constructed Fagan’s plots to explore the effect of LS imaging and visual assessment on post-test probabilities given the test was positive or negative (Figure 5). Considering a pretest probability of significant CAD to be 50%, if LS imaging was positive for significant CAD, the post-test probability of truly having significant CAD was 80% (similar to the post-test probability of 80% if visual assessment suggested significant CAD). Given the same pre-test probability, if LS imaging was negative for significant CAD, the chances of having significant CAD were only 13% as compared to 23% in case visual assessment showed normal WM. These results suggest that LS imaging helped ruling-out significant CAD better than ruling-in significant CAD as compared to visual assessment alone.
Figure 5 (a) and (b):
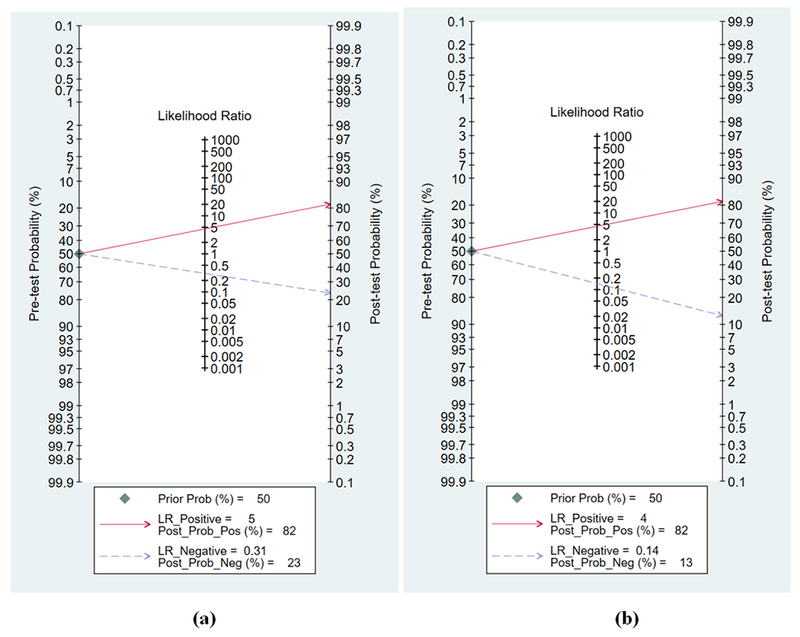
Fagan’s nomogram for calculating the post-test probability (PTP). The solid red line extends from prevalence to positive LR and PTP; dashed blue line extends from prevalence to negative LR and PTP.
In each plot, a vertical axis on the left showed the fixed pre-test probability (PTP) (50%). Using the likelihood ratio in the middle axis, post-test probability (patient’s probability of having the disease after the index test result was known) was acquired. (a) With a PTP being 50%, the post-test probability of significant coronary artery disease (CAD) on angiography, given a positive and negative visual assessment of wall motion results, were 80% and 23%. (b) With a PTP being 50%, the post-test probability of significant CAD on angiography, given positive and negative LS imaging results, were 81% and 13%.
Sub-group analyses
We grouped studies by the type of LS measure, strain measurement technique, timing of strain measure, stress modality, and reference standard for CAD diagnosis and calculated the pooled sensitivity and specificity in the aforementioned sub-groups. We did not observe any significant effect of type of LS measure, strain measurement technique, the timing of strain measure, stress modality, and reference standard for CAD diagnosis on sensitivity and specificity ] (all p>0.05). (Table III).
Table III:
Sub-group analyses to determine the effect of timing of strain measures, stress modality, strain technique and reference standard for CAD diagnosis on diagnostic performance measures for strain imaging
| Variable (no. of studies) | No. of studies | Subjects (n) | Pooled Sensitivity (%) (95% CI) | Pooled Specificity (%) (95% CI) |
|---|---|---|---|---|
| Longitudinal strain type | ||||
| Overall pooled estimate | 13 | 978 | 88 (84 to 92) | 80 (72 to 87) |
| Global | 10 | 744 | 90 (84 to 94) | 81 (72 to 87) |
| Segmental | 3 | 234 | 84 (75 to 90) | 73 (39 to 92) |
| Strain measurement technique | ||||
| Overall pooled estimate | 13 | 978 | 88 (84 to 92) | 80 (72 to 87) |
| 2D speckle tracking | 9 | 823 | 88 (82 to 93) | 81 (70 to 88) |
| TVI | 4 | 155 | 86 (77 to 91) | 75 (64 to 84) |
| Timing of LS analysis | ||||
| Overall pooled estimate | 13 | 978 | 88 (84 to 92) | 80 (72 to 87) |
| Stress | 11 | 773 | 90 (85 to 94) | 81 (72 to 88) |
| Rest | 2 | 205 | 81 (72 to 88) | 74 (45 to 91) |
| Stress modality | ||||
| Any stress | 11 | 773 | 90 (85 to 94) | 81 (72 to 88) |
| Pharmacological | 8 | 605 | 90 (84 to 94) | 84 (71 to 92) |
| Exercise | 3 | 168 | 86 (77 to 91) | 75 (64 to 84) |
| Reference Standard for CAD diagnosis | ||||
| Overall pooled estimate | 13 | 978 | 88 (84 to 92) | 80 (72 to 87) |
| Invasive angiography | 10 | 728 | 87 (82 to 90) | 79 (69 to 87) |
| Non-invasive methods* | 3 | 250 | 89 (66 to 97) | 81 (61 to 92) |
TVI: Tissue velocity imaging; LS: Longitudinal strain; CI: Confidence interval; CAD: Coronary artery disease; Echo: Echocardiography
Non-invasive methods include CT coronary angiography and myocardial perfusion imaging
Discussion
Our systematic review and meta-analysis suggest that myocardial deformation analysis by LS imaging is feasible and has a higher diagnostic accuracy for detection of significant CAD, as compared to visual assessment of WM alone in patients undergoing stress echocardiography. This was primarily driven by improved sensitivity with LS imaging, given the specificity was similar to visual assessment.
There are several potential explanations which may have led to improved sensitivity for LS imaging. Abnormalities in LS parameters are found earlier in the natural history of CAD before WM gets affected.26 LS abnormalities are independent of tethering motion and hence likely to detect abnormalities in myocardial motion due to ischemia better than visual assessment.3,26 Ability to detect WM abnormalities is limited by the sensitivity of the human eye (which is observer dependent); LS imaging by TVI or speckle tracking is able to detect subtle deformation changes which, on their own, are insufficient to cause visible WM changes and therefore, may escape detection.15,27 When exercise stress echocardiography is used to detect myocardial ischemia, the delay in acquisition of post-stress images may lead to resolution of ischemia and recovery of normal WM in myocardial segments that have experienced only mild ischemia and/or have extensive collateral blood flow.28 In addition, the increased respiratory rate with exercise makes image acquisition and interpretation difficult.29 Strain abnormalities are known to persist for a longer time after stress which may also help overcome this limitation.1,30 On the other hand specificity of LS imaging was similar to visual assessment, indicating strain imaging did not reclassify those patients which were abnormal on visual analysis. Poor visualization of the endocardial border, especially of the basal segments leads to false positive results in visual assessment; the same segments show reduced LS in patients without significant ischemia.31,32 Aforementioned along with wide dispersion in specificity (55-100% for visual assessment of WM and 49-93% for LS imaging) might have resulted in a similar specificity in our meta-analysis.
Sub-group analysis suggests that the accuracy of LS measurement to diagnose significant CAD does not change if either 2D speckle tracking or TVI is used to measure strain. Though 2D speckle tracking is less angle dependent and has higher intra-observer or inter-observer agreement, both techniques are found to correlate well and can be used to measure strain reliably.33
Strain imaging was feasible in more than 80% cases with high intra- as well as inter-observer co-relation.10,12,13,15 Feasibility of both 2D and tissue-velocity based strain imaging has been demonstrated in both animal as well as human studies, with good correlation between stenosis and strain during stress.34,35
To the best of our knowledge, this is the first meta-analysis to estimate and compare the diagnostic accuracy of LS imaging with visual assessment during stress echocardiography for the detection of significant CAD. All the studies indicated the feasibility of performing LS imaging with stress echocardiography and indicate that implementation of LS protocols for regular clinical use is possible. The results of this meta-analysis strengthen the conclusion that sensitivity to detect significant CAD was higher with LS imaging when compared to WM assessment, apart from the aforementioned mechanistic explanations for this improvement. In this meta-analysis, all studies except one11 reported increased sensitivity with LS imaging lending directional consistency to the observation of improvement in sensitivity. The included studies were directionally inconsistent in terms of incremental benefits of LS imaging over visual assessment on specificity to detect significant CAD.8,12,24 When these studies were pooled the specificity of LS imaging was high (~80%) but similar to visual assessment. Interestingly, there was lower variability in the reported sensitivity for LS analysis among the studies (77 to 100%) as compared to the reported sensitivity for visual assessment (44 to 89%) which is likely an attestation to quantitative and objective nature of LS imaging as compared to visual assessment.
Our findings have several clinical implications as follows: use of LS imaging with stress echocardiography is 1) feasible, 2) may help improve the sensitivity of stress echocardiography, 3) may serve as a fallback tool when the visual assessment is equivocal, and 4) may serve as an objective marker for serial assessments.
Our study has several limitations. Different LS parameters, type and timing of LS ascertainment, reference standards, cut offs of strain measures, software, and stress protocols were utilized across studies, which may have led to unquantifiable biases. Although when studies were grouped to assess the effect of several of the aforementioned variables we did not observe any significant change in diagnostic performance of LS to detect significant CAD, indicating that the relative change of LS measures from stress to rest may be more important than absolute values of these measures. Furthermore, with all aforementioned differences in protocol, the addition of LS analysis parameters led to improved sensitivity for significant CAD detection in all studies as well in our meta-analysis. Despite the directional consistency in results it is not possible to utilize LS imaging in clinical practice unless protocols, parameters, and software are standardized to determine true clinical accuracy of LS imaging.
Conclusions:
Myocardial deformation analysis by LS imaging during stress echocardiography is feasible and has better diagnostic accuracy for detecting significant CAD as compared to visual assessment of WM alone. There is a need for larger studies, with standardized definitions and protocols, prior to widespread clinical use of LS imaging.
Supplementary Material
Acknowledgments
Funding: Dr. Bajaj is supported by the American College of Cardiology Presidential Career Development Award and National Center for Advancing Translational Research of the National Institutes of Health under award number UL1TR001417.
The content is solely the responsibility of the authors and does not necessarily represent the official views of the American College of Cardiology or National Institutes of Health.
Footnotes
Competing interests: None
References
- 1.Takagi T, Takagi A, Yoshikawa J. Detection of coronary artery disease using delayed strain imaging at 5 min after the termination of exercise stress: head to head comparison with conventional treadmill stress echocardiography. J Cardiol. 2010;55(1):41–48. [DOI] [PubMed] [Google Scholar]
- 2.Marwick TH. Stress echocardiography. Heart. 2003;89(1):113–118. [DOI] [PMC free article] [PubMed] [Google Scholar]
- 3.Picano E, Lattanzi F, Orlandini A, Marini C, L’Abbate A. Stress echocardiography and the human factor: the importance of being expert. J Am Coll Cardiol. 1991;17(3):666–669. [DOI] [PubMed] [Google Scholar]
- 4.Hoffmann R, Lethen H, Marwick T, et al. Analysis of interinstitutional observer agreement in interpretation of dobutamine stress echocardiograms. Journal of the American College of Cardiology. 1996;27(2):330–336. [DOI] [PubMed] [Google Scholar]
- 5.Heijenbrok-Kal MH, Fleischmann KE, Hunink MG. Stress echocardiography, stress single-photon-emission computed tomography and electron beam computed tomography for the assessment of coronary artery disease: a meta-analysis of diagnostic performance. American heart journal. 2007;154(3):415–423. [DOI] [PubMed] [Google Scholar]
- 6.Heimdal A, Stoylen A, Torp H, Skjaerpe T. Real-time strain rate imaging of the left ventricle by ultrasound. J Am Soc Echocardiogr. 1998;11(11):1013–1019. [DOI] [PubMed] [Google Scholar]
- 7.Urheim S, Edvardsen T, Torp H, Angelsen B, Smiseth OA. Myocardial strain by Doppler echocardiography. Validation of a new method to quantify regional myocardial function. Circulation. 2000;102(10):1158–1164. [DOI] [PubMed] [Google Scholar]
- 8.Takagi Y, Hozumi T, Takemoto Y, et al. Detection of prolonged regional myocardial systolic dysfunction after exercise-induced myocardial ischemia by strain echocardiography with high frame rate tissue Doppler echocardiography. J Echocardiogr. 2011;9(3):90–96. [DOI] [PubMed] [Google Scholar]
- 9.Bjork Ingul C, Rozis E, Slordahl SA, Marwick TH. Incremental value of strain rate imaging to wall motion analysis for prediction of outcome in patients undergoing dobutamine stress echocardiography. Circulation. 2007;115(10):1252–1259. [DOI] [PubMed] [Google Scholar]
- 10.Cusma-Piccione M, Zito C, Oreto L, et al. Longitudinal Strain by Automated Function Imaging Detects Single-Vessel Coronary Artery Disease in Patients Undergoing Dipyridamole Stress Echocardiography. J Am Soc Echocardiogr. 2015;28(10):1214–1221. [DOI] [PubMed] [Google Scholar]
- 11.Nagy AI, Sahlen A, Manouras A, et al. Combination of contrast-enhanced wall motion analysis and myocardial deformation imaging during dobutamine stress echocardiography. Eur Heart J Cardiovasc Imaging. 2015;16(1):88–95. [DOI] [PubMed] [Google Scholar]
- 12.Ng AC, Sitges M, Pham PN, et al. Incremental value of 2-dimensional speckle tracking strain imaging to wall motion analysis for detection of coronary artery disease in patients undergoing dobutamine stress echocardiography. Am Heart J. 2009;158(5):836–844. [DOI] [PubMed] [Google Scholar]
- 13.Aggeli C, Lagoudakou S, Felekos I, et al. Two-dimensional speckle tracking for the assessment of coronary artery disease during dobutamine stress echo: clinical tool or merely research method. Cardiovasc Ultrasound. 2015;13:43. [DOI] [PMC free article] [PubMed] [Google Scholar]
- 14.Mansour MJ, AlJaroudi W, Hamoui O, Chaaban S, Chammas E. Multimodality imaging for evaluation of chest pain using strain analysis at rest and peak exercise. Echocardiography. 2018;35(8):1157–1163. [DOI] [PubMed] [Google Scholar]
- 15.Montgomery DE, Puthumana JJ, Fox JM, Ogunyankin KO. Global longitudinal strain aids the detection of non-obstructive coronary artery disease in the resting echocardiogram. Eur Heart J Cardiovasc Imaging. 2012;13(7):579–587. [DOI] [PubMed] [Google Scholar]
- 16.Gaibazzi N, Pigazzani F, Reverberi C, Porter TR. Rest global longitudinal 2D strain to detect coronary artery disease in patients undergoing stress echocardiography: a comparison with wall-motion and coronary flow reserve responses. Echo Res Pract. 2014;1(2):61–70. [DOI] [PMC free article] [PubMed] [Google Scholar]
- 17.Whiting PF, Rutjes AW, Westwood ME, et al. QUADAS-2: a revised tool for the quality assessment of diagnostic accuracy studies. Ann Intern Med. 2011;155(8):529–536. [DOI] [PubMed] [Google Scholar]
- 18.Dwamena BA. midas: A program for Meta-analytical Integration of Diagnostic Accuracy Studies in Stata Division of Nuclear Medicine, Department of Radiology, University of Michigan Medical School, Ann Arbor, Michigan. [Google Scholar]
- 19.Higgins JP, Thompson SG. Quantifying heterogeneity in a meta-analysis. Statistics in medicine. 2002;21(11):1539–1558. [DOI] [PubMed] [Google Scholar]
- 20.Deeks JJ. Systematic reviews in health care: Systematic reviews of evaluations of diagnostic and screening tests. BMJ. 2001;323(7305):157–162. [DOI] [PMC free article] [PubMed] [Google Scholar]
- 21.Fagan TJ. Letter: Nomogram for Bayes theorem. The New England journal of medicine. 1975;293(5):257. [DOI] [PubMed] [Google Scholar]
- 22.Leitman M, Lysyansky P, Sidenko S, et al. Two-dimensional strain-a novel software for real-time quantitative echocardiographic assessment of myocardial function. J Am Soc Echocardiogr. 2004;17(10):1021–1029. [DOI] [PubMed] [Google Scholar]
- 23.Rumbinaite E, Zaliaduonyte-Peksiene D, Lapinskas T, et al. Early and late diastolic strain rate vs global longitudinal strain at rest and during dobutamine stress for the assessment of significant coronary artery stenosis in patients with a moderate and high probability of coronary artery disease. Echocardiography. 2016;33(10):1512–1522. [DOI] [PubMed] [Google Scholar]
- 24.Weidemann F, Jung P, Hoyer C, et al. Assessment of the contractile reserve in patients with intermediate coronary lesions: a strain rate imaging study validated by invasive myocardial fractional flow reserve. Eur Heart J. 2007;28(12):1425–1432. [DOI] [PubMed] [Google Scholar]
- 25.Yang LT, Kado Y, Nagata Y, Otani K, Otsuji Y, Takeuchi M. Strain Imaging with a Bull’s-Eye Map for Detecting Significant Coronary Stenosis during Dobutamine Stress Echocardiography. J Am Soc Echocardiogr. 2017;30(2):159–167 e151. [DOI] [PubMed] [Google Scholar]
- 26.Hoit BD. Strain and strain rate echocardiography and coronary artery disease. Circ Cardiovasc Imaging. 2011;4(2):179–190. [DOI] [PubMed] [Google Scholar]
- 27.Choi JO, Cho SW, Song YB, et al. Longitudinal 2D strain at rest predicts the presence of left main and three vessel coronary artery disease in patients without regional wall motion abnormality. Eur J Echocardiogr. 2009;10(5):695–701. [DOI] [PubMed] [Google Scholar]
- 28.Presti CF, Armstrong WF, Feigenbaum H. Comparison of echocardiography at peak exercise and after bicycle exercise in evaluation of patients with known or suspected coronary artery disease. J Am Soc Echocardiogr. 1988;1(2):119–126. [DOI] [PubMed] [Google Scholar]
- 29.Peteiro J, Bouzas-Mosquera A. Exercise echocardiography. World J Cardiol. 2010;2(8):223–232. [DOI] [PMC free article] [PubMed] [Google Scholar]
- 30.Ishii K, Imai M, Suyama T, et al. Exercise-induced post-ischemic left ventricular delayed relaxation or diastolic stunning: is it a reliable marker in detecting coronary artery disease? J Am Coll Cardiol. 2009;53(8):698–705. [DOI] [PubMed] [Google Scholar]
- 31.Bach DS, Muller DW, Gros BJ, Armstrong WF. False positive dobutamine stress echocardiograms: characterization of clinical, echocardiographic and angiographic findings. J Am Coll Cardiol. 1994;24(4):928–933. [DOI] [PubMed] [Google Scholar]
- 32.Wierzbowska-Drabik K, Plewka M, Kasprzak JD. Variability of longitudinal strain in left ventricular segments supplied by non-stenosed coronary artery: insights from speckle tracking analysis of dobutamine stress echocardiograms in patients with high coronary risk profile. Arch Med Sci. 2017;13(1):82–92. [DOI] [PMC free article] [PubMed] [Google Scholar]
- 33.Ingul CB, Torp H, Aase SA, Berg S, Stoylen A, Slordahl SA. Automated analysis of strain rate and strain: feasibility and clinical implications. J Am Soc Echocardiogr. 2005;18(5):411–418. [DOI] [PubMed] [Google Scholar]
- 34.Reant P, Labrousse L, Lafitte S, et al. Experimental validation of circumferential, longitudinal, and radial 2-dimensional strain during dobutamine stress echocardiography in ischemic conditions. J Am Coll Cardiol. 2008;51(2):149–157. [DOI] [PubMed] [Google Scholar]
- 35.Hanekom L, Cho GY, Leano R, Jeffriess L, Marwick TH. Comparison of two-dimensional speckle and tissue Doppler strain measurement during dobutamine stress echocardiography: an angiographic correlation. Eur Heart J. 2007;28(14):1765–1772. [DOI] [PubMed] [Google Scholar]
- 36.Ingul CB, Stoylen A, Slordahl SA, Wiseth R, Burgess M, Marwick TH. Automated analysis of myocardial deformation at dobutamine stress echocardiography: an angiographic validation. J Am Coll Cardiol. 2007;49(15):1651–1659. [DOI] [PubMed] [Google Scholar]
Associated Data
This section collects any data citations, data availability statements, or supplementary materials included in this article.