

Abstract
The lamprey is a popular animal model for a number of types of neurobiology studies, including organization and operation of locomotor and respiratory systems, behavioral recovery following spinal cord injury (SCI), cellular and synaptic neurophysiology, comparative neuroanatomy, neuropharmacology, and neurodevelopment. Yet relatively little work has been done on the molecular underpinnings of nervous system function in lamprey. This is due in part to a paucity of gene information for some of the most fundamental proteins involved in neural activity: ion channels. We report here 47 putative ion channel sequences in the central nervous system (CNS) of larval lampreys from the predicted coding sequences (CDS) discovered in the P. marinus genome. These include 32 potassium (K+) channels, six sodium (Na+) channels, and nine calcium (Ca2+) channels. Through RT-PCR, we examined the distribution of these ion channels in the anterior (ARRN), middle (MRRN), and posterior (PRRN) rhombencephalic reticular nuclei, as well as the spinal cord (SC). This study lays the foundation for incorporating more advanced molecular techniques to investigate the role of ion channels in the neural networks of the lamprey.
Keywords: Ion Channel, Reticulospinal, Genome
INTRODUCTION
Ion channels are some of the most critical proteins for nervous system function, providing the medium through which ions selectively carry their charges across the neuronal membrane. The passage of charged particles through the membrane ultimately generates changes in membrane potentials required for excitable cells to produce, integrate, and transmit electrical signals. Thus, the specific combinations of ion channels, both voltage-and non- voltage-gated, determines the unique electrical properties of different populations of neurons.
Due to its position as one of the most basal extant vertebrates, the lamprey has long been a popular model organism for developmental and evolutionary biology (Nikitina et al., 2009). In addition, because of its comparatively simpler nervous system and a number of technical advantages, the lamprey is used for a diverse array of neurobiological studies, including organization and operation of locomotor (Grillner, 2003) and respiratory systems (Cinelli et al., 2013), behavioral recovery following spinal cord injury (SCI) (McClellan, 2013), cellular and synaptic neurophysiology (Alford and Alpert, 2014), comparative neuroanatomy (Ebbesson and Northcutt, 1976), neuropharmacology (Homma, 1983), and neurodevelopment (Watanabe et al., 2008). However, studies in this system have been hindered by a paucity of molecular sequence information required for manipulation and quantification of nucleic acid sequences, with few notable exceptions (Hill et al., 2008; McClellan et al., 2008; Novak et al., 2006). With the publication of both the somatic and germline Petromyzon marinus genome (Smith et al., 2018, 2013), this system is now poised to combine traditional electrophysiological and modern molecular approaches to investigate fundamental questions regarding nervous system function and recovery.
For the lamprey, ion channel blockers and various neurophysiological manipulations have been used to identify a number of non-ligand-gated ion channels: voltage-gated sodium channels that contribute to the rising phase of action potentials (Batueva et al., 1996); voltage- gated potassium channels that contribute to action potential repolarization (Batueva et al., 1996) or that regulate spike timing (Hess and El Manira, 2001); high- and low-voltage activated calcium channels (El Manira and Bussières, 1997) that contribute to transmitter release (Krieger et al., 1999) and rebound spike/burst generation (Tegnér et al., 1997); and calcium-activated (El Manira et al., 1994; Hill et al., 1992) and sodium-activated (Wallén et al., 2007) potassium channels that contribute to a post-spike slow afterpolaration and spike frequency regulation. However, in most cases, these experiments have not identified the specific channel subtypes present in lamprey neurons. For example, tetrodotoxin (TTX) blocks voltage-gated sodium (Na+) channels in lamprey neurons (Batueva et al., 1996), but this only narrows down but does not identify the specific Na+ channel subtypes that might be present.
In this paper, we describe the first comprehensive curation of the ion channel genes present in the lamprey genome using a multifaceted bioinformatic approach to sequence identification, followed by reverse transcription polymerase chain reaction (RT-PCR) validation of ion channel expression patterns in the central nervous system of P. marinus. This study presents a first-pass of voltage- and non-voltage-gated K+, voltage-gated Na+, and voltage- gated Ca2+ channel mRNAs present in the anterior (ARRN), middle (MRRN), and posterior (PRRN) rhombencephalic reticular nuclei, as well as the spinal cord (SC). Before investigations into the absolute quantitation of these ion channels at the single neuron level, we sought to ensure their expression in central nervous system tissues and further confirm the predicted coding sequences (CDS) derived from the genome. The reticulospinal (RS) neurons in these three nuclei are both necessary (Paggett et al., 2004) and sufficient (Jackson et al., 2007) for the initiation of locomotion, and the spinal cord contains the neural networks that generate the rhythmic electrical pattern for locomotor behavior (Grillner et al., 1998). Mesencephalic reticular nuclei (MRN) tissues were excluded from this study due to their relatively low number of spinal- projecting neurons (Shaw et al., 2010).
From the predicted coding sequences generated from the P. marinus genome (Smith et al., 2018, 2013), we have annotated 47 high-quality putative ion channel sequences. Of these sequences, 32 were potassium (K+) channels, six were sodium (Na+) channels, and nine were calcium (Ca2+) channels. Only 10 of these 47 ion channels had been described previously, and in varying detail (Hill et al., 2008; McClellan et al., 2008; Novak et al., 2006; Zakon et al., 2017). All ten sequences were independently recaptured in our own analysis of the predicted CDS database. Here, we lay the foundation for future molecular approaches in this system to provide a greater understanding of how specific ion channels contribute to neural function in the lamprey nervous system.
MATERIALS AND METHODS
Ion channel identification
Using the predicted coding sequences (CDS) generated from the P. marinus genome (Smith et al., 2018, 2013), the software package BLAST2GO Pro (Conesa et al., 2005) (version 3.3) was implemented to generate a “BLASTable” database out of these predicted coding sequences. Ion channel protein sequences from Mus musculus, Homo sapiens, Drosophila melanogaster, and Danio rerio obtained from NCBI protein (NCBI, Bethesda, MD, USA) were used as query sequences in a TBLASTN against the P. marinus coding sequences against both the somatic and germline genomes. This resulted in 115 putative P. marinus ion channels being annotated, and these 115 sequences contained some duplicate (100% identity, but varying lengths) and low-quality (short, poor alignment scores) sequences. Culling of these 115 sequences left us with 47 high-quality putative ion channel sequences, through a combination of accepting the longest nucleotide sequences of duplicated sets, and further individual validation of ion channel coding sequences by NCBI TBLASTN against the non-redundant protein database. Names for each channel were designated based on the International Union of Pharmacology (Catterall, 2003a, 2003b; Gutman, 2003) nomenclature. Lamprey channel names for multiple genes of a given subfamily were given an alphabetical designation (a-f) instead of numerical to avoid implying a specific functional classification based solely on orthologous sequence. Sodium channel CDS names were assigned in accordance with the gene names previously given in (Zakon et al., 2017). Annotated P. marinus ion channels sequences were uploaded to GenBank, and accession numbers are available in Table 1.
Table 1.
P. marinus ion channel descriptions and accession numbers identified from predicted CDS. P. marinus ion channels were compared against M. musculus ion channel amino acid sequences to generate percentages. Full length percentages represent how long the predicted P. marinus translated proteins are relative to the corresponding M. musculus amino acid sequences. The best match to a given mouse sequence is shown as the channel type (with associated mouse gene name). Percent identity represents exact amino acid matches to this mouse match, while percent positive represents amino acid that are either exact matches or substitutions that maintain function.
| Channel Family | P. marinus Channel | Description | NCBI Accession # | CDS length | % Full Length | Best Match to M. musculus | % Positive | % Identity |
|---|---|---|---|---|---|---|---|---|
| Voltage-dependent K+ Channels | Kv1a | Shaker-related subfamily | MH726 098 |
11 49 |
74 | Kv1.1 (KCNA1) |
76 | 59 |
| Kv1b | Shaker-related subfamily | MH726 099 |
15 27 |
10 2 |
Kv1.2 (KCNA2) |
78 | 67 | |
| Kv1c | Shaker-related subfamily | MH726 100 |
12 63 |
79 | Kv1.2 (KCNA2) |
83 | 73 | |
| Kv1d | Shaker-related subfamily | MH726 101 |
14 52 |
92 | Kv1.3 (KCNA3) |
84 | 75 | |
| Kv1e | Shaker-related subfamily | MH726 102 |
99 3 |
63 | Kv1.3 (KCNA3) |
73 | 61 | |
| Kv1f | Shaker-related subfamily | MH726 103 |
12 87 |
87 | Kv1.1 (KCNA1) |
72 | 49 | |
| Kv2a | Shab-related subfamily | MH726 104 |
12 69 |
49 | Kv2.1 (KCNB1) |
92 | 85 | |
| Kv3a | Shaw-related subfamily | MH726 105 |
18 99 |
10 8 |
Kv3.2 (KCNC2) |
82 | 73 | |
| Kv3b | Shaw-related subfamily | MH726 106 |
86 4 |
65 | Kv3.2 (KCNC2) |
84 | 76 | |
| Kv5a | Subfamily F | MH726 107 |
12 48 |
82 | Kv5.1 (KCNF1) |
75 | 60 | |
| Kv6a | Subfamily G | MH726 108 |
58 2 |
40 | Kv6.1 (KCNG 1) |
82 | 72 | |
| Kv7a | KQT subfamily | MH726 109 |
13 35 |
87 | Kv7.1 (KCNQ1) |
72 | 64 | |
| Kv7b | KQT subfamily | MH726 110 |
78 0 |
40 | Kv7.4 (KCNQ 4) |
91 | 81 | |
| Kv7c | KQT subfamily | MH726 111 |
53 4 |
22 | Kv7.5 (KCNQ 5) |
56 | 44 | |
| Kv8a | Subfamily V | MH726 112 |
14 16 |
94 | Kv8.1 (KCNV1) |
66 | 48 | |
| Kv8b | Subfamily V | MH726 113 |
12 21 |
98 | Kv8.2 (KCNV2) |
62 | 48 | |
| Kv9a | Subfamily S | MH726 114 |
14 04 |
95 | Kv9.2 (KCNS2) |
72 | 57 | |
| Kv10a | Subfamily H (EAG-related) | MH726 115 |
29 67 |
10 0 |
Kv10.1 (KCNH1) |
80 | 72 | |
| Kv10b | Subfamily H (EAG-related) | MH726 116 |
27 63 |
92 | Kv10.1 (KCNH1) |
62 | 52 | |
| Kv11a | Subfamily H (EAG-related) | MH726 117 |
31 65 |
99 | Kv11.3 (KCNH7) |
63 | 52 | |
| Kv12a | Subfamily H (EAG-related) | MH726 118 |
21 87 |
66 | Kv12.1 (KCNH8) |
77 | 66 | |
| HCN Channels | HCNa | CNG/hyperpolarization-activated mixed cation | MH726 119 |
39 33 |
10 8 |
HCN4 | 74 | 64 |
| Two-pore Domain Leak Potassium Channels | KCNKa | Subfamily K | MH726 120 |
99 6 |
99 | Kcnk1 | 64 | 51 |
| KCNKb | Subfamily K | MH726 121 |
95 1 |
65 |
Kcnk1 0 |
81 | 65 | |
| KCNKc | Subfamily K | MH726 122 |
13 89 |
10 8 |
Kcnk1 2 |
68 | 60 | |
| KCNKd | Subfamily K | MH726 123 |
79 5 |
65 |
Kcnk1 3 |
69 | 55 | |
| KCNKe | Subfamily K | MH726 124 |
89 4 |
10 2 |
Kcnk1 6 |
57 | 42 | |
| KCNKf | Subfamily K | MH726 125 |
69 9 |
59 |
Kcnk1 8 |
55 | 40 | |
| Na+ Channels | Nav1α | Alpha subunit | MH726 126 |
58 65 |
97 | Nav1.1 (SCN1A) |
74 | 64 |
| Nav1β | Alpha subunit | MH726 131 |
30 45 |
59 | Nav1.8 (SCN8A) |
63 | 55 | |
| Nav1γ | Alpha subunit | MH726 127 |
30 06 |
51 | Nav1.8 (SCN8A) |
59 | 47 | |
| Nav1δ | Alpha subunit | MH726 128 |
41 55 |
69 | Nav1.9 (SCN11 A) |
70 | 54 | |
| Nav1ε | Alpha subunit | MH726 129 |
49 83 |
90 | Nav1.2 (SCN2A) |
60 | 45 | |
| Nav2 | Alpha subunit | MH726 130 |
51 48 |
82 | Nav1.5 (SCN5A) |
56 | 38 | |
| Ca2+ Channels | Cav1a | L-Type alpha subunit | MH726 132 |
18 24 |
28 | Cav1.4 (CACN A1F) |
76 | 69 |
| Cav1b | L-Type alpha subunit | MH726 133 |
16 32 |
25 | Cav1.3 (CACN A1D) |
81 | 73 | |
| Cav1c | L-Type alpha subunit | MH726 134 |
17 52 |
27 | Cav1.3 (CACN A1D) |
78 | 71 | |
| Cav1d | L-Type alpha subunit | MH726 135 |
24 06 |
69 | Cav1.3 (CACN A1D) |
60 | 49 | |
| Cav2a | P/Q-Type alpha subunit | MH726 136 | 77 7 |
14 | Cav2.1 (CACN A1A) |
85 | 76 | |
| Cav2b | N-Type alpha subunit | MH726 137 |
27 42 |
39 | Cav2.2 (CACN A1B) |
61 | 53 | |
| Cav2c | P/Q-Type alpha subunit | MH726 138 |
10 71 |
17 | Cav2.1 (CACN A1A) |
76 | 66 | |
| Cav3a | T-Type alpha subunit | MH726 139 |
31 77 |
64 | Cav3.2 (CACN A1H) |
61 | 55 | |
| Cav3b | T-Type alpha subunit | MH726 140 |
23 49 |
34 | Cav3.3 (CACN A1I) |
88 | 73 | |
| Ca2+ Activated K+ Channels | Kca1a | Subfamily M (BK) | MH726 141 |
24 18 |
62 | Kca1. 1 (KCNM A1) |
70 | 63 |
| Kca2a | Subfamily N (SK) | MH726 142 |
56 4 |
44 | Kca2. 2 (KCNN 2) |
94 | 89 | |
| Na+ Activated K+ Channels | Slo2a | Subfamily T | MH726 143 |
12 78 |
38 | Slo2.2 (KCNT1) |
84 | 73 |
| Slo2b | Subfamily T | MH726 144 |
96 9 |
43 | Slo2.2 (KCNT1) |
78 | 69 |
Cluster Dendrogram and Phylogenetic Analyses
P. marinus amino acid sequences translated from the predicted coding sequences from the genome were aligned against the same ion channel families from Mus musculus, Danio rerio, Rattus norvegicus, and Homo sapiens as these species have primary annotation and high-quality sequences. Sequences were acquired through NCBI protein (NCBI, Bethesda, MD, USA) searches across gene subfamilies. Multiple sequence alignment based on predicted protein sequences was carried out with NCBI’s Constraint Based Multiple Alignment (COBALT) tool (https://www.ncbi.nlm.nih.gov/tools/cobalt/) using default parameters (Papadopoulos and Agarwala, 2007). The advantage of COBALT for phylogenetic analysis lies in that it incorporates conserved protein domains and motifs, improving alignment beyond simple amino acid comparisons. We used these COBALT alignments to construct cluster dendrograms based on these progressive multiple alignments, and visualized these as trees to determine rough approximations of phylogenetic relations.
We also used COBALT to generate alignments for protein sequences of subsets of gene families (see Figure 1) from P. marinus, M. musculus, and D. rerio, and these are visualized as dendrograms labeled “COBALT.” We then used these same alignments to construct phylogenetic trees both through Minimum Evolution (ME; (Desper and Gascuel, 2003)) and Neighbor Joining (NJ; (Saitou and Nei, 1987)) methods using the Grishin distance model (Grishin, 1995) using a maximum sequence difference value of 0.85.
Figure 1. COBALT cluster dendrogram analysis of identified P. marinus ion channel sequences.

P. marinus (Pm-) ion channel amino acid sequences were used in an analysis with orthologous Danio rerio, Mus musculus, Homo sapiens, and Rattus norvegicus ion channel amino acid sequences to create a cluster dendrogram using NCBI’s COBALT (left). Ion channel families are labeled, and species identification is colored with P. marinus = cyan, D. rerio = orange, M. musculus = green, H. sapiens = purple, R. norvegicus = red. The red lettering indicates group identifications that were split across multiple nodes, and suggested discrepancies in the ability of COBALT to appropriately resolve relationships. As a result, we systematically removed sequences from the analysis based on their length, and reiterated the clustering until more coherence was achieved in the grouping of channel families (right dendrogram). Green lettering indicates group identification that was improved following removal of sequences with short predicted length (<25% full length). Red arrows indicate the following four P. marinus sequences that were removed between the analyses on the left and right dendrograms (Pm- Kv7c, Pm-Cav1b, Pm-Cav2a, and Pm-Cav2c).
Primer Design
In order to validate identified predicted ion channel sequences in a biological context, gene specific primers targeted to the coding sequence of a given channel were designed using IDT’s PrimerQuest Tool (www.idtdna.com/SciTools), which incorporates Primer3 (version 2.2.3) software. Two primer sets were designed for each ion channel identified from the P. marinus genome predicted CDS. The first primer set was designed to produce amplicons in the range of ~500 bp, denoted as Assay1 (Table 2). An exception to this is the primer set for Assay1 for Cav2c, which only contained 390 nucleotides in its incomplete coding sequence pulled from the genome. The second primer set was designed to produce amplicons in the ~300 bp range, denoted as Assay2 (Table 3). Exceptions to this include Kv1e and Kv11a since their highest quality primers produced amplicons beyond 400 bp. To validate our primers, PCRs were optimized against whole central nervous system RNA extracted from pooled brain and spinal cord tissues. The reasoning behind generating two assays for measuring the same transcript was to compensate for both potential errors in the coding sequence prediction and less than optimal primer efficiencies.
Table 2.
Target ion channel primer sequences and amplicon sizes for RT-PCR Assay 1.
| Gene | Forward / Reverse 5’−3’ sequence | Amplicon (bp) |
|---|---|---|
| Kv1a | AAGTCCATGCCAATCGTACC / CACATATCTCCGTAGCCAACC | 517 |
| Kv1b | CTCCATCATCATCTTCTGTCTGG / ATTCCGTCTTCTTGCTGTCC | 527 |
| Kv1c | ATCATGCCCTACTTCATCACG / GCTGTTACTCCTCTTGATCTGG | 561 |
| Kv1d | AAGTCGCTCGACCAATTCC / GTGCCATTGATGTCCTTTGC | 470 |
| Kv1e | GTACTTCATCACCCTCATCACC / AATGACTCCTTGGCTTCAGG | 513 |
| Kv1f | CGAATTGGCCAGCTTTGG / CCATGACCAAGGAGAAGACG | 504 |
| Kv2a | AGCACAAGGATGAGTTCTCG / CTACAGTGGTCATGGTGATGG | 492 |
| Kv3a | CGCACATCCTCAACTACTACC / GTCTCAACATCGACGTACACC | 496 |
| Kv3b | CTTCATCCTCGTCTCCATTACC / TCGTGAAGTGTGTCTTGTCC | 548 |
| Kv5a | CCCTGCGGTTCTTCTCC / TTGATGATCGGGTGGATGG | 505 |
| Kv6a | ACCCGCTCAACATCATCG / CGAGAAGGTGTGGAAGATGG | 497 |
| Kv7a | TACTTGGCTCGGGATTTGC / TCTTGTGGGATTCTGTCAACC | 516 |
| Kv7b | CTCAAGTTCTCCAGGAAGCC / CAAAGTGTTTCTGCCGATGC | 511 |
| Kv7c | CAGCTCATGCGCAGTCG / CTGAGCATGTCAAGGTGTCC | 467 |
| Kv8a | CGCGTGGTTCACTGTCG / CAAAGAGGATGCAGAGGAAGG | 497 |
| Kv8b | GGCACCAAGTTCAGGATCG / GTCTCCTCACCTGGAAATGC | 403 |
| Kv9a | GCTACGTCCTCAACTTCTACC / CGCAATGCAGAAACACTCC | 473 |
| Kv10a | CAGCCCATAGAAGACGATTCC / AGAGCAGGTCGATAACAAACC | 493 |
| Kv10b | TGCTCTTCTTGAGCATCTTCC / CCACGTCTTGAGATACTTTGTCC | 515 |
| Kv11a | ATCCCGCCCAAAGTAAAGG / ATGAGCGTTGTTGTCTCTCC | 503 |
| Kv12a | CCAGAAGTCTCGCTTCATCC / GCTCTGCCGATCTTGTACC | 522 |
| HCNa | CGGCTCATCCGTTACATCC / CCCTCTCGAAACCTATTCTGC | 488 |
| KCNKa | CACTGTTCTTCGCCAGTACC / CAGCAGCATGGAGATGAGG | 488 |
| KCNKb | GCAGCCTGTGGGATTTAGG / CTGAGAATAGCGGCAAAGTAGG | 502 |
| KCNKc | AATCAATCGGCTCGTCATCC / TCGTTGTTGTTGTTGTTGCG | 498 |
| KCNKd | CTCGCTCTACTTCTGCTTCG / CCAAGCGATTGTTCATGATGG | 542 |
| KCNKe | AGCGCACTGCTCTTTACC / GTCGTAGATAATGCGTGGTAGG | 488 |
| KCNKf | ACAATCTTCACGACCATAGGC / CGTCCAGGTAACTCCATTCC | 514 |
| Nav1α | GTACAAACTGGAAGGGAGTAAGG / CTCTGATTCCTGCTCTCATTGG | 495 |
| Nav1γ | AACCTTGTGCTCCTCAACC / TCTTCTTCTTCACGCCATCC | 511 |
| Nav1δ | GGAGTATCTTTACCAGCAGACC / CTCCTCGTAGTTGCTCTTTCG | 506 |
| Nav1ε | GGATGTTCCGAGTGATGAGG / TTGGTGTAGCCGTAGTTTGG | 493 |
| Nav2 | GACGACCATATTCATAGCAGAGG / GGGATGCAGTAGTAGATGTTGG | 498 |
| Nav1β | GGTGGACATCAAGAAGGATGG / CTTACCCTCATCCCTTCAAACC | 546 |
| Cav1a | AGTTCAGCCACGTGATGG / GACTTGATGAAGGTCCAGAGG | 298 |
| Cav1b | CAGTGTGCGTTTCTGTTTGG / GGTCCAAGAGGTTGAAGTAGC | 504 |
| Cav1c | AGGAAGAGGAGGAAGAAGAGG / CACGCGGAGGATCTTTACC | 488 |
| Cav1d | CATCACATTCTTCCGTCTCTTCC / CGTCAGGTAGTCAAAGTTGTCC | 472 |
| Cav2a | GTTTGGCAACGTGAAACTCG / CAGCTATCGGCATATCCATCC | 497 |
| Cav2b | GCAACAACGCAGACAATACG / CACAAGTCGCGGAAGTAGG | 490 |
| Cav2c | TGGTGGTGGTGGGATGG / TCCTCGTCGGGAAGATGC | 357 |
| Cav3a | TCAACACCGTCAGCATGG / GTGACGATTGCCCAGAGG | 481 |
| Cav3b | ACTGCAACTACGTCTTCACC / TCCTTCATGATGCCGTTCC | 493 |
| Kca1a | AGAACCAACAGAACCTGACG / GGATCTGGGCAGTACTTATTCG | 499 |
| Kca2a | ACAATGGTGCAGATGACTGG / GTAGCCAATGGTGAGGAACG | 488 |
| Slo2a | TTGCCCTCAAGTTCATCTCC / AGAACAGTGTGCAGATCAGG | 486 |
| Slo2b | ACGAGCAGCAGAAGAAAGG / TTGAAGCTGTAGGCCTTGG | 508 |
Table 3.
Target ion channel primer sequences and amplicon sizes for RT-PCR Assay 2.
| Gene | Forward / Reverse 5’−3’ sequence | Amplicon (bp) |
|---|---|---|
| Kv1a | CTTTCAGCAGCACGTATGGC / CTTGGACAGGCGTAAAAGCG | 279 |
| Kv1b | ACGAGTACTTCTTCGACCGC / GTAGAGGTCTGCATCGTCGC | 365 |
| Kv1c | CGTGAAGGAGGAGGAGAAGC / GAAGCTGAACCACACGATGC | 334 |
| Kv1d | CGTCATCCTCTTCTCCAGCG / TGAGACGTGCAGGTAGTTCG | 286 |
| Kv1e | TTGGCTTCTCTTCGAGTCGC / GCGACAGCTTGAATATGCGG | 470 |
| Kv1f | CATCTCCATCCTGCCCTACG / CCTCGGCGAAGTAGATAGCG | 269 |
| Kv2a | TCGGTGCTCAACTTCTACCG / GCGAGGAGTTTGGGTTTTCG | 277 |
| Kv3a | ATGATCTTCTACGCGGAGCG / CTTTGGCAGCTTCTGCTTGG | 279 |
| Kv3b | ACATCATCGACCTCATCGCC / GGTACATGTCACCGTAGCCC | 381 |
| Kv5a | GCAGGAGATGGACTTCTGGG / GGAGGACACGACGATGAACG | 265 |
| Kv6a | CTGCCCTACTACGTGACGC / CGTTCTCCGCCAAGTAGACC | 277 |
| Kv7a | CGATCTCGTGGTAGTGGTGG / CCAAAGTGCGTCAGCATAGC | 304 |
| Kv7b | GATCGTGGTGTTTGGCATCG / GGCCAGATAGACGAGGAACG | 361 |
| Kv7c | CGTGGTCAACAACAATCCCC / CCGAGTACTGCTCGATGACG | 320 |
| Kv8a | AACGCGACACCATCCTAAGC / CAGCGCCGTGATGTAGTAGG | 395 |
| Kv8b | GACGTCTGCGACGACTACG / TCACAAACTCGTCCTCCAGC | 268 |
| Kv9a | CGAAGACCCGTCTCTCATGG / CCGAGAAGATGGAGATGCCC | 368 |
| Kv10a | ACGTCTTCTGGAAAGAGCGG / TTGTCGTAGAACGAGCCTCC | 388 |
| Kv10b | GGTGCGTAACGAGTTGAACG / GATGTTCCGAGGGGTCTTGG | 283 |
| Kv11a | GGGTGGCTGGATCAACTAGG / ACTCGGGGAAGCCTTTTAGC | 421 |
| Kv12a | ATATGTGAGCAAGTCGGGGC / GTGTTGTTGGTGTGGAACGG | 396 |
| HCNa | TGGGGATCACTTTCTTCCACG / GCCGGGAGAGTCTTAGAAGC | 336 |
| KCNKa | TCGTTGACGTGCTTCCTCG / CAGTGCAGACACGAAGTCCC | 347 |
| KCNKb | CCGTTTGAGATGAGCCAACG / CCTTGCCGAAGATAGTCCCC | 355 |
| KCNKc | ACCGTGGTCTCAACGATTGG / CATGACGTGGTAGACGGACG | 276 |
| KCNKd | AGTCGAGGACTGGAGCTACG / GTCTCGATGGAGATGGTGCG | 327 |
| KCNKe | AAAGCTTTTGTGCTTCTGCCC / TGGCGATTCGTTTGTCATCG | 295 |
| KCNKf | GCACCAAAATCGACGACAGC / CGATGGTGGTCATTGTCACG | 300 |
| Nav1α | ACGGAATAGGGCATACAGCG / CTTGAGCCGCAATCTTCAGC | 341 |
| Nav1γ | GAGACCCTGCAGAGTAACGG / GACGACGCACAAACTCATCG | 355 |
| Nav1δ | CAAGGAGCTCATCTCGGAGC / CCAGGACCTTGATCACCACC | 335 |
| Nav1ε | CAGAAGGAGGATCAGGTCGC / CGTGGAGACAGCACAAAAGC | 350 |
| Nav2 | TCAACCTGGTATTCACGGGC / GGAAGATGCTCACTCCGAGG | 351 |
| Nav1β | GAACGACATGAGCTCGTCGG / TCTGGATCGTCTTCCTTCGC | 317 |
| Cav1a | TCTTCACGTTCCTCTTCACCG / CTCGTGCCAGAAGTTTGACG | 225 |
| Cav1b | CCGTTTTGACTGCTTCGTGG / GAGGATCTGCTGGAAGACGG | 346 |
| Cav1c | CGCAGCAGGATAACATTGGC / TGAGCGTGTTGAGGAAGACC | 280 |
| Cav1d | GCTCCTAAGCAAGGGAGAGG / TTCCCCAACGTTGTAGTCCG | 310 |
| Cav2a | CGAGTTTGTGCGAATCTGGG / CGCACTCAAACTTGTCAGCC | 269 |
| Cav2b | AGTCGCACACGTTCTACTGG / AAATCCTGAGCAGACGGAGC | 318 |
| Cav2c | CAGACAATGGCGCAGAGGG / AGCTTCTTGGACAGTGGCG | 251 |
| Cav3a | CTTTGGCTACATCCGCAACC / GATCGGGGATTGTGTCTCCC | 311 |
| Cav3b | ATCAACCCGACCATCATCCG / AGGTAAGAGATGCACTGCCG | 368 |
| Kca1a | CTTCATTGCACAGAGCTGCC / TCTTCTTTGGGTCGGTCACG | 401 |
| Kca2a | GCACAGCAAACTCTTCACCG / CTGTGAGTAGACAGACGCCC | 311 |
| Slo2a | CTACCTGTACATGGAGCGGC / CATCGATCTTGACTCGCACG | 269 |
| Slo2b | CAAGAGCTTCACATTCGCGG / GATACTCTGCACGGGGATGC | 259 |
Tissue collection and RNA preparation
Experiments were performed on larval sea lampreys (Petromyzon marinus) that were collected from streams and rivers in Michigan and Massachusetts. Animals (lengths ~80–120 mm) were maintained in ~10 L aquaria at ~22–24°C. The procedures were approved by the Animal Care and Use Committee at the University of Missouri, USA. For surgical procedures, animals were anesthetized in ~200 mg/l tricaine methanesulfonate (MS-222; Crescent Research Chemicals, Phoenix, AZ USA). Following anesthesia, the brain and upper spinal cord were removed and pinned dorsal-side-up on a small, rectangular strip of Sylgard (#184; Dow Corning, Auburn, MI USA). Three types of tissue were collected for molecular analysis: brain plus spinal cord (n = 3 animals); spinal cord alone (n = 9); and brain tissue containing individual reticular nuclei (n = 9). Brain and spinal cord mixed tissue was used as a representative for assay quality (Figure 6). Tissues extracted were pooled in triplicate in order to generate a sufficient amount of RNA for the number of PCR reactions per sample (n = 94) and to reduce potential animal-to-animal SNP variability. For the latter procedure, the brain was pinned flat, and a fine scalpel blade (Beaver “mini-blade” 376500, Arista Surgical Supply, New York, NY USA) was used to make dorsoventral cuts in the brain to isolate brain tissue containing individual left and right reticular nuclei (Shaw et al., 2010): anterior (ARRN); middle (MRRN); and posterior (PRRN) rhombencephalic reticular nuclei. Thus, in addition to containing RS neuron cell bodies, these brain tissue blocks also will contain axons, glial cells, possibly some non-RS neurons, blood vessels, and connective tissue. The brain and spinal cord tissue were placed into 350 µL of Trizol lysis buffer (Invitrogen, Carlsbad, CA, USA).
Figure 6. P. marinus central nervous system ion channel distribution.

(A) Diagram of lamprey brain (left) and upper spinal cord (SC). Contours showing the four reticular nuclei (Shaw et al., 2010): mesencephalic reticular nucleus (MRN) and anterior (ARRN), middle (MRRN), and posterior (PRRN) rhombencephalic reticular nuclei. Dotted lines indicate tissues collected for RNA extraction and subsequent PCR reactions (see Methods). (B) Images of 2% agarose gels stained with ethidium bromide that were used to resolve gene-specific amplicons generated from PCR reactions on mixed brain and spinal cord tissues. The first lane of each row contained GeneRuler 100 bp ladder with the 500 bp sequence indicated with an arrow. Assay 1 was designed with amplicons around 500 bp (see Table 2), while Assay2 was designed with amplicons around 300 bp (see Table 3).
Directly following dissection, tissues were homogenized using a PowerGen 125 (Thermo Fisher Scientific, Waltham, MA, USA) with settings on high (5–6) for 2 min for visible homogenization of tissue. Remaining insoluble tissues were pelleted out using centrifugation, and the supernatant drawn off and stored in a −80º C freezer until extraction of RNA. Following the manufacturer’s protocol (Invitrogen), total RNA was isolated by phenol-chloroform extraction and thereafter treated with DNase I on the Quick RNA Micro-prep Kit IC columns (Zymo Research, Irvine, CA, USA) to remove potential genomic DNA contamination. Quality and amount of RNA was measured using a Nanodrop-1000 Spectrophotometer (Thermo Fisher Scientific). All samples used in this study had an absorbance ratio at 260:280 nm of ~2.0.
cDNA synthesis and RT-PCR
cDNA was generated using oligo-dT and random hexamer primed reverse transcription (RT) with the qScript cDNA SuperMix (QuantaBio, Beverly, MA, USA), per the manufacturers protocol. Up to 1 µg of total RNA was added to the Supermix reaction, and the subsequently produced cDNA was diluted 1:5, following heat inactivation of RT enzyme, as to allow for a sufficient amount of cDNA for each PCR reaction. RT-PCR was carried out using GoTaq Green Master Mix (Promega, Madison, WI, USA) with the following PCR cycling conditions: 94°C hold for 4 min; 35 cycles of 94°C for 30 s, 55°C for 30 s, and 72°C for 30 s; 72°C hold for 7 min. Reactions were carried out in 20 µL total volume on a 2720 Thermo Cycler (Applied Biosystems, Foster City, CA, USA). Gene specific primers were used at 1 µM final concentration for each forward and reverse primer for each reaction.
For each tissue type, six rounds of RT-PCR were carried out (N=3 each for Assay1 and Assay2; Tables 2 and 3) with gene specific primers designed against predicted coding sequence from the P. marinus genome with known amplicon sizes.
Gel Image Analysis
PCR reactions were visualized on 2% agarose gels stained with Ethidium Bromide (Sigma-Aldrich, St. Louis, MO, USA). Gel Electrophoresis was carried out in sodium borate (Sigma-Aldrich) buffer at 100 V for 1 hour. The first lane of each gel included a Gene Ruler 100 bp ladder (Thermo Fisher Scientific). Gels were imaged by exposure to UV illumination on a Gel Logic 200 Imaging system (Kodak, Rochester, NY, USA). Images were subsequently analyzed using the Fiji image processing software package of ImageJ (Schindelin et al., 2012) using the Gel plugin. Bands on each gel were determined to be present if they both fell within the expected amplicon size and had an intensity signal with a value greater than that of the background intensity determined by ImageJ. Bands were considered negative if their intensity was not greater than background or if there was no band in the expected size range.
RESULTS
Ion Channel Identification
From the predicted coding sequences (CDS) generated from the P. marinus genome, 47 putative ion channel sequences were annotated and made publicly available on GenBank for BLASTing and future investigations. Of these sequences, 32 were potassium (K+) channels, six were sodium (Na+) channels, and nine were calcium (Ca2+) channels (Table 1). Using both BLAST and phylogenetic based methods for identification of putative ion channels, we saw a strong overlap between the results of both techniques for assigning P. marinus ion channels into subfamilies, but it was difficult to further assign specific subfamily membership (e.g. Kv1.1 vs Kv1.2). Therefore, we gave an alphabetical designation (a-f) instead of numerical to avoid implying a specific functional classification based solely on orthologous sequence.
We first used COBALT cluster dendrogram comparisons of P. marinus with M. musculus, D. rerio, R. norvegicus, and H. sapiens to generate constraints on our subsequent phylogenetic analyses (Figure 1). When all sequences were combined in this analysis, the initial resulting dendrogram contained relationships that did not seem phylogenetically sound (Figure 1, left). For example, voltage-gated calcium channels were distributed across three different nodes. We thought it likely that sequence length for some of the P. marinus sequences were likely responsible (Moret et al., 2002), particularly for the voltage-gated Ca2+ channels. Stepwise progressive removal of the shortest P. marinus sequence revealed a cutoff of 25% full length sequence being necessary for dendrograms that resulted in largely coherent channel families. We used the dendrogram with four sequences removed (Pm-Kv7c, Pm-Cav1b, Pm-Cav2a, PmCav2c) to constrain our subsequent analysis of gene families (Figure 1, right). We chose the 5 most basal nodes from the combined COBALT analysis to probe in separate analyses: KCNK+Kca/Slo, Kv1–6+9, CaV+NaV, Kv10–12+HCN, and Kv7. Further comparisons were reduced to only 3 species (P. marinus, M. musculus, and D. rerio) in order to increase visibility of individual sequence identification. The four removed sequences were restored for these more focal analyses in the subsequent sections.
Two-pore-domain Potassium (KCNK) and Calcium/Sodium-Activated Potassium Channels (Slo and Kca)
We identified 10 non-voltage-gated K+ channels that belong to two major groups of channels: the two-pore-potassium (K2P) leak channels (KCNK family) and calcium/sodium activated K+ channels (Slo and Kca channels). In our coarse COBALT based dendrogram, these clustered together as one of the major nodes, thus we grouped them together for further analysis. Among these channel subtypes, we identified six putative KCNK K2P chanels, two putative Ca2+ activated K+ (Kca) channels, and two putative Na+ activated K+ (Slo) channels (see Table 1). COBALT clustering analysis fairly neatly classifies these into four distinct groups, including the KCNKs as a single node, and the Slo channels as another distinct group (Figure 2A). The COBALT analysis separates the KCa1 and KCa2 subfamilies, and classifies P. marinus Kca2a as being most closely associated with the mouse and zebrafish Kca2 proteins. In this analysis, Pm-Kca1a most strongly resembles the subfamily M of large-conductance (BK) Ca2+ activated K+ channels, while Kca2a resembles the small-conductance (SK) counterpart. In fact, Kca2a has 94% positive identity with a P. marinus SK channel previously identified (accession number ABQ96269.1) using a degenerate primer approach in a study examining relative changes in mRNA expression in reticular nuclei resulting from spinal cord injury (McClellan et al., 2008). In the COBALT analysis, we also classify two Slo channels that have not been previously described, designated Slo2a and Slo2b. Pm-Slo2b associates with the mouse and zebrafish Slo channels, while Pm-Slo2a is more closely associated with the Kca1 channels – even though BLAST suggests the closest ortholog in mouse to be Slo2.2 (Table 1). This could be due to the fact that this is a relatively short sequence (predicted 38% full length), and indeed this sequence was not able to be placed in the subsequent phylogenetic analyses (Figures 2B and 2C). Thus, we are least confident in the identification of this sequence.
Figure 2. Two-pore-domain Potassium (KCNK) and Calcium/Sodium-Activated Potassium Channels (Slo and Kca) identified in P. marinus.

We used the clustering from the combined COBALT analysis in Figure 1 to subset channel families for more detailed phylogenetic analysis. Because the KCNK and Slo/Kca channels formed a coherent node in the combined analysis, we performed subsequent (A) COBALT as well as (B) Minimum Evolution (ME) and (C) Neighbor Joining (NJ) phylogenetic analyses on these predicted amino acid sequences from putative lamprey ortholog coding sequences as well as protein sequences from Mus musculus (Mm) and Danio rerio (Dr). Lamprey (Petromyzon marinus, Pm) sequence is noted in red. This analysis included a previously identified SKKCa sequence, labeled as Pm-SKKCa** (McClellan et al. 2008). All putative ortholog sequences from lamprey are included in the COBALT analysis, while ME and NJ results in some sequences not being retained due to exceeding the maximum allowed fraction of mismatched bases in the aligned sequences.
The two phylogenetic algorithms (ME and NJ) are largely congruent in their results (Figures 2B and 2C). Both distinguish a clear KCNK node that contains all of the putative lamprey KCNKs. Only two KCNKs can be resolved with some confidence in their closest orthologs: both ME an NJ suggest that Pm-KCNKa is the lamprey ortholog of KCNK, while NJ (but not ME) places Pm-KCNKb as an ortholog to KCNK10. The remainder are not resolved with respect to direct orthology with one of the identified KCNK subtypes. Pm-KCa2a remains strongly associated with the mouse and fish KCa2 family, and Pm-Slo2a resolves with Mm- Slo2.1 and provides some confidence that this is an orthologous sequence despite the COBALT analysis. The phylogenetic analyses failed to retain both Pm-Kca1a and Pm-Slo2b, suggesting that further sequencing will be necessary to better resolve these relationships.
Voltage-Gated Potassium Channels (Kv family)
In our analysis of the predicted coding sequences from the genome of P. marinus, we identified 21 putative voltage-gated K+ channels that belonged to the Kv family. Of the 21 putative voltage-gated K+ channels identified, we assigned six to the Kv1 Shaker-related subfamily, one to the Kv2 Shab-related subfamily, two to the Kv3 Shaw-related subfamily, one to the Kv5 F subfamily, one to the Kv6 G subfamily, three to the Kv7 KQT subfamily, two to the Kv8 V subfamily, one to the Kv9 S subfamily, and four to the Kv10/11/12 H subfamily (Table 1). We did not find any channels by BLAST that most closely resembled Kv4 channels, hence they are absent from these results and analyses. Previously in 2008, two P. marinus voltage-gated K+ channels were described in an investigation into ion channel distributions in the axonal initial segment and nodes of Ranvier in early chordates (Hill et al., 2008). The two sequences were considered partial sequences and not ascribed to any subfamily (accession numbers ACN22035.1 and ACN22034.1), but seem to most closely resemble members of the KQT subfamily (Kv7) with high sequence similarity (>90%) to the Kv7b and Kv7c sequences reported here.
Our preliminary COBALT dendrogram analysis placed the Kv1, Kv2, Kv3, Kv5, Kv6, Kv8, and Kv9 subfamilies together as one coherent node, and separated the Kv10/11/12 H subfamily with HCN (hyperpolarization-activated cyclic nucleotide gated) channels (Figure 1). Finally, Kv7 was a distinct node on the COBALT analysis (Figure 1). Thus, we moved them forward into phylogenetic analyses based on these preliminary results.
COBALT analysis discretely separates each of the Kv1, Kv2, Kv3, Kv5, Kv6, Kv8, and Kv9 subfamilies, including putative lamprey orthologs of each (Figure 3A). Virtually all of these orthologs are included in the subsequent ME and NJ analyses, suggesting that the quality of identified sequence for this general family of channels was higher than the rest (Figure 3B and 3C). Each of the subfamilies has clear phylogenetic conservation, and confidence that these are appropriately identified lamprey orthologs for each of these subfamilies is fairly high. It is only for the Kv1, Kv3, and Kv8 subfamilies that we identified multiple subtypes. In both COBALT and the phylogenetic analyses Pm-Kv8a and Pm-Kv8b clustered with Kv8.1 and Kv8.2 orthologs respectively (Figure 3A, 3B, 3C). However, in the Kv1 subfamily, there were not clear subtype relationships among the lamprey Kv1 channels and the mouse and zebrafish orthologs (Figure 3A, 3B, 3C). Finally, only Pm-Kv3a was retained in the phylogenetic analyses, and it does not cluster clearly with Kv3.1 or Kv3.2 but rather as an outgroup in this node (Figure 3B, 3C).
Figure 3. Voltage-gated (Kv) potassium channel families and subtypes identified in P. marinus.

Voltage-gated K+ channels of the (A-C) Kv1, Kv2, Kv3, Kv5, Kv6, Kv8 and Kv9 families are represented based on their initial clustering patterns in the combined COBALT analysis in Figure 1. No Kv4 type channels were identified by BLAST analysis. Plots were generated and are presented in the same manner as described in Figure 2.
Our combined COBALT analysis resolved the ether-a-go-go (Eag) family of voltage- gated potassium channels (Kv10, Kv11, and Kv12) as a distinct node that also included the HCN channels, as well as left KCNQ/M-type channels (Kv7) as their own cluster as well (Figure 1). Therefore, we performed subsequent phylogenetic analysis with this organization intact. Each of the Kv10, Kv11, Kv12, and HCN channel subtypes formed distinct clusters by COBALT analysis (Figure 4A), and these persisted with subsequent ME and NJ phylogenetic analyses that retained all of the lamprey Kv10, Kv11, KV12, and HCN sequences (Figures 4B, 4C). The COBALT dendrogram suggests that the two putative lamprey Kv10 channels (Pm-Kv10a and Pm-Kv10b) are orthologs to the Kv10.1 and KV10.2 channels respectively. However, these relationships were not conserved in the ME and NJ analysis where Pm-Kv10a and Pm-Kv10b cannot be resolved with respect to their orthology (Figures 4B, 4C). We identified 3 Pm-Kv7 channels (Figure 4D), and phylogenetic analysis suggests that Pm-Kv7a may be orthologous to the Kv7.1 channel subfamily while Pm-Kv7b could not be resolved in this respect. Pm-Kv7c was not retained in the ME and NJ trees, likely due to the minimal predicted sequence length (22%): Pm-Kv7c was one of the four channels we removed in Figure 1 (right).
Figure 4. Eag, HCN, and KCNQ/M-type channel families and subtypes identified in P. marinus.
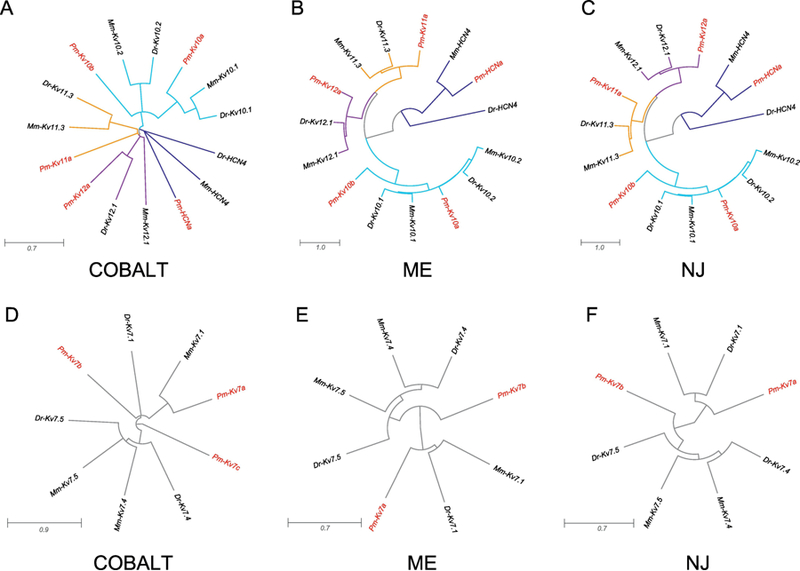
Channels of the (A-C) Kv10–12 (Eag-like), HCN, and (D-F) Kv7 (KCNQ/M-type) families are represented based on their initial clustering patterns in the combined COBALT analysis in Figure 1. Plots were generated and are presented in the same manner as described in Figure 2.
Voltage-gated Sodium and Calcium Channels
From the genome of P. marinus, we identified nine putative voltage-gated Ca2+ channels. Of these nine Ca2+ channels, four most closely resembled L-type (Cav1a-d), two resembled P/Q-type (Cav2a and Cav2c), one resembled N-type (Cav2b), and two resembled T- type (Cav3a-b) (Table 1). One voltage-gated Ca2+ channel in P. marinus was previously identified (Accession number ABQ96268.1) using a degenerate primer approach in a study examining relative changes in mRNA expression resulting from spinal cord injury (McClellan et al., 2008). This sequence was identified to be a high voltage activated (HVA) Ca2+ channel and had best alignment with Cav2a (99%), as well as resembled a P/Q-Type HVA Ca2+ channel (Figure 5A, Pm-HVA-Calcium). We also identified six putative voltage-gated Na+ channels. These channels were independently identified as the same six Na+ channel gene sequences previously identified in P. marinus (Zakon et al., 2017), five of which most closely resembled members of the Nav1 family, and one of which resembled Nav2. The original two voltage-gated Na+ channels identified in P. marinus (Accession numbers ABB84815.1 and ABB84816.1) (Novak et al., 2006), simply named sodium channel 1 and 2, had the highest similarity against Nav1β (99% identity) and Nav1γ (97% identity), respectively.
Figure 5. Voltage-gated sodium and calcium channel families and subtypes identified in P. marinus.

Voltage-gated Na+ and Ca2+ channels of the (A-C) Nav and Cav1, Cav2, and Cav3 families are represented based on their initial clustering patterns in the combined COBALT analysis in Figure 1. Trees were generated in the same manner as described in Figure 2. This analysis included a previously identified high-voltage activated (HVA) calcium channel sequence, labeled as Pm-HVA-Calcium** (McClellan et al., 2008). Sodium channels are named based on work that initially described these proteins in lamprey (Zakon et al., 2017).
Because the sodium and calcium channels resolved as a coherent node in the combined COBALT analysis (Figure 1), we performed subsequent ME and NJ analyses with these channels as a combined group (Figure 5). The sequences Pm-Cav1b, Pm-Cav2a, and Pm- Cav2c were excluded from the combined COBALT analysis due to their short predicted lengths (Figure 1), but were restored for these subsequent analyses. The results of the COBALT analysis on only the Na+ and Ca2+ channels fairly neatly clustered these proteins into their respective subfamilies with four exceptions – some of which recapitulate the problems seen in the original combined COBALT analysis in Figure 1 (left): Pm-Cav2a clustered most closely with sodium channels, Pm-Cav2b fell in with the Cav1 subfamily, and Pm-Cav2c and Pm-Cav3b failed to associate closely with any of the known channel subtypes (Figure 5A). However, despite its short predicted length (25%), Pm-Cav1b appropriately resolved within the Cav1 subfamily (Figure 5A). It is with the calcium channels that the subsequent phylogenetic analyses help most to clarify these relationships. With ME and NJ analysis, unsurprisingly the shortest sequences (Pm-Cav3b, Pm-Cav1b, Pm-Cav2a, Pm-Cav2c) fail to be retained for tree generation (Figures 5B, 5C). The lamprey Cav1 and Cav2 channels cluster in their respective subfamilies, but not enough resolution is gained to assign them to a particular subtype within these subfamilies (Figure 5B, 5C). Finally, the sodium channels remain a clearly defined cluster, but lamprey channels do not closely associate with defined Na+ channel subtypes described in mouse and zebrafish (Figure 5B, 5C).
Ion Channel Distribution in SC and Rhombencephalic Reticular Nuclei
With 47 ion channel sequences identified, we further validated the identification of the sequences using RT-PCR with two primer sets per ion channel that generated varying lengths of amplicons. In doing so, we generated a first-pass of CNS region-specific expression of these channels in P. marinus, namely the spinal cord (SC) as well as the anterior (ARRN), middle (MRRN), and posterior (PRRN) rhombencephalic reticular nuclei (Figure 6A.). A representative set of gels resulting from this PCR screening protocol is shown in Figure 6B. The results of this RT-PCR screen are summarized in Table 4.
Table 4.
Ion channel RNA distribution in CNS of larval lamprey as determined by RT-PCR assays from spinal cord, anterior (ARRN), middle (MRRN), and posterior (PRRN) rhombencephalic reticular nuclei.
| Lamprey Gene | Spinal Cord | ARRN | MRRN | PRRN |
|---|---|---|---|---|
| Kv1a | + | + | + | + |
| Kv1b | + | − | + | + |
| Kv1c | + | + | + | − |
| Kv1d | + | + | + | + |
| Kv1e | − | − | − | − |
| Kv1f | + | + | + | + |
| Kv2a | + | + | + | + |
| Kv3a | + | + | + | + |
| Kv3b | + | + | + | + |
| Kv5a | + | + | + | + |
| Kv6a | − | + | + | + |
| Kv7a | − | − | − | − |
| Kv7b | + | + | − | + |
| Kv7c | + | + | − | − |
| Kv8a | − | − | − | − |
| Kv8b | + | + | + | + |
| Kv9a | + | + | + | + |
| Kv10a | − | + | + | + |
| Kv10b | − | − | − | − |
| Kv11a | − | + | + | + |
| Kv12a | − | + | + | + |
| HCNa | + | + | + | + |
| KCNKa | + | + | + | + |
| KCNKb | − | − | + | + |
| KCNKc | − | + | − | + |
| KCNKd | + | − | + | + |
| KCNKe | − | − | − | − |
| KCNKf | + | + | + | + |
| Nav1α | + | + | + | + |
| Nav1γ | − | − | − | + |
| Nav1δ | + | + | + | + |
| Nav1ε | + | + | + | + |
| Nav2 | − | − | + | + |
| Nav1β | − | + | + | + |
| Cav1a | − | − | + | + |
| Cav1b | + | + | + | + |
| Cav1c | − | + | + | + |
| Cav1d | − | + | + | + |
| Cav2a | + | + | + | + |
| Cav2b | + | + | + | + |
| Cav2c | + | + | + | + |
| Cav3a | + | + | + | + |
| Cav3b | − | − | − | − |
| Kca1a | + | + | + | + |
| Kca2a | + | + | + | + |
| Slo2a | + | + | + | + |
| Slo2b | − | − | + | + |
CNS Expression of Voltage-gated K+ Channels
For the 21 voltage-gated K+ channels examined in this study, only four sequences from this family did not yield positive bands across the spinal cord and rhombencephalic reticular nuclei, namely Kv1e, Kv7a, Kv8a, and Kv10b (Table 4). Since these sequences were derived from the genome, these ion channels could simply be expressed in other tissue types, including non-reticular areas of the brain, and not in the ones examined here. Ion channel transcripts that were found in all four tissue types include Kv1a, Kv1d, Kv1f, Kv2a, Kv3a, Kv3b, Kv5a, Kv8b, and Kv9a. Of note is the entirety of the Subfamily H (EAG-related Kv10, 11, and 12) was not found in the P. marinus spinal cord. There were no voltage-gated K+ channel transcripts that were found only in the SC and not in brain tissue containing rhombencephalic reticular nuclei, and this trend held true for all other ion channel types as well. Transcripts that were present only in the rhombencephalic reticular nuclei tissue and not in the SC included Kv6a, Kv10a, Kv11a, and Kv12a. Comparing the three brain regions containing reticular nuclei, we found the ARRN lacked Kv1b, the MRRN lacked Kv7b, and Kv7c, and the PRRN lacked Kv1c and Kv7c. This left Kv7c unique to only the ARRN of the three nuclei.
CNS Expression of Non-voltage-gated K+ Channels
For the 11 non-voltage-gated K+ channels examined in this study, only KCNK5a did not yield positive bands across the spinal cord and rhombencephalic reticular nuclei. Ion channel transcripts that were found in all four tissue types included HCNa, KCNKa, KCNKf, Kca1a, Kca2a, and Slo2a (Table 4). All non-voltage-gated K+ channels found in the SC tissues were also found in brain regions containing the rhombencephalic reticular nuclei. Transcripts that were present only in the rhombencephalic reticular nuclei and not in the SC included KCNKb, KCNKc, and Slo2b. Comparing the brain tissue containing these reticular nuclei, we found the ARRN lacked KCNKb, KCNKd, and Slo2b, the MRRN lacked KCNKc, and the PRRN contained all sequences. The greatest differential expression between tissue types was therefore found in the KCNK family.
CNS Expression of Voltage-gated Ca2+ Channels
For the nine voltage-gated Ca2+ channels investigated in this study, only Cav3b did not produce a positive result in the tissues examined here. Ion channel transcripts that produced positive results for all four tissue types included Cav1b, the entirety of the Cav2 subfamily, and Cav3a (Table 4). None of these sequences were unique to the SC. Transcripts that were present only in the rhombencephalic reticular nuclei and not in the SC included Cav1a, Cav1c, and Cav1d. Comparing the three brain regions containing reticular nuclei, we found the ARRN lacked Cav1a, while both the MRRN and PRRN contained all eight of the voltage-gated Ca2+ sequences that produced positive results. Calcium channels, therefore, were the least differentially expressed, in terms of subtypes present, across the three rhombencephalic reticular nuclei.
CNS Expression of Voltage-gated Na+ Channels
For the six voltage-gated Na+ channels investigated in this study, all sequences yielded positive bands in at least one tissue type examined. Ion channel transcripts that were found in all four tissue types included Nav1α, Nav1δ, and Nav1ε (Table 4). All voltage-gated Na+ channels found in the SC tissues were also found in the rhombencephalic reticular nuclei. Transcripts that were present only in the rhombencephalic reticular nuclei and not in the SC included Nav1γ, Nav2, and especially Nav1β, which was found in all three nuclei, but not SC. Comparing the brain regions containing reticular nuclei, we found the ARRN and MRRN both lacked Nav1γ and Nav2, and PRRN contained all six voltage-gated Na+ sequences. This left both Nav1γ and Nav2 specific to only PRRN from the tissues we considered.
DISCUSSION
The various unique electrical properties exhibited by neurons are generated primarily by selective ionic charges passing through the membrane via various combinations of ion channels gated conditionally, such as by voltage changes and ligand interactions. In the sea lamprey Petromyzon marinus, the RS neurons in the ARRN, MRRN, and PRRN are both necessary (Paggett et al., 2004) and sufficient (Jackson et al., 2007) for the initiation of forward locomotion. In addition, RS neurons activate and modulate spinal motor networks involved in other general motor behaviors, such as turning maneuvers, backward locomotion, burrowing, writhing, and others. Neurons within the spinal motor networks generate the pattern of electrical activity that activates body musculature and produces behavioral responses. Following SCI, the injured axons of RS neurons regenerate through the injury site and reconnect with neurons in spinal motor networks to restore behavioral functions, including locomotion, in about eight weeks (McClellan, 2013).
In this study, we focused on voltage- and non-voltage-gated K+, voltage-gated Na+, and voltage-gated Ca2+ channels. Ion channels selective for potassium are the most diverse and largest subclass of ion channels, and the Kv family is the largest subfamily (Goldstein, 2005). Briefly, the various functions of these K+ channels include delayed rectification, fast-inactivation, silencing, and modification of action potential shape (Gutman, 2003); see (Batueva et al., 1996) and (Hess and El Manira, 2001) for similar functions of lamprey K+ channels. The alpha subunits of the voltage-gated K+ channels are the pore forming proteins that associate into homo- (most often) or heterotetramers, both within and across members of the same subfamily to give unique properties (Goldstein, 2005). The HCN channels, which have not been described neurophysiologically in lamprey neurons but are represented in the lamprey genome (Table 1), are permeable to both Na+ and K+, but are 3–5 times more permeable to K+ than Na+ (Benarroch, 2013). The K2P channels have been implicated in regulating cell volume, secretion of hormones, synaptic transmission, resting membrane potential, and contraction of muscles, including cardiac muscle (Ryoo and Park, 2016). In lamprey spinal neurons, leak currents can be modulated by neurotransmitters (Kettunen et al., 2003) and might be mediated by one or more of the K2P channels described in the present study. The Ca2+ activated K+ channels have been found to have roles in neurosecretion, shaping action potentials, maintaining smooth muscle tone, and spike frequency adaptation (Sah, 1996). For example, lamprey SK channels have been shown to produce the slow afterhyperpolarization (AHP) (Hill et al., 1992; McClellan et al., 2008) and contribute to burst termination (El Manira et al., 1994; Hill et al., 1992). Na+ activated K+ channels have been found to have diverse roles that are cell type specific, such as regulating resting membrane potential in quail dorsal root ganglion neurons (Haimann et al., 1992) or contributing to the Na+-dependent AHP in ferret perigeniculate neurons (Kim and McCormick, 1998) and lamprey neurons (Wallén et al., 2007).
Voltage-gated Ca2+ channels are the primary route through which calcium enters cells (Hofmann et al., 1994). Voltage-gated Ca2+ channels present in three major types: L-type (Cav1); P/Q-, N-, and R-type (Cav2); and T-type (Cav3) (Kameda et al., 2006). The L-type (Long lasting) Ca2+ channels are slowly inactivating, P/Q-, N-, and R-type Ca2+ channels are high-voltage activated (HVA), and T-type (Tiny) Ca2+ channels are low-voltage activated (LVA). Both LVA and HVA calcium channels have been found in lamprey neurons. For example, somatic and presynaptic calcium currents appear to be mediated mainly by N-type HVA calcium channels (El Manira and Bussières, 1997; Krieger et al., 1999), but T-type LVA channels also are present in the soma (Tegnér et al., 1997).
Voltage-gated Na+ channels are responsible for the initiation and propagation of action potentials. These channels contribute to action potential generation in lamprey neurons and are blocked by TTX (Batueva et al., 1996), but the contribution of specific Na+ channel subtypes is not known. Sodium channels have much less divergence in sequence similarity and function than potassium or calcium channels, and have thus been historically designated into members of one subfamily (Nav1) (Catterall, 2005).
Of the 47 ion channels described in this study, only 10 had been described previously (Hill et al., 2008; McClellan et al., 2008; Novak et al., 2006; Zakon et al., 2017), drawing into consideration the strengths and weaknesses in different methods for identifying unknown sequences. Most of these previous sequences were identified using a degenerate primer approach, relying on conservation in sequence similarity to PCR amplify and Sanger sequence putative ion channels. While this approach was certainly successful in capturing certain members of the ion channels described here, the full diversity of gene family members is best captured using genomic analyses, as exemplified by the independent identification of six P. marinus Na+ channels using genomic approaches (Zakon et al., 2017), where degenerate primer approach predicted only two.
Although the present study has revealed a wide diversity of ion channels in lamprey central nervous system tissue, the study does have limitations. We were able to identify sequence based on BLAST and other orthology tools, but the predicted length of these coding sequences varies over a very wide range (14%−100%), meaning there is a large amount of sequence remaining to be appropriately identified and curated. This is a requirement for more meaningful phylogenetic analysis to go forward to make inferences about ion channel relationships and evolution that include the lamprey in the mix. For this reason, we have not used the sequences in this study to undertake this interesting analysis, but rather present the COBALT and phylogenetic trees as tools to aid in the confidence of putative channel identity rather than true phylogeny. Second, the coding sequences obtained from the genome are generated from a predictive algorithm using the MAKER pipeline (Cantarel et al., 2008) and not from the direct sequencing of, for instance, a neural transcriptome. We have confidence in these sequences, as the six previously described ion channels that were verified through degenerate primers and sanger sequencing aligned with high (>97%) identity to the predicted coding sequences. Third, in addition to containing RS neurons, the three brain regions examined in this study also will include some possible non-RS neurons, axons, synapses, glial cells, blood vessels, and connective tissue.. Finally, even with designing two PCR assays with different primer sets and amplicon sizes, it is still possible that a negative result for a transcript across all tissue types could be the result of improperly predicted coding sequence or sub-optimal primer efficiency.
The present validation of these ion channel sequences and generation of gene-specific primers will allow for future investigations to take advantage of these molecular resources generated in this study, particularly going beyond qualitative analyses into quantitative RT-PCR, as well as narrowing targets from whole tissue down to single cells. Combining studies that incorporate electrophysiological and ion channel mRNA expression data has proved fruitful in the past in this system (McClellan et al., 2008), and now the sequence availability has been improved, this will allow for broader investigations to take place, such as siRNA knockdown or mRNA overexpression of ion channels to better understand their specific function in networks throughout the nervous system.
Acknowledgements
We would like to thank Carrie L. Davis-Hansson and Merna Jajou for assisting with the optimization of PCR assays. This work was supported by NIH grant NIGMS 5T32GM008396 (support for AJN), NSF-REU SITE DBI-1359283 (support for ANF).
Footnotes
Publisher's Disclaimer: This is a PDF file of an unedited manuscript that has been accepted for publication. As a service to our customers we are providing this early version of the manuscript. The manuscript will undergo copyediting, typesetting, and review of the resulting proof before it is published in its final citable form. Please note that during the production process errors may be discovered which could affect the content, and all legal disclaimers that apply to the journal pertain.
Conflict of Interest Statement
The authors declare that they have no competing interests.
REFERENCES
- Alford ST, Alpert MH, 2014. A synaptic mechanism for network synchrony. Front. Cell. Neurosci 8, 290. doi: 10.3389/fncel.2014.00290 [DOI] [PMC free article] [PubMed] [Google Scholar]
- Batueva IV, Tsvetkov EA, Buchanan JT, Veselkin NP, 1996. Investigation of voltage- gated currents in the isolated neurons of river lamprey Lampetra fluviatilis spinal cord. J Evol 217–231. [PubMed] [Google Scholar]
- Benarroch EE, 2013. HCN channels: Function and clinical implications. Neurology 80, 304–310. doi: 10.1212/WNL.0b013e31827dec42 [DOI] [PubMed] [Google Scholar]
- Cantarel BL, Korf I, Robb SMC, Parra G, Ross E, Moore B, Holt C, Alvarado AS, Yandell M, 2008. MAKER: An easy-to-use annotation pipeline designed for emerging model organism genomes. Genome Res 18, 188–196. doi: 10.1101/gr.6743907 [DOI] [PMC free article] [PubMed] [Google Scholar]
- Catterall WA, 2005. International Union of Pharmacology. XLVII. Nomenclature and Structure- Function Relationships of Voltage-Gated Sodium Channels. Pharmacol. Rev 57, 397–409. doi: 10.1124/pr.57.4.4 [DOI] [PubMed] [Google Scholar]
- Catterall WA, 2003a. International Union of Pharmacology. XXXIX. Compendium of Voltage- Gated Ion Channels: Sodium Channels. Pharmacol. Rev 55, 575–578. doi: 10.1124/pr.55.4.7 [DOI] [PubMed] [Google Scholar]
- Catterall WA, 2003b. International Union of Pharmacology. XL. Compendium of Voltage- Gated Ion Channels: Calcium Channels. Pharmacol. Rev 55, 579–581. doi: 10.1124/pr.55.4.8 [DOI] [PubMed] [Google Scholar]
- Cinelli E, Robertson B, Mutolo D, Grillner S, Pantaleo T, Bongianni F, 2013. Neuronal Mechanisms of Respiratory Pattern Generation Are Evolutionary Conserved. J. Neurosci 33, 9104–9112. doi: 10.1523/JNEUROSCI.0299-13.2013 [DOI] [PMC free article] [PubMed] [Google Scholar]
- Conesa A, Götz S, García-Gómez JM, Terol J, Talón M, Robles M, 2005. Blast2GO: a universal tool for annotation, visualization and analysis in functional genomics research. Bioinformatics 21, 3674–6. doi: 10.1093/bioinformatics/bti610 [DOI] [PubMed] [Google Scholar]
- Desper R, Gascuel O, 2003. Theoretical Foundation of the Balanced Minimum Evolution Method of Phylogenetic Inference and Its Relationship to Weighted Least-Squares Tree Fitting. Mol. Biol. Evol 21, 587–598. doi: 10.1093/molbev/msh049 [DOI] [PubMed] [Google Scholar]
- Ebbesson SOE, Northcutt GR, 1976. Neurology of anamniotic vertebrates, in: Neurology of Anamniotic Vertebrates Lawrence Erlbaum Associates, Hillsdale, NJ, pp. 115–146. [Google Scholar]
- El Manira A, Bussières N, 1997. Calcium channel subtypes in lamprey sensory and motor neurons. J. Neurophysiol 78, 1334–1340. doi: 10.1152/jn.1997.78.3.1334 [DOI] [PubMed] [Google Scholar]
- El Manira A, Tegnér J, Grillner S, 1994. Calcium-dependent potassium channels play a critical role for burst termination in the locomotor network in lamprey. J. Neurophysiol 72, 1852–61. doi: 10.1152/jn.1994.72.4.1852 [DOI] [PubMed] [Google Scholar]
- Goldstein SAN, 2005. International Union of Pharmacology. LV. Nomenclature and Molecular Relationships of Two-P Potassium Channels. Pharmacol. Rev 57, 527–540. doi: 10.1124/pr.57.4.12 [DOI] [PubMed] [Google Scholar]
- Grillner S, 2003. The motor infrastructure: From ion channels to neuronal networks. Nat. Rev. Neurosci 4, 573–586. doi: 10.1038/nrn1137 [DOI] [PubMed] [Google Scholar]
- Grillner S, Ekeberg Ö, El Manira A, Lansner A, Parker D, Tegnér J, Wallén P, 1998. Intrinsic function of a neuronal network - A vertebrate central pattern generator. Brain Res. Rev 26, 184–197. doi: 10.1016/S0165-0173(98)00002-2 [DOI] [PubMed] [Google Scholar]
- Grishin NV, 1995. Estimation of the number of amino acid substitutions per site when the substitution rate varies among sites. J. Mol. Evol 41, 675–9. [DOI] [PubMed] [Google Scholar]
- Gutman GA, 2003. International Union of Pharmacology. XLI. Compendium of Voltage-Gated Ion Channels: Potassium Channels. Pharmacol. Rev 55, 583–586. doi: 10.1124/pr.55.4.9 [DOI] [PubMed] [Google Scholar]
- Haimann C, Magistretti J, Pozzi B, 1992. Sodium-activated potassium current in sensory neurons: a comparison of cell-attached and cell-free single-channel activities. Pflügers Arch. Eur. J. Physiol 422, 287–294. doi: 10.1007/BF00376215 [DOI] [PubMed] [Google Scholar]
- Hess D, El Manira a, 2001. Characterization of a high-voltage-activated IA current with a role in spike timing and locomotor pattern generation. Proc. Natl. Acad. Sci. U. S. A 98, 5276–5281. doi: 10.1073/pnas.091096198 [DOI] [PMC free article] [PubMed] [Google Scholar]
- Hill AS, Nishino A, Nakajo K, Zhang G, Fineman JR, Selzer ME, Okamura Y, Cooper EC, 2008. Ion channel clustering at the axon initial segment and node of Ranvier evolved sequentially in early chordates. PLoS Genet 4, e1000317. doi: 10.1371/journal.pgen.1000317 [DOI] [PMC free article] [PubMed] [Google Scholar]
- Hill R, Matsushima T, Schotland J, Grillner S, 1992. Apamin blocks the slow AHP in lamprey and delays termination of locomotor bursts. Neuroreport 3, 943–5. [DOI] [PubMed] [Google Scholar]
- Hofmann F, Biel M, Flockerzi V, 1994. Molecular basis for Ca2+ channel diversity. Annu. Rev. Neurosci 17, 399–418. doi: 10.1146/annurev.neuro.17.1.399 [DOI] [PubMed] [Google Scholar]
- Homma S, 1983. Physiology and pharmacology of putative transmitters in lamprey central nervous system. Prog. Neurobiol 20, 287–311. doi: 10.1016/0301-0082(83)90006-0 [DOI] [PubMed] [Google Scholar]
- Jackson AW, Pino FA, Wiebe ED, McClellan AD, 2007. Movements and muscle activity initiated by brain locomotor areas in semi-intact preparations from larval lamprey. J. Neurophysiol 97, 3229–41. doi: 10.1152/jn.00967.2006 [DOI] [PubMed] [Google Scholar]
- Kameda K, Fukao M, Kobayashi T, Tsutsuura M, Nagashima M, Yamada Y, Yamashita T, Tohse N, 2006. CSN5/Jab1 inhibits cardiac L-type Ca2+channel activity through protein-protein interactions. J. Mol. Cell. Cardiol 40, 562–569. doi: 10.1016/j.yjmcc.2006.01.007 [DOI] [PubMed] [Google Scholar]
- Kettunen P, Hess D, El Manira A, 2003. mGluR1, but not mGluR5, mediates depolarization of spinal cord neurons by blocking a leak current. J. Neurophysiol 90, 2341–8. doi: 10.1152/jn.01132.2002 [DOI] [PubMed] [Google Scholar]
- Kim U, McCormick D. a, 1998. Functional and ionic properties of a slow afterhyperpolarization in ferret perigeniculate neurons in vitro. J Neurophysiol 80, 1222–1235. [DOI] [PubMed] [Google Scholar]
- Krieger P, Buschges A, el Manira A, 1999. Calcium channels involved in synaptic transmission from reticulospinal axons in lamprey. J Neurophysiol 81, 1699–1705. doi: 10.1152/jn.1999.81.4.1699 [DOI] [PubMed] [Google Scholar]
- McClellan AD, 2013. Spinal cord injury: The lamprey model, in: Neuromethods Humana Press, Totowa, NJ, pp. 63–108. doi: 10.1007/978-1-62703-197-4-4 [DOI] [Google Scholar]
- McClellan AD, Kovalenko MO, Benes JA, Schulz DJ, 2008. Spinal cord injury induces changes in electrophysiological properties and ion channel expression of reticulospinal neurons in larval lamprey. J. Neurosci 28, 650–659. doi: 10.1523/JNEUROSCI.3840-07.2008 [DOI] [PMC free article] [PubMed] [Google Scholar]
- Moret BME, Roshan U, Warnow T, 2002. Sequence-Length Requirements for Phylogenetic Methods Springer, Berlin, Heidelberg, pp. 343–356. doi: 10.1007/3-540-45784-4_26 [DOI] [Google Scholar]
- Nikitina N, Bronner-Fraser M, Sauka-Spengler T, 2009. The sea lamprey Petromyzon marinus: A model for evolutionary and developmental biology. Cold Spring Harb. Protoc 4, pdb.emo113-pdb.emo113. doi: 10.1101/pdb.emo113 [DOI] [PubMed] [Google Scholar]
- Novak AE, Jost MC, Lu Y, Taylor AD, Zakon HH, Ribera AB, 2006. Gene duplications and evolution of vertebrate voltage-gated sodium channels. J. Mol. Evol 63, 208–221. doi: 10.1007/s00239-005-0287-9 [DOI] [PubMed] [Google Scholar]
- Paggett KC, Jackson AW, Mcclellan AD, 2004. Organization of higher-order brain areas that initiate locomotor activity in larval lamprey. Neuroscience 125, 25–33. doi: 10.1016/j.neuroscience.2004.01.032 [DOI] [PMC free article] [PubMed] [Google Scholar]
- Papadopoulos JS, Agarwala R, 2007. COBALT: constraint-based alignment tool for multiple protein sequences. Bioinformatics 23, 1073–1079. doi: 10.1093/bioinformatics/btm076 [DOI] [PubMed] [Google Scholar]
- Ryoo K, Park J-Y, 2016. Two-pore Domain Potassium Channels in Astrocytes. Exp. Neurobiol 25, 222–232. doi: 10.5607/en.2016.25.5.222 [DOI] [PMC free article] [PubMed] [Google Scholar]
- Sah P, 1996. Ca2+-activated K+currents in neurones: Types, physiological roles and modulation. Trends Neurosci 19, 150–154. doi: 10.1016/S0166-2236(96)80026-9 [DOI] [PubMed] [Google Scholar]
- Saitou N, Nei M, 1987. The neighbor-joining method: a new method for reconstructing phylogenetic trees. Mol. Biol. Evol 4, 406–25. doi: 10.1093/oxfordjournals.molbev.a040454 [DOI] [PubMed] [Google Scholar]
- Schindelin J, Arganda-Carreras I, Frise E, Kaynig V, Longair M, Pietzsch T, Preibisch S, Rueden C, Saalfeld S, Schmid B, Tinevez JY, White DJ, Hartenstein V, Eliceiri K, Tomancak P, Cardona A, 2012. Fiji: An open-source platform for biological-image analysis. Nat. Methods 9, 676–682. doi: 10.1038/nmeth.2019 [DOI] [PMC free article] [PubMed] [Google Scholar]
- Shaw AC, Jackson AW, Holmes T, Thurman S, Davis GR, McClellan AD, 2010. Descending brain neurons in larval lamprey: Spinal projection patterns and initiation of locomotion. Exp. Neurol 224, 527–541. doi: 10.1016/j.expneurol.2010.05.016 [DOI] [PMC free article] [PubMed] [Google Scholar]
- Smith JJ, Kuraku S, Holt C, Sauka-Spengler T, Jiang N, Campbell MS, Yandell MD, Manousaki T, Meyer A, Bloom OE, Morgan JR, Buxbaum JD, Sachidanandam R, Sims C, Garruss AS, Cook M, Krumlauf R, Wiedemann LM, Sower SA, Decatur WA, Hall JA, Amemiya CT, Saha NR, Buckley KM, Rast JP, Das S, Hirano M, McCurley N, Guo P, Rohner N, Tabin CJ, Piccinelli P, Elgar G, Ruffier M, Aken BL, Searle SMJ, Muffato M, Pignatelli M, Herrero J, Jones M, Brown CT, Chung- Davidson YW, Nanlohy KG, Libants SV, Yeh CY, McCauley DW, Langeland JA, Pancer Z, Fritzsch B, De Jong PJ, Zhu B, Fulton LL, Theising B, Flicek P, Bronner ME, Warren WC, Clifton SW, Wilson RK, Li W, 2013. Sequencing of the sea lamprey (Petromyzon marinus) genome provides insights into vertebrate evolution. Nat. Genet 45, 415–421. doi: 10.1038/ng.2568 [DOI] [PMC free article] [PubMed] [Google Scholar]
- Smith JJ, Timoshevskaya N, Ye C, Holt C, Keinath MC, Parker HJ, Cook ME, Hess JE, Narum SR, Lamanna F, Kaessmann H, Timoshevskiy VA, Waterbury CKM, Saraceno C, Wiedemann LM, Robb SMC, Baker C, Eichler EE, Hockman D, Sauka-Spengler T, Yandell M, Krumlauf R, Elgar G, Amemiya CT, 2018. The sea lamprey germline genome provides insights into programmed genome rearrangement and vertebrate evolution. Nat. Genet 50, 270–277. doi: 10.1038/s41588-017-0036-1 [DOI] [PMC free article] [PubMed] [Google Scholar]
- Tegnér J, Hellgren-Kotaleski J, Lansner A, Grillner S, 1997. Low-voltage-activated calcium channels in the lamprey locomotor network: simulation and experiment. J. Neurophysiol 77, 1795–1812. doi: 10.1152/jn.1997.77.4.1795 [DOI] [PubMed] [Google Scholar]
- Wallén P, Robertson B, Cangiano L, Löw P, Bhattacharjee A, Kaczmarek LK, Grillner S, 2007. Sodium-dependent potassium channels of a Slack-like subtype contribute to the slow afterhyperpolarization in lamprey spinal neurons. J. Physiol 585, 75–90. doi: 10.1113/jphysiol.2007.138156 [DOI] [PMC free article] [PubMed] [Google Scholar]
- Watanabe A, Hirano S, Murakami Y, 2008. Development of the lamprey central nervous system, with reference to vertebrate evolution. Zoolog. Sci 25, 1020–1027. doi: 10.2108/zsj.25.1020 [DOI] [PubMed] [Google Scholar]
- Zakon HH, Li W, Pillai NE, Tohari S, Shingate P, Ren J, Venkatesh B, 2017. Voltage- gated sodium channel gene repertoire of lampreys: gene duplications, tissue-specific expression and discovery of a long-lost gene. Proc. R. Soc. B Biol. Sci 284, 20170824. doi: 10.1098/rspb.2017.0824 [DOI] [PMC free article] [PubMed] [Google Scholar]