

Abstract
Understanding complex biological systems requires the system-wide characterization of both molecular and cellular features. Existing methods for spatial mapping of biomolecules in intact tissues suffer from information loss caused by degradation and tissue damage. We report a tissue transformation strategy named ‘Stabilization under Harsh conditions via Intramolecular Epoxide Linkages to prevent Degradation’ (SHIELD), which uses a flexible polyepoxide to form controlled intra- and intermolecular crosslink with biomolecules. SHIELD preserved protein fluorescence and antigenicity, transcripts and tissue architecture under a wide range of harsh conditions. We applied SHIELD to interrogate system-level wiring, synaptic architecture, and molecular features of virally labeled neurons and their targets in mouse at single-cell resolution. We also demonstrated rapid three dimensional (3D) phenotyping of core needle biopsies and human brain cells. SHIELD enables rapid, multiscale, integrated molecular phenotyping of both animal and clinical tissues.
Comprehensive understanding of biological systems requires the integration of molecular and structural information across multiple scales1–6. Existing approaches can profile multiple biomolecules but only within a few layers of cells7–9. Intact tissue-processing techniques10–17 enable organ-scale phenotyping, but can lead to information loss due to tissue damage and biomolecule degradation during tissue processing, which may include digestion with proteases, delipidation, and exposure to high temperatures or dehydrating conditions. Such non-physiological treatments can quench fluorescent proteins (FPs)13,18, degrade proteins19, hydrolyze transcripts20, and damage tissue architecture.
Various approaches have been proposed to preserve biomolecules against stressors. For example, changing biomolecule−solvent interactions by tuning solvent polarity or incorporating additives can preserve biomolecules in extreme conditions, but this requires high concentrations of additives that may interfere with tissue processing and probe–target interactions21. Covalent modification with chemical fixatives or encapsulation in hydrogels can secure biomolecules22–24, but this is often accompanied by loss of biomolecule function and probe-binding affinity owing to structural and chemical damage25,26. Preserving protein fluorescence is particularly challenging because small alterations in tertiary structure can quench signal27. So far, no single method simultaneously preserves the full fluorescence of proteins, the reactivity of proteins with specific probes, integrity of transcripts, and tissue architecture across organs.
Here we introduce SHIELD (Stabilization to Harsh conditions via Intramolecular Epoxide Linkages to prevent Degradation), a versatile method that simultaneously preserves key molecular information—protein fluorescence, protein immunoreactivity, and nucleic acids —in cleared intact tissues by using a polyfunctional flexible epoxide. We attribute the crosslinker’s protective mechanism to the formation of multiple flexible intramolecular bonds that enhance the stability of the protein’s tertiary structure. When applied to tissue, SHIELD combined with SWITCH14 enables uniform, organ-wide preservation of FP activity, proteins, transcripts, and their probe-binding properties without loss of tissue architecture. SHIELD synergizes with a number of existing tissue processing technologies. For example, SHIELD combined with stochastic electrotransport (SE)28 enables ultrafast 3D processing of whole needle biopsies and integrated phenotyping of parvalbumin (PV)-positive neurons in the globus pallidus externa (GPe) and their downstream targets.
RESULTS
Polyepoxide protects GFP fluorescence from stressors
We hypothesized that crosslinking surface exposed protein residues with multiple flexible intramolecular bonds provides structural reinforcement to enhance the stability of proteins. We screened polyepoxides owning to their (1) ability to form spontaneous crosslinks with biomolecules under physiological conditions, (2) backbone conformational flexibility, and (3) molecular diversity (Fig. 1a; Supplementary table 1). Purified green fluorescent protein (GFP) was used as a model protein because loss of GFP fluorescence correlates directly with structural perturbations and loss of protein fluorescence affects many phenotyping technologies29 (Fig. 1b).
Figure 1. Protection of green fluorescent protein (GFP) activity with polyepoxide crosslinkers.
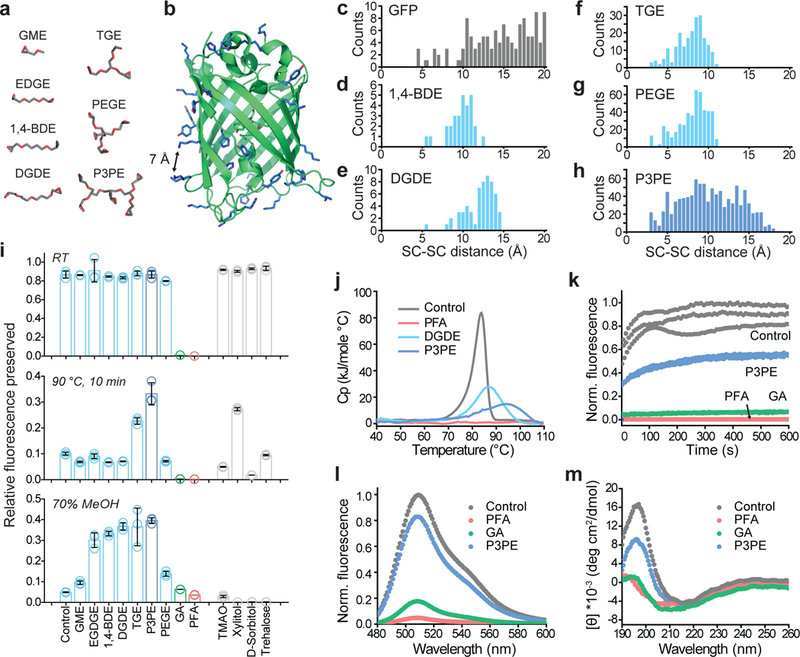
(a) Representative lowest-energy conformers of epoxide molecules, drawn at the same scale as b. (b) GFP structure, with epoxide-reactive residues labeled in blue. The black arrow indicates a 7-Å distance between side-chains. (c) Frequency count calculated for solvent-exposed GFP side-chains (SC) as a function of their pairwise distances. (d-h) Frequency count of the average distance between epoxide groups, determined from the lowest-energy epoxide conformers. (i) Degree of GFP fluorescence preserved after reaction with the crosslinker (top) followed by exposure to 90°C for 10 min (middle) or 70% methanol incubation for 1 hr (bottom). N=3 independent experiments. Mean +/− standard error mean was used for plotting this graph. (j) Differential scanning calorimetry plot of heat capacity as a function of the temperature of crosslinked GFP. (k) Plot of the fluorescence of crosslinked GFP recovered over time after renaturation from acid-denaturation. (l) Fluorescence spectra of crosslinked GFP. (m) Circular dichroism spectra of crosslinked GFP. GME, glycidyl methyl ether; EGDGE, ethylene glycol diglycidyl ether; 1,4-BDE, 1,4-butanediol diglycidyl ether; DGDE, dipropylene glycol diglycidyl ether; TGE, glycerol triglycidyl ether; PEGE, pentaerythritol polyglycidyl ether; P3PE, polyglycerol 3-polyglycidyl ether. PFA, paraformaldehyde; GA, glutaraldehyde. TMAO, trimethylamine N-oxide.
We first performed molecular dynamics simulations of GFP to determine the side-chain to side-chain distance of solvent-exposed nucleophiles (Lys, His, Cys, and Tyr) and found that the crosslinkable pairs spanned distances with increasing frequency above 10 Å (Fig. 1c). Crosslinkers thus should ideally possess multiple reactive groups that bridge side-chain pairs to maximize the chance of forming intramolecular bonds. Among the lowest energy state conformers calculated for a library of epoxides (Fig. 1a; Supplementary table 1), we found that the polyepoxy compound, P3PE (polyglycerol-3-polyglycidyl ether), had the highest count and broadest distribution of epoxide functional groups complementing the pairwise side-chain distances of GFP (Fig. 1d-h).
We next reacted GFP with P3PE and other epoxide crosslinkers to investigate their protective properties. Mass spectrometry measured fewer than 14 P3PE molecules attached per GFP, compared to the 20 available reactive groups that reacted with monomeric GME (glycidyl methyl ether), which is indicative of multipoint intraprotein crosslinking (Supplementary Fig. 1). When we measured GFP fluorescence after exposure to denaturing conditions at 90°C for 10 min or 70% methanol for 1 hr, we found that fluorescence was best retained in both conditions by polyepoxy with three or more functional groups, with P3PE exhibiting among the best performance overall (Fig. 1i). At all conditions tested, P3PE outperformed commonly used protein stabilizers (e.g., xylitol)30 (Fig. 1i).
To understand the protective mechanism of P3PE intramolecular crosslinking, we characterized the physicochemical properties of the P3PE-GFP conjugate using differential scanning calorimetry (DSC), circular dichroism (CD), and fluorescence spectroscopy. DSC showed that GFP crosslinked with dipropylene glycol diglycidyl ether (DGDE) or P3PE exhibited observable transitional enthalpy and an increased melting temperature (from 84°C to 87°C and 95°C, respectively), whereas extensive aldehyde fixation (12 hr at 37°C) eliminated GFP’s ability to undergo thermal denaturation31 (Fig. 1j). The presence of denaturation enthalpy indicates that the flexible polyglycerol backbone of the polyepoxy accommodates thermal fluctuations. This flexibility was further evident in acid denaturation-renaturation experiments32, where P3PE partially preserved GFP’s ability to refold but not when GFP was reacted with glutaraldehyde (GA) and paraformaldehyde (PFA) (Fig. 1k). The rigid nature of GA and PFA fixation compromises GFP structure, as seen from the disruption of the beta sheet CD spectra in favor of random coils33, which reduces fluorescence intensity (Fig. 1l, m). In contrast, the P3PE-GFP conjugate retained both its native protein conformation and fluorescent signal (Fig. 1l, m).
SHIELD protects FP without tissue autofluorescence increase
Consistent with our findings with purified GFP, tissue epoxidation can preserve FP activity in tissue under harsh treatments. After heat exposure at 70°C for 24 hr, tissue reacted with P3PE preserved GFP signal in Thy1::EGFP M-line brain slices but not in PFA control or GA tissues (Fig. 2a). Of the polyepoxides tested, P3PE preserved signal best, and this protective effect extended to other FPs (Fig. 2b-d). Moreover, P3PE-treated tissue preserved GFP signal 50–400% more effectively than PFA-fixed tissue following exposure to detergents or organic solvents used in other tissue clearing methods (Fig. 2e). We termed the combination of tissue epoxidation with polyepoxide and subsequent delipidation as SHIELD. We anticipate that SHIELD’s ability to maximally preserve FP signal can complement existing tissue-phenotyping methods requiring dehydration with alcohols, delipidation with organic solvents or detergents, or hydration with urea18,34.
Figure 2. SHIELD preserves FP signals, proteins, transcripts, and their probe-binding affinities.
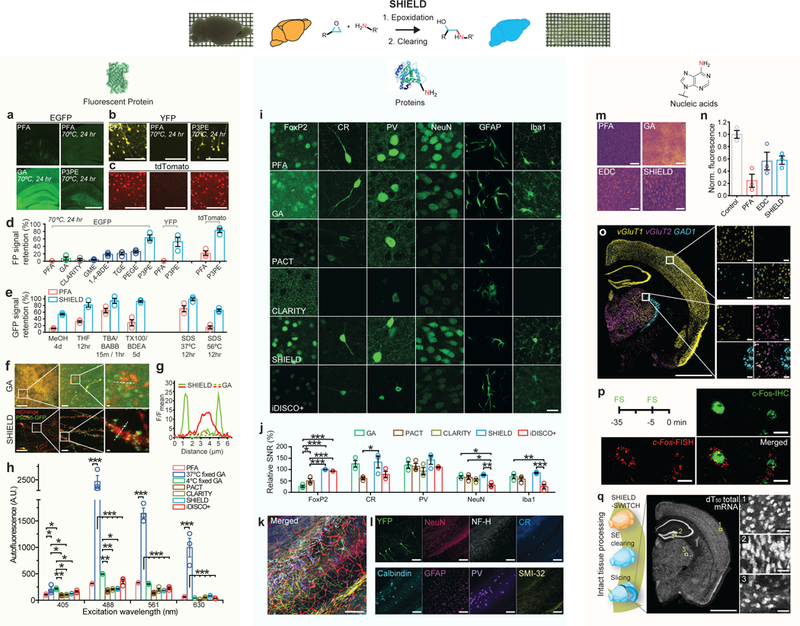
(a-c) Representative FP signals of brain slices subjected to thermal treatment after processed with fixatives (PFA, GA, or P3PE). Brain slices expressing EGFP (Thy1::EGFP M-line), YFP (Thy1::YFP H-line), or tdTomato (PV-Cre / loxP-tdTomato) were used. Scale bar = 1 mm (a), 100 μm (b,c) (d) FP signal retention after the same heat treatment in brain sections preserved with difference fixatives and CLARITY. N=3 tissues. (e) GFP signal retention from M-line slices after exposure to organic solvents and detergents. MeOH, methanol; THF, tetrahydrofuran; TBA, tert-butyl alcohol; BABB, one part benzyl alcohol and two parts benzyl benzoate; TX100, Triton-X100; BDEA, butyldiethanolamine. N=3 tissues. (f) Fluorescence images of neurons virally labeled with RV-hSyn-mOrange-p2A-PSD95-GFP in GA and SHIELD tissue. Scale bars = 100, 10, and 1 μm (left to right). (g) Fluorescence intensity profiles of PSD95-GFP (green) and mOrange (red) signals along the dotted lines in f. (h) Tissue autofluorescence from various excitation wavelengths. N=3 tissues. (i) Representative images comparing the immunofluorescence of key cell-type antibodies in tissues prepared by various tissue processing methods. Scale bar = 20 μm. FoxP2, forkhead box protein P2; CR, calretinin; PV, parvalbumin; NeuN, neuronal nuclei; GFAP, glial fibrillary acidic protein; Iba1, ionized calcium-binding adapter molecule 1. The same imaging and display settings were used for each antibody. (j) Signal to noise ratios (SNR) of immunofluorescence in i normalized to the SNR of PFA control. N=3 tissues. (k, l) SHIELD preserves endogenous YFP fluorescence during multiple rounds of immunostaining and destaining. (k) Overlay of multi-round immunostained images. Scale bar = 100 μm. (l) Images from individual rounds. Scale bar = 100 μm. (m) Representative heatmaps of fluorescence in situ hybridization (FISH) of total mRNAs by (dT)50-Cy3 in cleared PFA, EDC-CLARITY, GA, and SHIELD tissues. Scale bar = 100 μm. (n) Fluorescence intensities of dT50-Cy3 FISH normalized to the signal of uncleared PFA tissues (Control), N=3 tissues. (o) FISH HCR against three mRNAs in SHIELD tissue. Scale bar = 1 mm (left) or 50 μm (right panels). (p) Dual labeling of c-Fos protein and mRNA in SHIELD tissue from a mouse foot shocked (FS) twice at 35 and 5 minutes before sacrifice. Scale bar = 10 μm. (q) Uniform preservation of transcripts in a SHIELD-processed brain hemisphere cleared with stochastic electrotransport (SE). See Supplementary video 1. Scale bar = 2 mm (left) or 100 μm (right panels). Mean +/− standard error mean was used to plot all the bar graphs. One-way ANOVA, Turkey’s multiple comparison test, *P<0.05, **P<0.01, ***P<0.001.
SHIELD-tissue also exhibits inherently low tissue autofluorescence, in contrast to GA 35, which increases background autofluorescence and complicates imaging of structures with low signals (Fig. 2a,f)14,36. For example, imaging of neurons expressing mOrange in neurites and GFP in synaptic clusters suffered from a poor signal-to-noise ratio (SNR) in GA fixed tissue (Fig. 2f-g). By contrast, tissues epoxidated with P3PE under the same condition (37°C, 6hr) exhibited low background autofluorescence across a wide spectral range (Fig. 2h), and thus makes it possible to image both individual neurites and their associated synaptic clusters with excellent SNR (Fig. 2f-g).
SHIELD preserves organ-wide tissue physicochemical property
We next determined whether SHIELD preserves endogenous proteins and their immunoreactivity. Of the 53 antibodies tested, all antibodies that were compatible with PFA-fixed control tissue were found to be compatible with SHIELD (Supplementary Fig. 2; Supplementary table 2). Antibodies that poorly stained GA-tissue yielded better signal in SHIELD-tissue, suggesting that epitopes affected by GA fixation were not perturbed by SHIELD (Fig. 2i, j; Supplementary Fig. 2). SHIELD’s ability to crosslink tissue into a durable protein network allowed us to perform multiple rounds of immunostaining while retaining FP signal (Fig. 2k,l; Supplementary Fig. 2).
We further investigated whether SHIELD preserves transcripts in cleared organ-scale tissue. We confirmed the formation of covalent bonds between epoxides and nucleic acids using mass spectrometry (Supplementary Fig. 1)37. To quantify the degree of transcript retention, we performed fluorescence in situ hybridization (FISH) on the poly(A) tail of mature mRNA using a 50 nt deoxythymine (oligo(dT)50) labeled with Cy3 (Fig. 2m,n). The FISH signal in SHIELD-tissue was higher than that in cleared PFA-tissue and comparable to the signal obtained by 1-ethyl-3–3-dimethyl-aminopropyl carbodiimide (EDC) chemistry12,38 (Fig. 2m,n), while maintaining higher FP signal compared to EDC-CLARITY (Supplementary Fig. 3). We were able to detect various mRNAs including cell-type and neural activity markers in SHIELD tissues (Fig. 2o,p; Supplementary Fig. 3).
SHIELD transforms entire organs into mechanically robust and transparent substrates while uniformly preserving FP signals, protein antigenicity, transcripts, and tissue architecture (Fig. 2q; Fig. 3; Supplementary Fig. 4,5). We previously showed that a uniform and transparent tissue matrix can be obtained by controlling the kinetics of GA fixation using SWITCH (System Wide control of Interaction Time and kinetics of CHemicals)14. In this method, we homogeneously dispersed GA in tissue by suppressing reactivity at pH 3 prior to initiating sample-wide crosslinking by shifting to a neutral pH. However, the low pH of the GA SWITCH-off buffer can denature FPs and hydrolyze transcripts, and GA generates autofluorescent byproducts32,36 (Fig. 2f,g). In contrast, we found that the reactivity of the polyepoxide can be controlled at more physiological conditions, where reactivity with primary amines was suppressed at 4°C, pH 7.4, and increased by ten-fold at 37°C, pH 10 (Supplementary Fig. 5). This SWITCH-mediated SHIELD reaction enabled preservation of transcripts in an intact SE-cleared organ-scale tissue (Fig. 2q; Supplementary video 1).
Figure 3. SHIELD protects tissue architecture against physical and chemical stressors.
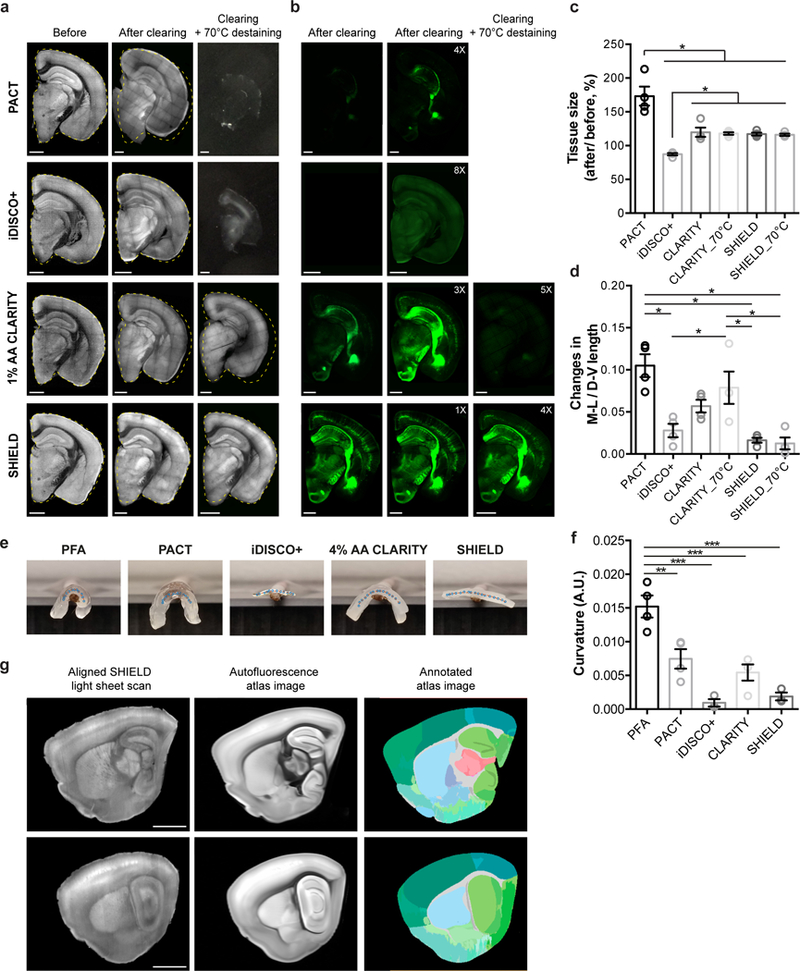
(a-b) Autofluorescence (a) and YFP (b) images of 1 mm-thick brain blocks before and after clearing, and after additional 70°C destaining step (2 hr in 300 mM SDS). The yellow dotted lines mark the original contour of the blocks before clearing. Numbers in YFP images indicate intensity gain by adjusting the display range of the images. Scale bars = 1 mm. (c) Tissue size change after delipidation and optical clearing. CLARITY_70°C indicates 1% AA CLARITY tissue destained at 70°C for 2 hr after 37°C delipidation. N=4 tissues. (d) Tissue deformation quantified by changes in the ratio of medio-lateral (M-V) and dorso-ventral (D-V) length of tissue block. N=4 tissues. (e) Photos of cleared 1 mm-thick mouse brain sagittal blocks on a rod. Interpolated centerlines of the tissues were marked with dots. (f) Quantification of tissue curvature. N=3 tissues. (g) Fully automated registration of autofluorescence images from a SHIELD mouse brain sample to autofluorescence images of Allen brain atlas (© 2015 Allen Institute for Brain Science. Allen Brain Atlas API. Available from: brain-map.org/api/index.html). Scale bar = 2 mm. Mean +/− standard error mean was used for all the bar graphs. One-way ANOVA, Turkey’s multiple comparison test, *P<0.05, **P<0.01, ***P<0.001.
Supplementary Video 1.
A series of xy-plane images showing uniform (dT)50-Cy3 FISH signal in a SHIELD-processed block. A 1 mm-thick block is dissected from an intact mouse hemisphere preserved by SWITCH-mediated SHIELD followed by active delipidation using stochastic electrotransport. Z-step size: 10 μm. This result was confirmed in 3 independent trials with similar results.
SWITCH-mediated SHIELD also preserves organ-scale tissue architecture. Delipidation of mouse brains can collapse lipid-rich structures, which can deform connected regions and overall tissue structure (Fig. 3a-d; Supplementary Fig. 4). In particular, PFA-fixed tissues and polyacrylamide-tissue-hybrids with a low degree of crosslinking or gel density can deteriorate under delabeling condition (70°C for 2 hr, 300 mM SDS) (Fig. 3a-b; Supplementary Fig. 4). Such widespread structural distortion can cause systematic errors in downstream image analysis and data interpretation. By contrast, SHIELD tissues exhibited no detectable distortion after delipidation and further destaining treatment (Fig. 3a-b,d; Supplementary Fig. 4). 3D imaging of SHIELD-hemisphere showed excellent brain-wide preservation of GFP signal and tissue architecture (Supplementary video 2). This minimal tissue distortion enabled automated atlas alignment and region segmentation (Fig. 3g). SHIELD samples are rigid and can be handled repeatedly without structural damage (Fig. 3e,f). Compared to existing methods, the ability to lock in both transcripts and proteins within transparent organs while maximally preserving endogenous fluorescence and tissue architecture is a signature advantage of SHIELD.
Supplementary Video 2.
3D autofluorescence (white) and YFP (green) signals from a Thy1-H line mouse hemispheres processed with PACT, iDISCO+, and SHIELD. PACT tissue was passively cleared at 37°C for 6 days. SHIELD tissue was cleared using SE for 3 days. This experiment was done once.
SHIELD enables integrated 3D mapping of the human brain
The controllable reaction kinetics of SHIELD can be further applied to banked clinical samples to obtain durable tissue-gel capable of withstanding multiple rounds of staining and elution. To demonstrate the potential for generating integrated human brain maps using SHIELD, we processed a formalin-fixed 2 mm-thick coronal block of human brain taken at the posterior boundary of the occipital horn of the lateral ventricle (9 cm × 5.5 cm x 0.2 cm, aspect ratio = 45:1) and passively cleared it at 80°C for 10 days (Fig. 4a,b). Although gray matters became fully transparent after a few days, we extended the incubation time to completely clear dense white matter. PFA-only and CLARITY tissues became severely damaged and mechanically unstable after full clearing. The high aspect ratio of such disintegrated tissue made it susceptible to additional physical damage during tissue handling. The tissue processed with SHIELD, however, was both transparent and structurally stable. Nuclear and vasculature labeling of the hybrid revealed macroscopic tissue architecture as well as individual cells (Fig. 4c; Supplementary video 3).
Figure 4. SHIELD enables 3D imaging of various structures and cell-types and their morphological details in human brain tissue.
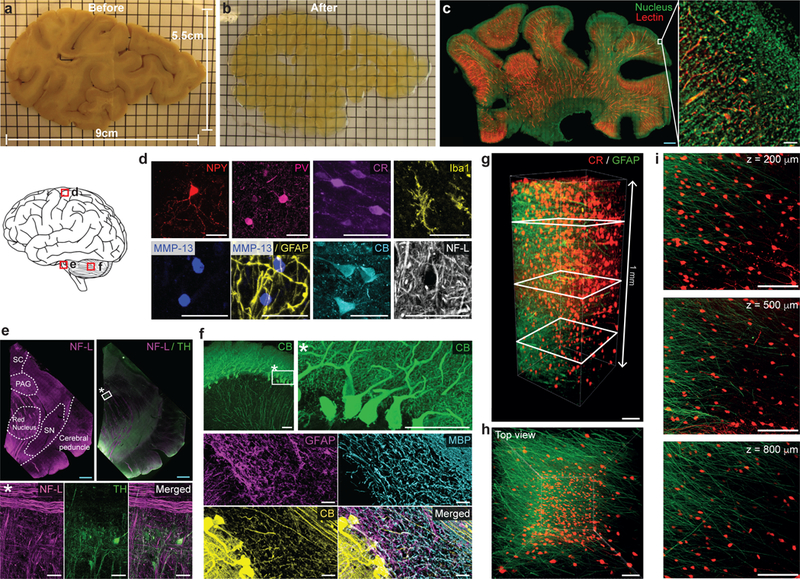
(a-b) 2 mm-thick slab of human brain coronal hemisphere (9 cm × 5.5 cm × 2 mm) before (a) and after (b) SHIELD processing. Grid = 5 mm. (c) A SHIELD-processed slab (22 mm × 38 mm × 1.3 mm) was stained with lectin and nuclear dye, and the 800μm-thick volume from the top surface was imaged with a custom-built temporally focused line-scanning two-photon microscope. Scale bars = 2 mm (blue) or 100 μm (white). See Supplementary video 3. (d-f) Immunostained cortex (d), midbrain (e), and cerebellum (f) from 100-μm-thick SHIELD-processed human brain tissues showing various cell-types and structures. In e, neurofilament-L (NF-L) staining assists delineation of midbrain areas. MMP-13, matrix metallopeptidase 13; SC, superior colliculus; PAG, periaqueductal gray; SN, substantia nigra; MBP, myelin basic protein; TH, tyrosine hydroxylase; Scale bar = 2 mm (blue) or 50 μm (white). (g-i) GFAP (green) and CR (red) immunolabeling of a SHIELD-processed 1 mm-thick human cortex coronal block. See Supplementary video 4. (g) 3D reconstruction. Scale bar = 100 μm. (h) Top view of the 3D reconstruction. Scale bar = 100 μm. (i) Maximum intensity projection images at various z-positions (200, 500, and 800 μm) marked by white rectangles in g. For maximum intensity projection, 100 μm-thick z-stacks were used at each z-position. Scale bar = 100 μm.
Supplementary Video 3.
3D rendering of a SHIELD-processed human brain slab (size: 22 mm x 38 mm x 1.3 mm) highlighting nuclei (green) and blood vessels (red). The sample was passively stained and imaged with a custom-built temporal focused line scanning two-photon microscope. This experiment was done once.
SHIELD-processed human tissue was compatible with various cell-type and structural markers and that cyto-, chemo-, and myeloarchitectural details could be visualized. In cortical tissue, we confirmed the presence of various interneurons as well as glial cells (Fig. 4d-i; Supplementary video 4). In the cerebellum, calbindin (CB) staining provided rich morphological details, enabling cell-type classification based on both morphology and protein expression (e.g., Purkinje cells) (Fig. 4f). We also showed that we could stain for neurofilament proteins and extracellular matrix protein (Fig. 4d). Myelin basic protein staining showed the myeloarchitecture of different brain regions (Fig. 4f). In the midbrain, neurofilament (NF-L) staining enabled delineation of individual nuclei and brain regions (Fig. 4e). Within these parcellated regions, we could probe for cell-type and morphological information by staining for tyrosine hydroxylase (TH) (Fig. 4e). Taken together, these results show that SHIELD processing facilitates the simultaneous visualization of both structural and cellular features in human brain tissue, enabling integrated 3D human brain mapping at cellular resolution.
Supplementary Video 4.
3D rendering of GFAP (green) and CR (red) immunolabeling of a 1 mm-thick SHIELD-processed human cortical coronal block. This result was confirmed in 3 independent trials with similar results.
SHIELD allows new approaches in tissue phenotyping
We next tested whether SHIELD allows rapid phenotyping of freshly excised biopsies. Microscopic examination of a biopsy has been the gold standard for diagnosis of many diseases39. Conventional histology, however, requires laborious and slow processes to formalin-fix, dehydrate, paraffin-embed, section, and stain tissue samples. Relatively few of the slices produced by sectioning are imaged. The resulting sparse sampling and loss of volumetric information can limit diagnostic accuracy. Recent advances in tissue clearing techniques have enabled more holistic, volumetric imaging of intact biopsies40–42. These methods, however, rely on slow diffusion of chemicals and therefore become increasingly inefficient as the size of the biopsy increases.
SHIELD combined with SE can preserve, clear, and immunolabel intact needle biopsies within 4 hr (Fig. 5a-e). The controllable SHIELD reaction kinetics enabled rapid conversion of a fresh biopsy sample into a clearable tissue-gel (Fig. 5a,b). We then used SE to rapidly clear and uniformly label the intact sample with a vasculature marker and antibodies within 2 hr (Fig. 5c,d; Supplementary video 5). This pipeline is also applicable to PFA-fixed tissues. For example, we were able to visualize proliferating Ki-67–positive cells and vasculature in a PFA-fixed mouse kidney harboring breast cancer metastasis (Fig. 5e; Supplementary video 6). Taken together, these results demonstrate that the SHIELD-based pipeline may enable rapid 3D phenotyping of intact biopsy samples.
Figure 5. SHIELD enables new tissue phenotyping approaches.
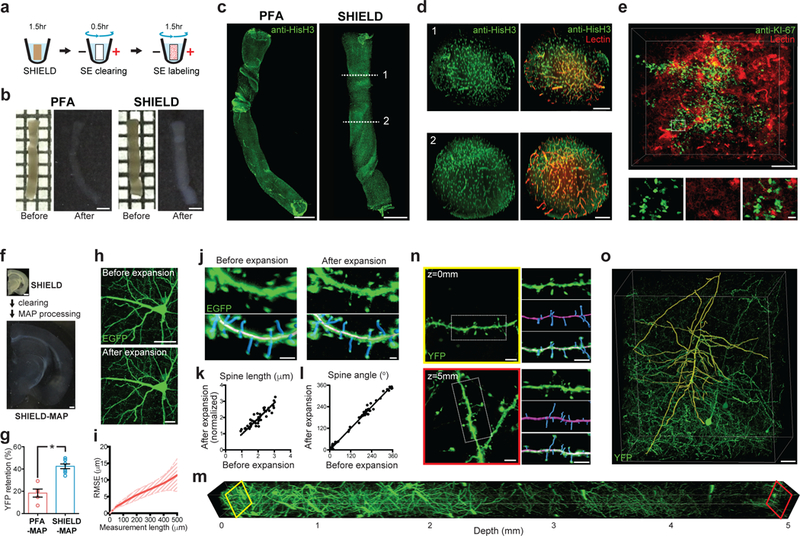
(a-e) Ultrafast 3D molecular phenotyping of intact needle biopsy. (a) Pipeline. (b) Morphological preservation of a fresh brain biopsy by SHIELD after clearing. Grid = 1 mm; Scale bar = 1 mm. (c) Complete immunolabeling and visualization of an intact biopsy sample with Histone H3 antibody (anti-HisH3). Scale bar = 1 mm. See Supplementary video 5. (d) Cross-sectional images of c. Note that antibody and lectin signal is uniform throughout the entire volume. Scale bar = 200 μm. (e) A mouse kidney biopsy harboring breast cancer metastasis was rapidly processed and stained for a cancer cell marker (anti-Ki-67 antibody). Scale bar = 200 μm (top), 20 μm (bottom, zoom-in images). See Supplementary video 6. (f-o) Superresolution imaging of endogenous FP signal in large tissue volumes by SHIELD-MAP. (f) SHIELD-MAP pipeline and processed tissue images. (g) Fluorescence retention after PFA-MAP and SHIELD-MAP. N=4 tissues. Mean +/− standard error mean was used for plotting this graph. (h) Images showing a GFP-expressing neuron before (top) and after (bottom) SHIELD-MAP processing and expansion. Scale bar = 50 μm. (i) Root-mean-squared measurement error (RMSE) of the images before and after SHIELD-MAP processing and expansion (red line, mean; filled area, s.d.; N = 4 tissues). (j) Images showing segmented EGFP-expressing dendritic spines (blue) before and after SHIELD-MAP expansion. Scale bar = 2 μm. (k-l) SHIELD-MAP preserves morphological features of the spine, such as length (k) and angle (l) Spine length after expansion is normalized by the tissue expansion ratio. Linear regression, R2 = 0.7764 (k) and R2 = 0.9879 (l) N=49 and 62 spines for k and l, respectively. (m-n) Volumetric imaging of 5 mm-thick expanded SHIELD-MAP tissue. See Supplementary video 7. (n) Images showing segmented dendrites (magenta) and spines (blue) from the tissue surface (top) and at a depth of 5 mm (bottom; 1.67 mm pre-expansion). Scale bars = 10 μm. (o) Reconstructed dendrites (yellow) of a cortical Thy1-YFP+ neuron. Scale bar = 200 μm. See Supplementary video 8. Unpaired T-test, *P<0.05.
Supplementary Video 5.
3D rendering showing a fresh biopsy sample processed with the SHIELD-based rapid phenotyping (< 4 hr) pipeline. Nuclei (green) were labeled with anti-histone H3 antibody, and blood vessels (red) were labeled with lectin This result was confirmed in 3 independent trials with similar results.
Supplementary Video 6.
Mouse kidney tumor tissue processed with a SHIELD-based rapid phenotyping pipeline showing anti-KI-67 immunostaining (green) and lectin labeling (red). This result was confirmed in 2 independent trials with similar results.
Combining SHIELD with MAP (Magnified Analysis of the Proteome) allows interrogation of fine structural and molecular features across large tissue volumes (Fig. 5f-o). Although MAP enables super-resolution imaging of millimeter-thick samples with diffraction-limited microscopes13, the harsh treatment required for isotropic expansion causes loss of FP signal. Therefore, additional immunolabeling is necessary to image FP-tagged features. We discovered that interpenetrating dense hydrogel can mechanically expand SHIELD-processed tissue isotopically by three-fold without the need for harsh treatment (Fig. 5f-l), while effectively preserving FP fluorescence (Fig. 5g; Fig. 6). Distortion analysis of GFP-positive neurons before and after expansion showed less than 4% error across multiple length scales (Fig. 5h,i), which is comparable to results from previous expansion protocols13,19,43. Morphological details of dendritic spines were also well preserved after expansion (Fig. 5j-l).
Figure 6. SHIELD enables integrated circuit reconstruction at single cell resolution.
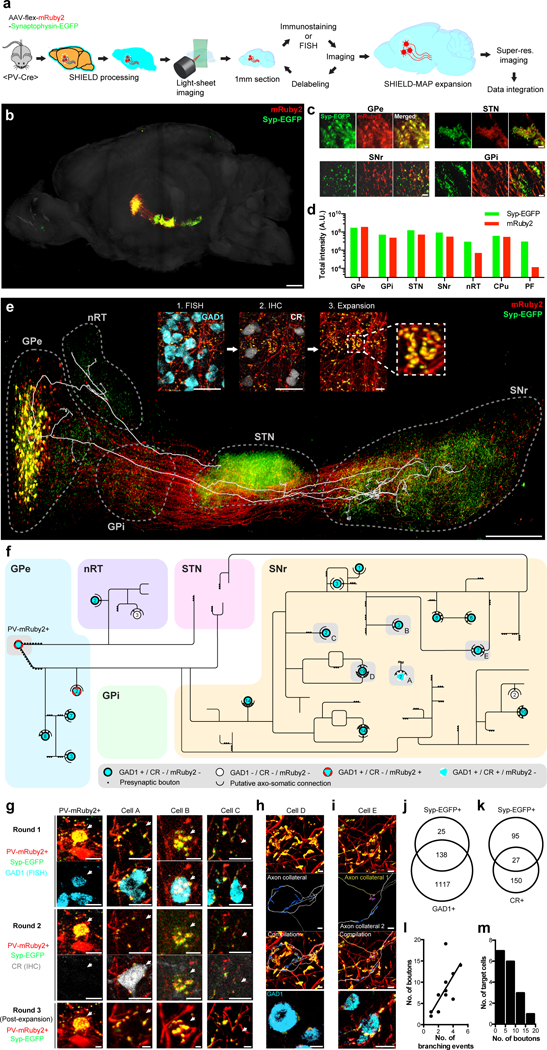
(a) Pipeline. (b) 3D rendering of the intact mouse hemisphere showing brain-wide projection patterns of labeled GPe-PV+ neurons. See Supplementary video 9. (c) Representative images of labeled neurons and their pre-synaptic terminals in GPe, STN, SNr, and GPi. (d) Total pixel intensity of mRuby2 and EGFP in seven brain regions to which the labeled GPe-PV+ neurons project. (e) 3D rendering of labeled GPe-PV+ neuronal circuitry with the overlaid axon trace of a single labeled neuron. The inset shows example images from multiround staining and multiscale imaging. Scale bar = 1 mm (50 μm for insets). (f) Reconstructed axon arborization of the neuron and its downstream targets. Each circle represents a neuron. The number of putative axosomatic boutons is marked inside each circle. (g) Images of the circuit components from multiround imaging. The arrow indicates the target cell body. Scale bars = 20 μm. (h) Reconstructed putative axosomatic connectivity. Ramified axons (gray) and EGFP+ presynaptic boutons (blue) are segmented. Scale bars = 20 μm. (i) Convergence of two axon collaterals branched remotely from the target cell body. See Supplementary video 11 for a 3D reconstruction of this connectivity. (j-k) Venn diagram showing three different neuronal populations in the SNr. (j) GAD1+ / Syp-EGFP−, GAD1+ / Syp-EGFP+, and GAD1− / Syp-EGFP+. (k) CR+ / Syp-EGFP−, CR+ / Syp-EGFP+, and CR− / Syp-EGFP+. Unbiased sampling was used. (l) A relationship between the number of axosomatic boutons and the axonal branching events of the reconstructed PV-mRuby2+ neuron near the target neuronal soma. Linear regression, R2 = 0.55, F-test = 17.40, P = 0.0009. N=11 connections. (m) The distribution of the number of putative axosomatic boutons. Mean +/− standard error mean was used for all the bar graphs.
SHIELD-MAP enabled super-resolution imaging of FP-labeled fine subcellular architecture in millimeter-thick samples. Traditionally, imaging and volumetric reconstruction of synaptic input fields or dendritic arborization has been limited to specific classes of neurons confined to a small volume because it requires imaging with high numerical aperture (NA) (1.4) objectives with a short working distance (200–300 µm)44,45. SHIELD-MAP extends such studies to a wider range of neuronal types by enabling super-resolution imaging of FP fluorescence in tissue that is an order of magnitude thicker using medium NA (1.0) objectives with a long working distance (8 mm). We demonstrated imaging of FP-expressing dendritic spines in 5 mm-thick mouse brain tissue post expansion (Fig. 5m,n; Supplementary video 7). Negligible loss of resolution and high FP signal enabled the extraction of fine morphological features throughout the entire depth of the sample (Fig. 5n) and the reconstruction of the dendritic arborization of a single neuron spanning a large tissue volume (Fig. 5o; Supplementary video 8).
Supplementary Video 7.
A series of optical sections of SHIELD-MAP tissue from the surface to a depth of 5 mm. Note that YFP+ fine structures (e.g., spine) are well resolved throughout the volume. This result was confirmed in 2 independent trials with similar results.
Supplementary Video 8.
3D rendering of a reconstructed YFP-expressing neuron in a Thy1-YFP H line mouse brain cortex using SHIELD-MAP. Reconstructed fibers are marked in yellow. This experiment was done once.
Integrated cellular resolution circuit mapping
We next applied SHIELD to comprehensively characterize a genetically defined neural circuit. The GPe is a major relay in the indirect pathway in the basal ganglia46, and is thought to play a role in voluntary movements and movement disorders such as dystonia and Parkinson`s disease47. About 40% of neurons in the GPe are PV+48 and their projections to multiple basal ganglia nuclei have been identified. However, it remains unclear how individual PV+ neurons in the GPe (GPe-PV+) project to multiple target areas at the single-cell level. SHIELD combined with viral labeling tools might enable integrated mapping of GPe-PV+ long-range output, downstream target cells, and those cells’ molecular properties at single-cell resolution.
To test this possibility, we targeted GPe-PV+ by injecting AAV-hSyn-DIO-mRuby2-Synaptophysin-EGFP virus into a PV-Cre transgenic mouse brain (Fig. 6a), which labeled neurites with mRuby2 and presynaptic boutons with EGFP49. We SHIELD-processed and SE-cleared an intact mouse brain hemisphere, and imaged it using a light-sheet microscope (Supplementary table 3) to map the global projection pattern of GPe-PV+ neurons (Fig. 6a-d; Supplementary video 9). Negligible tissue distortion and FP signal loss enabled automated atlas alignment, brain segmentation, and FP signal detection (Fig. 6c-d). We found GFP-labeled synaptic terminals in the GPe, subthalamic nucleus (STN), substantia nigra reticulata (SNr), globus pallidus interna (GPi), nucleus reticularis thalami (nRT), caudate putamen (CPu), and parafascicular nucleus (PF) (Fig. 6b-d).
Supplementary Video 9.
3D rendering of a hemisphere showing labeled GPe-PV+ circuitry. mRuby2+ neurites are shown in red and Synaptophysin-EGFP+ boutons are shown in green. This experiment was repeated independently 4 times with similar result.
To further investigate the PV-GPe circuit, we dissected a 1 mm-thick tissue block that included the GPe, STN, nRT, GPi, and SNr. We then performed FISH followed by delabeling and immunostaining to map GAD1 mRNA and calretinin protein (Fig. 6a,e; Supplementary video 10). Finally, the tissue was expanded using SHIELD-MAP for super-resolution imaging (Fig. 6a,e).
Supplementary Video 10.
3D rendering of 1 mm-thick mouse tissue showing labeled GPe-PV+ circuitry after first-round GAD1-FISH (cyan) staining. The mRuby2+ neurite is shown in red, and the synaptophysin-EGFP+ bouton is shown in green. This experiment was done once.
All GPe-mRuby2+ neurons were GAD1+ and had Syp-EGFP+ punctas on their soma, suggesting putative axosomatic connectivity among GPe-PV+ neurons. To characterize the long-range output of a GPe-PV+ neuron at single-cell resolution, we reconstructed the axonal arborization of an mRuby2+ neuron (Fig. 6e,f). The preservation of FP signal and enhanced resolution obtained with SHIELD-MAP allowed reliable reconstruction of individual axons and their presynaptic boutons (Fig. 6e-i, Supplementary video 11). Negligible tissue damage and isotropic expansion enabled integration of the molecular features acquired from the FISH and immunostaining rounds into the axogram (Fig. 6f,g), which allowed molecular characterization of the traced neuron and its downstream targets (Fig. 6f-m).
Supplementary Video 11.
3D super-resolution images of putative axosomatic connectivity. Axon collaterals bifurcating remotely from their target neuron are segmented with different colors (gray and yellow), as are their presynaptic boutons (blue and purple). This result was confirmed in three cases with similar results.
The resulting multidimensional axogram revealed that the reconstructed neuron is possibly connected to 4 neurons in the GPe, 2 neurons in the nRT, and 13 neurons in the SNr through axosomatic synapses (Fig. 6f). Most of the downstream targets were GAD1+. In the SNr, all downstream targets of this neuron were CR− despite the finding that 22% of SNr neurons with EGFP+ axosomatic boutons were CR+ (Fig. 6k). Eighty-five percent of Syp-EGFP+ SNr neurons were GAD1+ (Fig. 6j).
We found that the reconstructed neuron innervated the STN through three different axon collaterals originating from two axon hillocks (Fig. 6e,f). Collaterals to the nRT or SNr were from a single axon hillock (Fig. 6e,f). Statistical analysis of presynaptic ultrastructure revealed that the number of bifurcations near the target neuronal soma is positively correlated with the total number of axosomatic boutons (Fig. 6l). A subset of GAD1+ SNr neurons receives putative axosomatic inputs from multiple collaterals bifurcating far from their target soma (92.2 ± 16.1μm linear distance before expansion, N=3 cases) (Fig. 6f-i). This data shows that SHIELD together with MAP enables integrated multiscale circuit mapping with unprecedented resolution and accuracy. This approach may provide an anatomical framework for understanding neural circuit mechanisms.
DISCUSSION
In this study, we identified a polyepoxide for advanced tissue processing that possesses several key properties, including (1) polyfunctional reactive groups with a flexible backbone for the formation of intra- and intermolecular bonds, (2) reactivity to various classes of biomolecules, and (3) tightly controllable reaction kinetics under mild conditions. By promoting multipoint intramolecular FP crosslinks, SHIELD safeguards FP signal against harsh conditions commonly used in many tissue phenotyping methods. Controlled tissue epoxidation effectively crosslinks both proteins and nucleic acids while preserving their probe-binding affinities to various commercially available antibodies and FISH reagents. Epoxidation also protects tissue architecture during delipidation and destaining.
SHIELD combined with SWITCH can effectively preserve endogenous molecules, protein fluorescence, and tissue architecture uniformly in both intact mouse hemispheres and long-banked clinical samples. SWITCH ensures uniform dispersion of polyepoxide throughout a large-scale sample before the synchronized initiation of the epoxidation reaction enabling the preservation of tissue-wide physicochemical properties. Key parameters (e.g., incubation time) of SWITCH-mediated tissue epoxidation will, however, need to be optimized for different types of samples.
Recently, tissue-clearing techniques have been applied to biopsy samples to demonstrate the potential of 3D pathology approaches to improve the diagnosis and treatment of cancer40–42. These benefits, however, were moderated by a lengthy processing time or potential damage to tissue architecture. By contrast, the SHIELD and SE processing pipeline enabled 3D molecular phenotyping of intact needle biopsies with very high speed (4 hr for a 1 mm-diameter biopsy). This pipeline could be used to quickly determine a tumor’s subtype and heterogeneity in clinical labs when timely treatment is required.
Recent advances in viral labeling, tissue processing, and imaging technologies have enabled mapping of long-range wiring in mouse brains50–52. For instance, Ye et al., demonstrated brain-wide mapping of axonal bundle projections using CLARITY50. Economo et al. 51, developed a platform for brain-wide imaging and reconstruction of long-range axonal arbors at single fiber resolution using partial tissue clearing and a high-speed two-photon microscope integrated with a tissue vibratome. However, molecular phenotyping of the very same cells with known axonal projection pattern and identifying their downstream target cells, which is crucial in understanding cell function, remains challenging.
When combined with genetic and viral tools, SHIELD may serve as a powerful platform for integrated multiscale interrogation of neural circuits. The high level of FP preservation in SHIELD and SHIELD-MAP enabled repeated imaging of FP-labeled neuronal structures across multiple scales, from whole brain to submicron architectures (e.g., synaptic puncta). We demonstrated that global projection patterns can be mapped using SHIELD followed by SHIELD-MAP for super-resolution imaging of regions of interest in the same brain to reconstruct individual axonal projections and synaptic structures. Thanks to high FP signal and low background, we could use low laser power to image multiple FPs repeatedly with minimal photobleaching. Even though SHIELD-MAP decreases FP density by 27-fold owing to 3-fold linear expansion, we were still able to clearly and rapidly image FP-labeled axonal fibers as well as presynaptic puncta.
SHIELD and SHIELD-MAP enable extraction and integration of brain-wide wiring, single-cell-resolution axograms, and the molecular features of downstream neurons from the same brain. To demonstrate, we reconstructed the axogram of a GPe-PV+ neuron, including its axon arborization patterns and molecular details of its downstream targets, and their putative axosomatic connectivity with presynaptic bouton numbers. We claim only putative axosomatic connectivity because we only used presynaptic boutons adjacent to somata as indicators of neuron-to-neuron connection. Additional multiplexing with postsynaptic proteins (e.g., PSD95) and dendritic proteins (e.g., MAP2) may allow more precise mapping of synaptic connections using SHIELD.
We anticipate that existing tissue-phenotyping methods requiring unphysiological treatment will benefit from SHIELD as it protects biological tissue against a wide range of stressors. The integration of SHIELD with other protocols may, however, require systematic optimization because tissue epoxidation changes the degree of structural and molecular preservation, which subsequently affects downstream processing. For example, SHIELD treatment increases the amount of biomolecules and structural features preserved, which can decrease tissue permeability and slow molecular transport. Therefore, subsequent steps that require molecular transport will need to be optimized.
Penetration depth of molecular probes in SHIELD tissue is dependent on tissue type, size, and copy number and distribution patterns of target molecules. SHIELD enables high SNR imaging of a wide range of biomolecules thanks to a minimal loss of endogenous molecules and their probe binding affinities. To avoid depletion of molecular probes by high copy number targets, we recommend using SWITCH to control probe-target binding kinetics. SE further enhances speed and uniformity of labeling in various types of tissues and organs28. The processing time and the required probe amount would need to be empirically determined for each target and sample type as in all other tissue phenotyping methods.
SHIELD in combination with DNA and RNA FISH approaches can facilitate spatial genomics53,54 and the integration of single-cell sequencing analysis into a 3D cell map of model systems and clinical samples7. SHIELD can also be used for volumetric mapping of gene expression profiles in whole-mount intact tissues at single-cell resolution using multiplexed FISH techniques53,54.
Polyepoxide and other multifunctional crosslinkers have been widely used in various industries as coating resins, adhesives, and embedding media for electron microscopy55. A large library of multifunctional crosslinkers is available and new chemicals with different functionalities are currently being developed. We envision that rationally guided screening or designing of new multifunctional crosslinkers will further enhance the utility of the SHIELD approach.
The versatility of SHIELD combines many advantages of existing methods into a simple, scalable, and broadly applicable protocol. SHIELD synergizes with a wide range of technologies and will enable new integrated approaches for studying complex biological systems.
Materials and Methods
Detailed protocols are available online (http://www.chunglabresources.com).
Molecular Dynamics Simulations.
100 epoxide conformers in the fully-ring opened amine-reacted state was generated using the distance geometry method implemented in RDKit. After discarding conformers within 0.5-Å heavy atom RMSD, the remaining structures were minimized with the MMFF94 force field56,57. Conformers were sorted by their MMFF energy and filtered again for uniqueness using a 1.0-Å heavy atom RMSD cutoff on the post-minimization geometries. Distances between the side-chain-mimicking N atoms were measured for the final minimized conformers.
A 227-residue, 3567-atom EGFP (PDB ID:4EUL) model was used for this study, where the chromophore was replaced with an Ala residue to simplify force field assignments. EGFP was protonated using the H++ webserver assuming a pH of 7.0, which yielded a net charge of −7. All simulations were carried out with the AMBER16 suite and with the AMBER tleap program for further protein preparation. A rectangular prism of water was added by adding at least 20 Å water buffer from the edge of the protein prior to NPT equilibration with periodic boundary conditions. A neutral simulation cell was obtained by adding Na+ charges to this water cell, producing an initial simulation box roughly 89×95×100 Å in size and containing 73,846 atoms. The AMBER ff14SB force field was used for the protein in MM simulations along with a TIP3P water force field and standard AMBER Na+ force field parameters.
Prior to production molecular dynamics, equilibration was carried out as follows: i) 1000 constrained-protein (i.e. only solvent and ions are minimized while the protein is held fixed) and 2000 free-protein minimization steps (i.e. everything in the system is minimized), ii) 20 ps quick NVT heating to 50 K with a 0.5 fs timestep, iii) 20 ps quick NVT heating from 50 K to 300 K with a 0.5 fs timestep, and iv) 1.05 ns NPT equilibration (p = 1 bar, T = 300 K) with a 2 fs timestep. Following this equilibration, 100 ns of NpT production dynamics was carried out. A Langevin thermostat was employed with a collision frequency of 5.0 ps−1 in all constant temperature equilibration or production, and a Berendsen barostat with a pressure relaxation time of 2.0 ps was employed for all constant pressure equilibration or production. A random seed was used to avoid synchronization artifacts in the case of Langevin dynamics constant temperature simulation. For all cases, at minimum the backbone (i.e., amide C or N and Cα atoms) of the protein were held fixed with a 500 kcal/mol.Å2 restraint to sample only configurational sidechain dynamics of EGFP with the backbone held fixed to its orientation in the 1.35-Å resolution crystal structure58. In all cases, the SHAKE algorithm59 (i.e., fixed X-H bonds) was employed to enable longer 2 fs timesteps, but shorter timesteps were used during equilibration to avoid bubble formation during box size adjustment. For the long-range electrostatics, the particle mesh Ewald method was used with a 10-Å electrostatic cutoff.
Surface exposed residues were defined based on consensus of two metrics over the course of the entire 100 ns trajectory, as judged by analysis on 50,000 evenly spaced frames. The following metrics were employed. 1) A residue was considered buried if its sidechain atom (Lys N, Cys S, Tyr O, His either N) had less than 2.5 Å2 exposure to solvent. The surface was calculated using a 1.4 Å radius probe with an in-house python script that used the PyMOL dot_solvent built-in command. 2) The full residue’s contribution to the total protein solvent-exposed surface area (SASA) was computed using the cpptraj utility in the AMBER suite over the trajectory, and the average, maximum, and minimum contribution to SASA was retained. A buried residue based on the AMBER estimation will have a negative SASA. Residues that were deemed exposed in < 10% of frames based on criterion 1 and had negative average or low maximum contributions to SASA were deemed buried for this analysis. This assignment of buried versus exposed was also verified by visual inspection. From 39 candidate epoxide-functionalization sites (i.e., lysine, cysteine, histidine, and serine residues), 8 residues were judged to be buried (C48, C68, Y72, K83, Y90, Y104, H179, and H197), whereas the remaining 31 residues were deemed surface exposed (K3, H25, K26, Y39, K41, K45, K52, H75, K77, H79, K99, K105, K111, K124, K129, H137, K138, Y141, Y143, H146, Y149, K154, K156, K160, K164, H167, Y180, Y198, K207, K212, and H215). The trajectory from production dynamics was analyzed by computing all possible sidechain-sidechain distances on the surface-exposed, candidate epoxide functionalization sites of EGFP using a combination of the cpptraj utility in AMBER and our own in house python codes. Analysis of minimum, maximum, and average pairwise distances between the functional groups of only surface exposed residues was carried out with an in house python code and used to generate the histogram featured in the main text.
Recombinant GFP expression and purification.
EGFP plasmid (Champion pET SUMO Expression System, Thermo Fisher) was transformed into BL21 E. coli competent cells, and amplified in 1 L Terrific Broth (ON, 37 °C) to an OD600 of 0.5–0.6. EGFP expression was induced by adding IPTG (1 mM final concentration; ON, 37°C). The culture was pelleted and resuspended in the lysis buffer (50 mM tris-HCl pH 7.5, 150 mM NaCl, 10 mM imidazole), and lysed by sonication followed by centrifugation at 20,000 rpm (20 min, 4°C). EGFP was purified with Ni-NTA column with a 50 mL wash (50 mM tris-HCl, pH 7.5, 150 mM NaCl, 25 mM imidazole) and eluted (50 mM tris-HCl, pH 7.5, 150 mM NaCl, 500 mM imidazole). EGFP was further purified by size-exclusion gel chromatography using FPLC twice, first to remove imidazole and then to remove cleaved SUMO protein.
Preparation of epoxide solution.
Glycidyl methyl ether (GME) was purchased from Sigma-Aldrich (Cat No. 454680). The polyepoxide resins of ethylene glycol diglycidyl ether (EGDGE, product name EGDGE), 1,4-butanediol diglycidyl ether (1,4-BDE, product name GE21), dipropylene glycol diglycidyl ether (DGDE, product name GE23), polyglycerol 3- polyglycidyl ether (P3PE, product name GE38), and pentaerythritol polyglycidyl ether (PEGE, product name GE40) were provided by CVC Thermoset Specialties of Emerald Performance Materials. The resin of glycerol triglycidyl ether (TGE, product name EX-313) was provided by Nagase America Corporation. The resins were weighed and dissolved in an aqueous solution and then thoroughly vortexed for 1 min. The resulting suspension was centrifuged for 5 min at 7800 rpm and the supernatant was collected. This procedure was repeated until the supernatant became fully transparent. Most of GE38 resin is water insoluble. From BSA amine reaction assay, we found that the amine reactivity of supernatant of 1% GE38 at 37°C in pH 10 0.1 M sodium carbonate buffer is comparable to that of 0.475% PFA in pH 7.4 0.1 M sodium phosphate buffer with 10 mM NaCl at RT. We prepared the following solutions using the supernatant of 10 or 20 % (w/v) GE38 resin.
SHIELD perfusion solution: ice-cold 1X PBS containing 4% (w/v) PFA and GE38 supernatant.
SHIELD-OFF solution: ice-cold 1X PBS containing GE38 supernatant
SHIELD-ON solution: 0.1 M sodium carbonate buffer at pH 10, prewarmed to 37°C
SHIELD whole organ processing protocol.
Fixation.
Mice were transcardially perfused with ice-cold 1X PBS then with the SHIELD perfusion solution. Dissected brains or organs were incubated in the same perfusion solution at 4°C for 48 hr. Tissues were then transferred to the SHIELD-OFF solution and incubated at 4°C for 24hr. In the case of brain hemisphere clearing, an intact whole brain was split into hemispheres before being incubated in the SHIELD-OFF solution. Following the SHIELD-OFF step, the organs were placed into the SHIELD-ON solution and incubated at 37°C for 24 hr. Alternatively, if the tissues had been previously fixed with PFA, samples were washed in 1X PBS with 0.02% sodium azide at RT for at least 24 hr then incubated in the SHIELD-OFF solution for 3 days (in case of mouse brain hemispheres) at 4°C. The final SHIELD-ON step was the same as the procedure for perfused tissue described above.
Delipidation.
SHIELD-fixed organs were cleared passively for a couple of weeks (14 days at 45°C for mouse brain hemisphere) in SDS-based clearing buffer (300 mM SDS, 10mM sodium borate, 100mM sodium sulfite, pH 9.0), or rapidly cleared (<3 days for mouse brain hemisphere) using stochastic electrotransport (SmartClear Pro, LifeCanvas Technologies).
Optical clearing.
Delipidated tissues were incubated in Protos-based immersion media (125 g iohexol, 3 g diatrizoic acid, 5 g N-methyl-D-glucamine dissolved in 100 mL DI water and adjusted refractive index to 1.458 by adding DI water, or 50g diatrizoic acid, 40g N-methyl-D-glucamine, 55g iodixanol in 100mL DI water with the refractive index adjusted to 1.458 by adding DI water) until the tissue became transparent without any visible haze at tissue-medium interface.
GFP fluorescence retention screen.
An aliquot of GFP at a concentration of 0.5 mg/mL was reacted in either 1% (v/v) epoxide suspended in 0.1 M sodium carbonate buffer at pH 10 or aldehyde fixative in 1X PBS for 12 hr at 37°C. Excess crosslinker was removed by centrifugal filtration (10 kDa MWCO, Amicon), and the GFP was reconstituted in 0.1 M HEPES buffer at pH 7.5. Crosslinked GFP (0.1 mg/mL) or GFP in additive solution (0.1 mg/mL in 0.1 M of xylitol, sorbitol, trimethylamine N-oxide, or trehalose) was exposed to 90°C for 10 min, or incubated in 70% (v/v) methanol for 1 hr. Fluorescence was quantified with a UV-vis spectrometer (EnSpire Multimode Plate Reader 2300, Perkin Elmer).
Physiochemical characterization of GFP.
An aliquot of the crosslinked GFP solution was obtained using the same protocol as for the fluorescence retention screen. Differential scanning calorimetry (MicroCal VP-DSC, Malvern Instruments) was performed on the crosslinked GFP solution at a heating rate of 1.5°C/min (2 mg/mL, 0.1 M HEPES, pH 7.5). Circular dichroism (CD) spectra (J-1500 CD Spectrometer, JASCO) were collected on the crosslinked GFP solution (0.1 mg/mL in 10 mM sodium carbonate buffer at pH 8). GFP refolding experiments were performed according to previously established protocols. Briefly, 50 μL of GFP (1 mg/mL, 50 mM HEPES, pH 7.5) was combined with 50 μL dithiothreitol (DTT) solution (2 mM DTT, 50 mM HEPES, pH 7.5) and incubated for 5 min. Then 100 μL of 0.1 M HCl was added, and the mixture was incubated for an additional 5 min. Refolding was initiated by diluting the GFP mixture in TNG (0.1 M Tris, pH 7.5, 150 mM NaCl, 10% [w/v] glycerol) at a ratio of 1:10. Fluorescence recovery was measured using a UV-vis spectrometer (EnSpire Multimode Plate Reader 2300, Perkin Elmer).
Amine reactivity quantification.
o-Phthaldialdehyde (OPA) reagent (Fluoraldehyde, Thermo Fisher) was used to quantify the degree of epoxidation of amine residues on GFP and bovine serum albumin (BSA) proteins. BSA (1 mg/mL) was reacted with 1% (v/v) fixative for 12 hr at 37°C (0.1 M carbonate buffer at pH 10 for epoxides, 1X PBS at pH 7.4 for aldehydes). After removing excess reactants by filter centrifugation (3X PBS with the Amicon Ultra 30K NMWL, Millipore), 10 μL of reacted BSA (1 mg/mL reacted BSA in 1X PBS) was incubated with 200 μL OPA and measured within 5 min (Ex350/Em450). To determine the SWITCH on/off condition of P3PE, 100 mg/mL BSA was incubated with 10% (w/v) P3PE for 1 day in either 0.1 M sodium phosphate dibasic and 10 mM NaCl solution buffered at pH 7.4 at 4°C or 0.1 M sodium carbonate solution buffered at pH 10 at either 4°C or 37°C. Aliquots were removed and diluted by 20-fold in the same pH buffers to be measured within the linear response of the OPA reagent, and the degree of epoxidation was quantified with OPA without further purification. Measured values were normalized to the values obtained from BSA stock solutions at various concentrations, immediately after the addition of crosslinkers.
Nucleic acid reactivity.
(dA)15 and (dC)15 single strand DNA oligos synthesized by IDT were used for testing in nucleic acid reactivity to epoxides. Due to the difficulty in synthesis of poly deoxyguanine, we excluded (dG)15 oligo. We also excluded poly deoxythymine due to its weak nucleophilicity, yielding minimal crosslinking. Oligos at 250 μM were reacted with 1% (w/v) GME or 5% (w/v) P3PE in 0.1 M sodium carbonate buffer (pH 10) for 15 hr (GME) or 2 days (P3PE) at 37°C. The resulting reaction mixtures were subject to the standard ethanol precipitation to remove salts and unreacted epoxides and their molecular weight changes were determined by the MALDI mass spectrometry.
Mass spectrometry.
Crosslinked BSA (1 mg/mL) was concentrated by 40-fold (Amicon, 30 kDa MWCO, Millipore). An aliquot of 1 μL of crosslinked BSA was mixed with 4 μL of 10 mg/mL sinapinic acid matrix solution in 50% acetonitrile, 0.1% trifluoroacetic acid and spotted on a MALDI sample plate. An aliquot of 1 μL of crosslinked oligo after ethanol precipitation and 10-fold dilution by millipore water was mixed with 1 μL of the 9:1 mixture of 50 mg/mL 3-hydroxypicolinic acid in 50% acetonitrile and 50 mg/mL diammonium hydrogen citrate in Millipore water as a matrix. MALDI mass spectra were acquired by a Bruker MicroFlex MALDI-TOF mass spectrometer.
Mice.
Young adult (2–4 month, median age: 3 month) C57BL/6 mice were housed in a 12 hr light/dark cycle with unrestricted access to food and water. All experimental protocols were approved by the MIT Institutional Animal Care and Use Committee and the Division of Comparative Medicine and were in accordance with guidelines from the National Institute of Health. All experiments using mice were conducted in strict adherence to the ethical regulations of MIT Institutional Animal Care and Use Committee and the Division of Comparative Medicine. The following transgenic lines were used for this study: Thy1::GFP M-line, Thy1::YFP H-line, ChATBAC-eGFP (Jackson Stock No. 007902), PV-Cre / loxP-tdTomato (Jackson Stock No. 017320 and 007914), and Fos-CreERT2/DIO-tdTomato (Jackson Stock No. 021882, 007914). For the footshock experiment, mice were habituated in the fear-conditioning box for 10 min, followed by two sequential 5 s of 0.6-mA electric shocks at a 30-min interval. Five minutes after the second electric shock, mice were immediately sacrificed and perfused.
FP tissue epoxide screen.
The 100 μm coronal slices obtained from the 4% (w/v) paraformaldehyde (PFA) perfused Thy1::GFP M-line mouse. The slices were incubated in 1% fixative solution (1% w/v GA in PBS; 1% w/v epoxide in 0.1 M sodium bicarbonate buffer pH 9.5) for 6 hr at 37°C and washed with excess 1X PBST (0.1% (w/v) Triton-X 100). Additional 100 μm slices were obtained from CLARITY-embedded brains50. Processed slices were heated to 70°C in 1X PBS for 24 hr. The entire coronal slice was imaged before (after PFA-fixation only) and after thermal or chemical treatment (after tissue processing). Fluorescence retention was calculated with ImageJ by normalizing the mean intensity signal from the same 5 regions before and after treatment following background subtraction (N = 3 tissues per each sample group). Tissue slices with neurons expressing different FPs were similarly processed and analyzed.
Fluorescence retention after exposure to chemical conditions was quantified with Thy1::GFP M-line 100 μm coronal slices. Slices were processed with: 80% (v/v) methanol in deionized (DI) water (RT, 4 days), 100% THF (RT, 12 hr), uDISCO (50%, 80%, 95%, 100% (v/v) tert-butanol dehydration (37 °C, 15 min each step) and BABB-D4 (benzyl alcohol, benzyl benzoate and diphenyl ether at a ratio of 4:8:1) for 1 hr), CUBIC-L (5% (w/v) Triton X-100, 5% (w/v) N-butyldiethanolamine; 37°C, 5 days), and SDS clearing buffer (200 mM SDS, 100 mM sodium sulfite, and 10 mM sodium borate pH 9.5. 37°C or 56°C, 12 hr). Note that thereafter when we refer the SDS clearing buffer, it contains either 200 or 300 mM SDS, 100 mM sodium sulfite and 10 mM sodium borate at pH 9.0 or 9.5 (indicated in each section).
Preparation of PFA, GA, PACT, and iDISCO+ tissues.
For PFA tissue preparation, mice were intracardially perfused with ice-cold PBS, with ice-cold 4% (w/v) PFA in PBS (5mL/min), and then harvested tissues were post-fixed in PBS with 4% (w/v) PFA at 4°C for 48hr. Fixed tissues were washed with 1XPBS with 0.02% sodium azide at room temperature overnight.
To prepare GA-processed mouse brains, ice-cold 4%(w/v) PFA / 1% glutaraldehyde (16310, Electron Microscopy Sciences) in PBS (5ml/min) was prepared (Glutaraldehyde was added after PFA containing PBS solution cooled down to 4°C) and then used for perfusing mouse after ice-cold PBS perfusion. After 2 days of post-fixation in the perfusion solution containing fixatives, brains were split into hemispheres and then washed with PBS containing 0.1% Triton-X100 and 0.02% sodium azide at room temperature overnight. Tissues were inactivated in PBS with 1% (w/v) acetamide and 1% (w/v) glycine at 37°C for overnight, and then washed with PBS with 0.02% sodium azide at room temperature overnight.
PACT tissue preparation was done based on previous publication60. Briefly, PFA brains postfixed at 4°C for 24 hr were split into hemispheres and then moved to ice-cold hydrogel monomer solution (4% acrylamide and 0.25% azo-initiator VA-044 in PBS) then incubated at 4°C for 24hr. Brain in 10ml of the hydrogel monomer solution was gelated under nitrogen gas purging (10 psi) at 37°C for 2 hr. Excess hydrogels were washed with PBS with 0.02% sodium azide at room temperature overnight.
CLARITY tissue for immunoreactivity (Fig. 2i,j), autofluorescence (Fig. 2g) and tissue rigidity (Fig. 3g,h) comparisons were prepared based on Kim et al, 2015 with some modifications28. Hydrogel monomer solution was made with 4% (w/v) acrylamide (A3553, Sigma), 0.25% (w/v) VA-044, WAKO chemicals), 4% (w/v) PFA (15714-S, Electron Microscopy Sciences) in 1X PBS (70011–044; Invitrogen). After perfusion with ice-cold PBS, mice were perfused with 20 mL of the hydrogel monomer solution, followed by incubation in the monomer solution at 4°C for 72 hr. The brains were split into hemispheres and were moved to 10 mL of the fresh hydrogel monomer solution. Samples were gelated at 37°C for 2 hours with nitrogen gas purging (10 psi). After retrieval from the polymerized solution, gel pieces on the hemisphere surface were gently removed and the hemispheres were washed with PBS with 0.02% sodium azide at room temperature overnight. For EDC-CLARITY experiments, CLARITY processed brains were sliced into 100 μm sections then post-fixed in the EDC-based solution (0.1 M 1-Ethyl-3-(3-dimethylaminopropyl)carbodiimide, 0.1 M 5-ethylthio-1H-tetrazole, 0.1 M Methylimidizole pH 8.5) overnight at 37°C12 and used for dT oligo staining. For tissue integrity comparisons (Fig. 3a-f), CLARITY tissues prepared based on Ye et al, 2016 without modification.
iDISCO+ tissue preparation for tissue antigenicity, autofluorescence measurement, and rigidity comparison was performed by following the original iDISCO+ protocol61 with minor modifications. PFA tissues (see above) postfixed at 4°C 24 hr were washed in PBS with 0.02% sodium azide at room temperature overnight. After cutting into hemispheres, tissues were dehydrated sequentially with 20%, 40%, 60%, 80% MeOH for 1 hr each at RT, followed by 100% MeOH twice for 1 hr each. Tissues were chilled at 4°C and bleached with pre-chilled 5% H2O2 (1:5 dilution of 30% H2O2 with MeOH) at 4°C overnight. After brief washing with 100% MeOH twice, tissues were rehydrated sequentially, 80%, 60%, 40%, 20% MeOH for 1 hr each at RT, followed by 1X PBS with 0.02% sodium azide for 1 hr at RT. At this point, 100 μm slices or 1 mm sagittal sections were prepared by a vibratome and further processed for each experiment (see tissue antigenicity and rigidity test sections for the details). For tissue integrity and size comparison measurements, we followed the most updated iDISCO+ protocol from the iDISCO website (https://idiscodotinfo.files.wordpress.com/2015/04/whole-mount-staining-bench-protocol-methanol-dec-2016.pdf).
Virus injection.
Mice were anesthetized using 3% isofluorane with oxygen (1 L/min). After loss of the toe-pinch reflex, the skull was secured onto a stereotaxic (Kopf), and 500 nL of RV-mOrange-PSD95-EGFP was injected bilaterally into the dentate gyrus (−3.5 mm, +−2.5 mm, −2.8 mm for the anterior-posterior (AP), medio-lateral (ML), and dorso-ventral (DV) axes from lambda). At 6 days after injection, the mice were sacrificed and PFA-processed.
Autofluorescence analysis.
C57BL/6 mice were perfused then prepared according to the standard protocols of each tissue processing methods described above. Fixed samples were then sliced into 100 μm sections using a vibratome. Post-fixed tissues with glutaraldehyde at 37°C were prepared using the post-fixation protocol described above. For iDISCO+ tissues, due to the difficulty in mounting thin 100 μm slices, 1 mm coronal hemisphere sections were prepared. Tissues were cleared in either the 200 mM SDS buffer (pH 9.5, 37C, 3d; GA, CLARITY, SHIELD), 8% SDS buffer (pH 7.4, 37°C, 3 d; PACT), or 66% dichloromethane/33% methanol (3 hr, RT for 100μm slices; iDISCO+). After SDS-based buffer clearing, tissues were extensively washed with 1X PBST (0.1% v/v Triton X-100) overnight before imaging. Uncleared PFA tissues and cleared GA (both fixed at 4°C and 37°C), PACT, CLARITY, SHIELD, and iDISCO+ tissues were immersed in optical clearing media (PACT: RIMS60, iDISCO+: dibenzyl ether (DBE), others: Protos-based immersion media with 50g of diatrizoic acid) for imaging. The samples were imaged with four commonly used excitation wavelengths, 405, 488, 561, and 630 nm, with emission detection ranges of ~60 nm (+5 nm to ~+65 nm from the excitation wavelength) to measure background autofluorescence levels. Images were acquired from similar regions of brain with similar coordinates and at least three independently perfused and processed mice brains were used for the experiments. 100 μm slices of RV mOrange expressing tissue (see RV mOrange stereotaxic surgery) were fixed with GA or SHIELD according to the slice fixation protocol and subjected to confocal microscope imaging (see supplemental table 3 for imaging conditions).
Protein loss quantification.
Coronal sections of 1 mm thickness (PFA control, GA, or SHIELD-processed) were incubated in 1 mL of the SDS clearing solution (200 mM SDS, pH 9.0) for 12 hr at 70°C. The protein content of the supernatant was quantified using a Bio-Rad DC protein assay kit, following the instructions in the manufacturer’s manual.
Tissue antigenicity test.
GA, PACT, CLARITY and SHIELD-processed mice brain sections with 100 μm thickness (see “Preparation of PFA, GA, PACT, and iDISCO+ tissues” section for details) were cleared at 37°C for 3 hr with either 8% SDS buffer at pH 7.4 (PACT) or 200 mM SDS buffer at pH 9.5 (GA, CLARITY and SHIELD). Cleared sections were thoroughly washed with 1X PBS with 1% Triton-X by multiple buffer exchange, followed by overnight incubation at RT, then used for immunostaining. Uncleared PFA, cleared GA, PACT, CLARITY, and SHIELD-processed mice brain sections were incubated in 1X PBST (0.1% Triton-X100) with 2% normal donkey serum (NDS) at RT for 1 hr for blocking, followed by incubation with primary antibodies [rabbit anti-FoxP2 (ab16046, Abcam, MA), rabbit anti-calretinin (ab702, Abcam, MA), rabbit anti-parvalbumin (PV27, SWANT), rabbit anti-NeuN (2430S, CST), mouse anti-GFAP (3670S, CST), rabbit anti-iba1 (019–19741, Wako), rat anti-MBP (ab7349, Abcam, MA), mouse anti-NF-H (2836S, CST)] with a 1:300 dilution factor (1 μL in 300 μL of 1X PBST with 2% NDS) at RT overnight. For iDISCO+ slices, the original protocol61 was employed with permeabilization, blocking and primary staining buffers as described in the paper with a 1:300 dilution factor for primary antibody (see “Preparation of PFA, GA, PACT, and iDISCO+ tissues” section for details). After washing with 1X PBST with 2% NDS or iDISCO+ washing buffers for at least 8 hr, the sections were incubated in 1X PBST with 2% NDS with corresponding secondary antibodies (1 μL in 300 μL of 1X PBST with 2% NDS, or iDISCO+ secondary staining buffer) overnight at RT. Washing was performed in 1X PBST with 2% NDS or iDISCO+ washing buffers at RT for at least 8 hr, followed by 1X PBST washing for 1 hr. The sections were then imaged in 1X PBST using a confocal microscope. For iDISCO+, due to the difficulty of mounting thin slices, we skipped DBE mounting and simply conducted the imaging in PBST. For delipidation, the iDISCO+ sections were dehydrated in 20%, 40%, 60%, 80%, and 100% MeOH for 5 min each, briefly cleared in 66% dichloromethane/33% MeOH for 15 min, briefly washed in 100% dichloromethane, then rehydrated in 66% dichloromethane/33% MeOH, 100%, 80%, 60%, 40%, 20% MeOH, 1X PBS, 1X PBST for 5min each. All images were acquired at the very surface of tissue sections where the background signal induced by light scattering disappeared. Similar brain regions within similar coronal coordinates were chosen to allow for pair-wise comparisons among different tissues (PFA control, GA, PACT, CLARITY, SHIELD and iDISCO+ processed). To quantify the signal-to-noise ratios of antibody staining, three sections from each group were prepared, stained, and imaged as described above. Regions of interest for signal and background measurements were manually segmented, and their mean intensities were analyzed using ImageJ software.
For antibody compatibility test in supplementary figure 2(a,e,g,h), uncleared PFA control, GA, or SHIELD-fixed mouse brain sections at 200 μm thickness were incubated in 1X PBST (0.1% Triton-X 100) with primary antibodies (1 μg in 200 μL of 1X PBST) at RT overnight. When the concentration of antibody was unknown, an aliquot of 1 μL of antibody was used. After washing with 1X PBST for several hours, sections were incubated in 1X PBST with corresponding secondary antibodies (2 μg in 200 μL of 1X PBST) at RT overnight. Sections were then imaged in 1X PBST using a confocal microscope after washing in 1X PBST at RT for at least 8 hr. To avoid light scattering caused by tissue opacity, all images were acquired at the very surface of tissue sections within a 10 μm depth. Similar brain regions within similar coronal coordinates were chosen to allow for pair-wise comparisons among different tissues (PFA control, GA, SHIELD-processed). To quantify the signal-to-noise ratios of antibody staining, 4 sections from each group were prepared, stained, and imaged as described above. Image analysis was performed as described in the paragraph above.
Multiround immunostaining.
SHIELD-processed coronal slices obtained from H-line mice at 100 μm thickness were stained with primary antibodies (5 μg/antibody) pre-incubated with dye-conjugated Fab fragments (3:1 molar ratio between the Fab fragment and the primary antibody, Jackson Immunoresearch) for 12 hr at 4°C in 1X PBST. Following imaging, the slices were incubated in the destaining buffer (7 mM SDS, 0.5 M Tris-HCl, 1% (w/v) 2-mercaptoethanol, pH 6.8) for 18 hr at 37°C to remove bound antibodies. Subsequent rounds of immunostaining were performed similarly.
Hybridization chain reaction fluorescence in situ hybridization (HCR FISH).
To demonstrate the versatile applicability of SHIELD-tissue for various FISH experiments, a series of oligo probes with different lengths of anti-sense probe sequences were employed. DNA oligos at 18–22nt, 35nt and 50nt antisense sequences carrying B1, B3, and B5 initiator sequences flanking the 5’ or 3’ ends for 18–22nt and 35nt probes, and both ends for 50nt probes were synthesized by IDT (Coralville, IA) and used without further purification. Dye-conjugated hairpin probe sets (B1-Alexa Fluor 647, B3-Alexa Fluor 488, and B5-Alexa Fluor 546) were purchased from Molecular Instruments (Pasadena, CA) or prepared in-house using the standard NHS-ester coupling reaction scheme (B1-Cy5)62.
Probe sequences for somatostatin (B5-SST), neuropeptide Y (B1-NPY), YFP (B1-YFP), GAD1 (B1-GAD1, 22nt) were obtained as previously described12,62–64. For 35nt probes, we tiled 35nt GAD1 and cFos probes along the coding regions of the target genes and selected probe sequences by GC% to be 45–60% and the melting temperature to be < 80°C. vGluT1 and vGluT2 35nt probes were designed by OligoArray under the guidance of the previous publication65. The 3’ end of the 35nt probe sequences was appended to 4nt ‘ATAT’ linker followed by the B1I2, B3I2 or B5I2 HCR initiator sequences.
Using 100 or 200-μm SHIELD-tissues cleared at 37°C for 12 hr using 200 mM SDS buffer at pH 9.5, initial transcript-targeting probe hybridization was performed overnight (37°C, 15–16 hr) in hybridization buffer (30% (v/v) formamide for 18–22nt probes, 30–40% (v/v) formamide for 35nt probes, and 50% (v/v) formamide for 50nt probes, in 2X SSC with 10% (w/v) dextran sulfate with an average MW of 500 kDa (Sigma D8906) and 1 mg/mL salmon sperm DNA (Sigma D7656) at probe concentrations of 1 nM for 18–22nt probes, and 2 nM for 35- and 50nt probes. Once hybridization was finished, stringent washing was performed using 3 rounds of formamide wash (30% (v/v) formamide for 18–22nt probes or 50% (v/v) formamide for 35- and 50nt probes in 2X SSCT (0.1% (v/v) triton X-100), for 1 hr each wash at RT for 18–22nt and 35nt probes, and 37°C for 50nt probes), followed by 2 rounds of 2X SSCT washing at RT for 1 hr each. Tissue slices were then placed in amplification buffer (2X SSC, 10% (w/v) dextran sulfate) and equilibrated for 30 min before the addition of appropriate hairpin sets. Prior to incubation, hairpins were heated to 95°C for 90 sec, then snap-cooled on ice for 30 min. HCR amplification was performed overnight at RT using hairpin concentrations of 120–240 nM in the amplification buffer. After HCR was finished, the samples were washed by 3 rounds of 2X SSCT, 1h each at RT and subjected to confocal imaging.
For dT50-Cy3 oligo FISH performed to compare the retention of mRNA among PFA, EDC-CLARITY, GA and SHIELD processed tissues, 100 μm-thickness tissues cleared at 37°C for 1 day were hybridized as described before12 and imaged by a confocal microscope. For the whole-organ level transcript preservation test, a mouse hemisphere was processed by SHIELD epoxidation with perfusion protocol, followed by SE-clearing at 37°C for 8 days. The cleared hemisphere brain was washed in 1X PBST for 1 day at 37°C with multiple solution changes. Afterwards, 1 mm slice was obtained by cutting at the central coordinate using a vibratome, and hybridized for 2 day at 37°C as described before12, then washed in 2X SSCT, 15% (v/v) formamide at RT for 1 d, 2X SSCT for 3hr at RT. The sample was immersed in Protos-based immersion medium until optically cleared and imaged using a 25X 0.95 NA water objective. The uniformity of mRNA preservation across the tissue area was determined by dT oligo staining targeting against poly A tails of mRNA molecules.
Structural integrity and tissue size comparison.
1 mm-thick tissue blocks from four different coronal coordinates were cut from hemispheres that had been fixed and/or embedded for PACT, CLARITY, iDISCO+, or SHIELD processing. The surface of 1 mm-thick blocks were imaged for autofluorescence signal to record initial tissue structure of individual blocks. Afterwards the tissue blocks were cleared according to corresponding clearing conditions of each technique50,60. For SHIELD tissue blocks, 37°C 300mM SDS buffer was used. In case of iDISCO+ blocks, the most updated iDISCO+ protocol from the iDISCO website (https://idiscodotinfo.files.wordpress.com/2015/04/whole-mount-staining-bench-protocol-methanol-dec-2016.pdf) were used for clearing. To mimic hemisphere tissue clearing condition, 1 mm-thick tissues were delipidated for 3-fold of the duration necessary to render the blocks evenly translucent. The delipidated samples were optically cleared and mounted in a manner that prevents any physical compression of the tissue, and autofluorescence and YFP signals of the tissue blocks were imaged. Changes in structural integrity were assessed by calculating the change in ratio between medio-lateral and dorso-ventral lengths of the tissue blocks. Changes in the means of medio-lateral and dorso-ventral lengths were used as a size change of the tissue blocks. Hemispheres in Supplementary video 2 were cleared with the same condition as for the 1mm-thick tissue while the PACT hemisphere was cleared for 6 days and the SHIELD hemisphere was cleared with a SmartClear II Pro (Life Canvas Technologies, MA) at 42°C for 5 d.
Rapid SPIM imaging and automatic atlas alignment.
SHIELD brain hemispheres were imaged using an axially swept66,67 light-sheet microscope (SmartSPIM, Lifecanvas Technologies, MA) equipped with a 2.6x NA 0.2 detection objective (uniform axial resolution ~ 4 μm). Post-processed images were downsampled to 25 × 25 × 25 μm voxel size and automatically aligned to annotated autofluorescence atlas from Allen Brain Institute (version 3)68 by linear- and non-linear image transformation processes.
SHIELD processing of human tissues.
Human brain regions were obtained from the Massachusetts General Hospital brain bank. The 2 mm coronal slabs were incubated in 10% (w/v) P3PE solution in 1X PBS for 2 days at RT, then incubated in 10% (w/v) P3PE in 0.1 M sodium carbonate buffer at pH 10 at 37 °C for 3 hr. Following fixation, human tissue was cleared passively via incubation in the same SDS-based clearing solution (200 mM SDS, pH 9.5) at 80°C until transparent. Optical clearing of human tissues was done with Protos-based immersion medium.
Human tissue staining.
For figure 4c, tissue was stained using lectin 594 and syto16 nuclear dye at 37°C. For antigenicity testing for figure 4, 100μm slices were generated from a piece of human brain tissue by a vibratome, and SHIELD-processed as described above. The tissues were cleared at 37°C for 1 day and thoroughly washed in 1X PBST for 1 d. Antigen retrieval and anti-autofluorescence treatments were performed by incubation in 10 mM sodium citrate buffer at pH 6 with 0.05% (v/v) Tween 20 for 3 hr at 80°C for antigen retrieval, followed by incubation in 50 mM ammonium acetate and 100 mM copper sulfate (CuSO4) solution overnight at RT for reduction of autofluorescence69. After thorough washing in 1X PBST, tissues were incubated with rabbit anti-parvalbumin (ab11427, Abcam, MA), rabbit anti-calretinin (ab702, Abcam, MA), rat anti-MBP (ab7349, Abcam, MA), mouse anti-NFL(846002, Biolegend), chicken anti-GFAP (GFAP, Aves), rabbit anti-NPY (30914, Abcam, MA), rabbit anti-iba1 (019–19741, Wako), rabbit anti-MMP-13 (39012, Abcam, MA), mouse anti-SMI312 (24574, Abcam, MA), rabbit anti-calbindin (ab11426, Abcam, MA), chicken anti-TH (TYH, Aves), or mouse anti-TPH2 (PA1–778, Thermo), in 1X PBST overnight at RT using 1:300 dilution factors for all but NFL (1:150), washed in 1X PBST for 3 hr at RT, and incubated in dye-conjugated secondary antibodies (Abcam, MA) for 3 hr at RT using 1:300 dilution factors. Tissues were then washed in 1X PBST for 3 hr at RT, and mounted in Protos-based immersion medium. Once the tissues were optically cleared, the samples were imaged with Leica confocal microscope using 10X 0.3 NA, 20X 0.5 NA or 25X 0.95 NA water immersion objectives.
For 1 mm-thick human brain tissue used for volumetric immunostaining, a piece of human cortical section (typically 1 cm x 1 cm x 1 mm) was incubated in 10% (w/v) P3PE solution in 1X PBS for 1.5 d at 4°C. The tissue was thermally equilibrated to RT for ~15 min, followed by incubation in 1% (w/v) P3PE in 0.1 M sodium carbonate buffer at pH 10 at 37°C for 1 day for epoxidation. Following fixation, human tissue was briefly washed by 1X PBS for 1 hr at RT, three times. Clearing was passively performed in the SDS clearing solution (200 mM SDS, pH 9.5) at 80°C overnight. Cleared tissue was extensively washed by 1X PBST and the solution was 4–5 times exchanged during the course of the day, followed by overnight incubation. Antigen retrieval was performed as previously described but no CuSO4 treatment was conducted. For antibody staining, a piece of 1 mm-thick tissue was cut with the size of 2 mm x 3 mm x 1 mm. The tissue was subjected to primary antibody staining using mouse anti-GFAP (3670S, CST, PA) and rabbit anti-Calretinin (ab702, Abcam, MA) in 1X PBST at RT for 2 days using 1:50 dilution factor (10 μL antibody solution in 500 μL 1X PBST). Then the tissue was washed with 1X PBST for 1 d with frequent solution exchange, followed by overnight incubation. Secondary antibody staining was performed with Fab fragment dye conjugates with RRX (anti-Rb) and Alexa 647 (anti-Mouse IgG1) from Jackson ImmunoResearch in 1X PBST at RT for 2 days using 1:50 dilution factor. After 1X PBST washing for 1 d, the tissue was immersed in Protos-based immersion medium until optically cleared and imaged by Leica confocal microscope with a 25X 1.0 NA CLARITY objective immersed in RI-matching oil (RI=1.458). Z-step size = 3 μm. Image area = 443.29 μm x 443. 29 μm x 1017 μm.
Biopsy sample processing.
Fresh mouse brains were dissected and placed in ice-cold 1X PBS before core needle-biopsy samples were prepared by piercing using an 18G blunt needle with a sharpened tip. Biopsies were incubated for 45 min in PFA (4% (w/v) PFA in 1X PBS), or in SHIELD perfusion solution, followed by 0.1 M sodium carbonate buffer at pH 10 for 30 min. All solutions were pre-warmed and maintained at 37°C during incubation. For tumor biopsy sampling, mouse kidney tissue harboring breast cancer metastasis was used. Human breast cancer cell line MDAMB231 was inoculated into immunodeficient NSG mice via left ventricle injection. Five weeks after injection, animals were sacrificed and perfused with ice-cold PBS, followed by 4% ice-cold PFA. Organs harboring metastasis were collected and put into long-term storage in 4% PFA in 1X PBS at RT. SHIELD processing was performed in the same manner described above except that PFA was not included in the SHIELD perfusion solution since the kidney had been curated (>1 month) in 4% PFA in 1X PBS at RT. 1 mm-square pole biopsies were prepared from a mouse kidney using a vibratome and a surgical knife.
Rapid clearing and staining of biopsy samples.
Rapid clearing of fixed biopsy tissues was achieved with a modified SmartClear II pro (Life Canvas Technologies) with an external 300 W electrophoresis PowerPac HC power supply from BioRad to apply higher voltage (250V). In order to maintain the temperature below 70°C, all insulation material in SmartClear II pro was removed and the device was operated in a cold room at 4°C. Operational parameters for the SmartClear device were 4~6 V/mm for electric field strength, 0.1 rpm for electric field rotation frequency, and 70°C for clearing temperature. 3% (w/v) SDS buffer titrated to 9.5 pH was used as the clearing buffer. The cleared biopsy tissues were stained using a custom device (Kim, PNAS, 2015). Operational parameters were 8~10 V/mm for electric field strength, 0.1 rpm for electric field rotation frequency, and 30°C for staining temperature. 20 mM Tris buffer titrated to pH 7.5 with 20% (w/v) D-sorbitol and 1% (w/v) BSA was used as the staining buffer. The samples were stained for 1 hr with 5 μL of 10X concentrated lectin-594(DL-1177, Vector laboratories, CA) and 15 μL of rabbit anti-histone-H3 antibody (12230S, Cell Signaling Technology, MA) in 4 mL of staining buffer. 20 μL of anti-Ki-67 antibody (11882S, Cell Signaling Technology, MA) was used for labeling mouse kidney biopsy tissue.
SHIELD-MAP tissue processing protocol.
SHIELD-processed mouse brain tissues were cleared with 300mM SDS clearing buffer (pH 9.0) for 10 d at 37 °C (for 1mm-thick block) or at 45 °C (for 3mm-thick block or hemisphere) while shaking, then washed overnight at RT with 1X PBS containing 1% (v/v) Triton-X100 and then with 1X PBS. If necessary, cleared tissue was cut with a vibratome (VT1000S, Leica Biosystems). The tissue was then incubated in 4°C monomer solution (30% [w/v] acrylamide [Sigma A3553], 0.1% [w/v] Bis-acrylamide [2% Bis solution, Biorad], 10% [w/v] sodium acrylate [Sigma-Aldrich 408220–100G], and 0.03% [w/v] VA-044 [Wako]) in 1X PBS. Monomer solution incubation was done for more than 8 hr for 200 μm-thick sections, >1 day for 1 mm-thick blocks, or >2 days for 3 mm-thick or larger tissues. We purchased multiple bottles of sodium acrylate, made 38% (w/v) solutions in DI water, and checked their colors. The sodium acrylate bottles exhibiting the least yellow color in 38% (w/v) solutions was used to make the monomer solution. The monomer solution was centrifuged at 7830 rpm for 15 min at 4°C and only the supernatant was used. Alternatively, the monomer solution is made without adding VA-044 and placed at 4°C for more than 3 days, and the supernatant was used after adding VA-044. After the monomer solution incubation, the tissue was placed between slide glasses sealed with BluTack (Bostik) to be immersed in the monomer solution. MAP gel embedding was performed under nitrogen gas purge (10 psi) at 33°C for 4 hr. Care was taken not to trap any air bubbles inside the tissue and surrounding monomer solution. After gelation, gel formed outside of the tissue was carefully removed and the tissue was rehydrated in 1X PBS for several hours before it was placed into DI water for tissue expansion. Expansion ratio was quantified by comparing tissue thickness before and after expansion.
SHIELD-MAP validation - Fluorescence retention.
To quantify tissue fluorescence preservation during MAP processing without being affected by mouse-to-mouse and cell-to-cell fluorescent transgene variability, Thy-1 H+YFP mice littermates were perfused with PFA or SHIELD perfusion solution (N=3 mice for PFA and N=4 mice for SHIELD) and processed according to their respective protocols (see ‘PFA, CLARITY, GA-SWITCH, PACT, and iDISCO+ processing’, and ‘SHIELD whole organ processing protocol’ sections). After post-fixation and washing in 1X PBS with 0.02% sodium azide, 200 μm-thick sections were made with a vibratome and their surfaces were imaged to assess the initial YFP fluorescence of selected set of cells in cerebral cortices from two different brain coordinates. Both PFA and SHIELD tissues were subjected to the same delipidation condition (37°C 5d, 300mM SDS solution) then MAP-processed for expansion. Afterwards, the same set of previously imaged cells were imaged again. Total fluorescence inside the set of cells before and after MAP processing were used to calculate fluorescence retention.
SHIELD-MAP validation - Distortion analysis on SHIELD-MAP tissue.
For the analysis of tissue distortion by SHIELD-MAP processing, we utilized the previously established experimental protocol and algorithm28. 200 μm-thick SHIELD mouse brain tissue expressing EGFP was imaged after incubation in Protos-based immersion medium. Special care was taken to mount the sample without any stretching or compression. After unmounting and washing in 1X PBS, the imaged tissue was MAP-processed and then expanded in DI water. The same region of the tissue was imaged again with the same microscope and objective lens (20X 1.0 NA). Neuronal structures expressing EGFP were used as 3D geometrical markers to perform distortion analysis.
Semi-automatic spine segmentation was performed on images acquired from the expanded SHIELD-MAP tissue with a 40X 1.25 NA lens (79 nm x 79 nm pixel size for the expanded sample corresponding to a 26 nm x 26 nm pixel size for the pre-expansion sample) or a 25X 0.95 NA lens (63 nm x 63 nm pixel size post-expansion corresponding to 21 nm x 21 nm pixel size pre-expansion) using Imaris software (Bitplane).
Integrated circuit mapping.
PV-Cre mice (Jackson ImmunoResearch Laboratories, stock number 008069) and AAV-FLEX-mRuby2-Synaptophysin-EGFP injection were used to target PV+ neurons in the right hemisphere globus pallidus externa (GPe; −0.15 mm + 2.1 mm, +3.4 mm in the AP, ML, and DV axes). Three weeks after virus injection, mice were sacrificed and their brains were SHIELD-processed. After the SHIELD-ON step, the brains were washed in 1X PBST and then sectioned to make a 1 mm-thick sagittal block harboring most of the GPe, subthalamic nucleus (STN), and substantia nigra reticulata (SNr) (1.04 mm~2.04 mm in the ML axis from the bregma).
After clearing, the tissue block was stained with FISH probes targeting GAD1 as described above in the FISH experimental section. Hybridization was conducted for 2 days at 37°C followed by stringent washing with 2X SSCT, 50% (v/v) formamide for 1 hr at RT 3 times each, 2X SSCT, 30% (v/v) formamide overnight at RT, and 2X SSCT at RT for 1 hr 3 times each. HCR was performed for 2 days using the B1-Cy5 hairpin at 240 nM, and washing was performed for 1 d using 2X SSCT. All samples were imaged after incubation in Protos-based immersion medium at RT. The entire GPe-STN-SNr circuitry within the tissue block was imaged using a confocal microscope. GAD1-FISH HCR signal was destained by DNaseI treatment (4716728001, Roche; 20:2000 in 1X PBS at RT for 12 hr). The sample was then stained with rabbit anti-calretinin antibody (ab702, Abcam, MA) and imaged using the confocal microscope. The tissue was further MAP-processed for super-resolution imaging. After the 3-fold linear expansion in DI water, a light-sheet microscope (SmartSPIM, Lifecanvas Technologies, MA) with a 10X 0.6 NA objective were used to image the sample.
Total of three 3D datasets were generated from the same sample. Confocal imaging of the tissue after GAD1-mRNA FISH resulted in 7.3GB Imaris file. Subsequent confocal imaging in the tissue after calretinin immunostaining generated 6GB Imaris file. Light-sheet microscope imaging of the SHIELD-MAP expanded tissue resulted in 2.1TB of tiff files, which was 2X downsampled before stitching to produce a 158GB Imaris file. The latter Imaris file was used to reconstruct axon arborization of a single GPe-PV+ neuron with its putative axosomatic connections in multiple brain areas. Processing of the 3D images was done in PC with Intel i7 3.4GHz processor, 128 GB RAM, and a graphic card with 4 GB memory.
Axon tracing was conducted via rigorous review of the volumetric data utilizing Imaris software (Bitplane). A PV-mRuby+ neuron was chosen and its axon was traced semi-automatically with the help of Imaris software’s filament tracer (using its ‘autodepth’ or ‘manual’ mode). Tracing accuracy was continuously assessed by examining the data from multiple angles of view and multiple optical planes. In the event of any ambiguity, raw image volumes were utilized to confirm the accuracy of axonal tracing. For especially dense areas that needed even further confirmation (e.g. axon ramification near target neuronal soma), the tissue area in question was imaged via a confocal microscope with 25X 0.95 NA objective lens after full tissue expansion. The entire trace of the neuron was confirmed by at least two individuals. The confocal microscope and the 25X 0.95 NA objective were used to image areas with putative axosomatic connectivity. The pre-expansion voxel size was 30 nm in the x and y axes and 0.333 μm in the z axis.
The confocal image volumes for regions of interest were used to resolve axon ramification and Syp-EGFP+ presynaptic boutons in the putative axosomatic connections of downstream neurons.
To count GAD1+/Syp-EGFP + neurons in the SNr of this sample, multiple optical sections with a fixed interval (100 μm) were unbiasedly selected from the image volume and then all neurons in the SNr area were counted. mRuby2+ neurons were counted from the entire volume of GPe.
Attenuation coefficient.
Light attenuation by PFA and P3PE-processed samples were quantified with a method based on previous paper70. Briefly, 100μm-thick PFA and P3PE-processed tissue section were imaged with transmitted fluorescence light microscope (EVOS FL, ThermoFisher). The intensity of transmitted light through the samples was measured by calculating mean intensity of the cerebral cortical layer 2–5 part of the image to calculate attenuation coefficient based on Beer-Lambert law
where I is the intensity of the light transmitted through the sample, I0is the light reached the detector without sample on its light path,μ is attenuation coefficient, and L is the thickness of the sample.
Refractive index measurement.
PFA-fixed human brain tissue stored in 1X PBS with 0.02% sodium azide was cut in two and one half was P3PE-fixed by incubating in 10% (w/v) P3PE in PBS at 4°C for 24 hr, then in pH10 0.1M carbonate buffer at 37°C for 24 hr. After washing in 1X PBS with 0.02% sodium azide, the PFA-fixed half and further P3PE-fixed half were completely dried and their refractive indices at 437.2nm, 487.7nm, and 589.3nm were measured with a refractometer (Abbermat WR-MW, Anton paar).
Statistics and reproducibility.
All the statistical tests have been performed by Graphpad Prism 6. n values, type of replicate, and results of the statistical tests are indicated in main text or figure legends. Here is the information on the reproducibility of representative results shown in figures and supplementary figures. In Figure 1, data in j, k, and m were repeated two more times with similar results, and data in l was repeated one time with a similar result. In Figure 2, experiments in a-c, i, and m were repeated 3 times independently to make graph d, j, and n, respectively. Data in f and g were confirmed in 2 independent experiments with similar results. An experiment for panel k and l was done once. Data in o and p-q was reproduced in 2 and 3 independent experiments with similar results. In Figure 3, data in a-b, and e were confirmed in 4 and 3 independent experiments to produce bar graph in c-d and f, respectively. Results in g was confirmed in 7 independent experiments with similar results. In Figure 4, data in panel d-f were confirmed at least in 2 independent experiments with similar results. Experiments of panel g-i were repeated 3 times with similar results. Experiments in panel a-c were done once. In Figure 5, experiments in b-d, f, j, and m-n were repeated in 3, 10, 2, and 2 independent trials with similar results. Experiments of e and j were done twice in total with similar results. Experiments of panel o were done once. The result of h were repeated in 4 different independent experiments to make graph in panel i. In Figure 6, experiments in b-c, and e were repeated independently 4 times with similar result. Data in g-i was repeated in 10 other cells with similar results. In Supplementary figure 1, experiments of b-e were repeated independently 2 times with similar results. In Supplementary figure 2, experiments in e were done at least in 2 independent experimental trials and provided similar results. An experiment of panel d was done once. The results of panel f and g were done in 3 and 4 independent experiments to generate bar graphs in figure 2j and Supplementary figure 2h, respectively. In Supplementary figure 3, experiments in a-c, d, e, and f-h were done in 10, 3, 10, and 3 independent trials, respectively, with similar results. Experiments in panel j were repeated 3 times independently to make a bar graph in panel i. In Supplementary figure 4, Data in panel a-b were confirmed at least in one more of independent experiment with similar result. In Supplementary figure 5, data in panel c were confirmed in more than 10 independent experiments with similar result. Experiments in panel d were repeated three times with similar results. The experiment of panel e was done once.
Life Sciences Reporting Summary.
Further information on experimental design, statistical methods, software, and materials is available in the Life Sciences Reporting Summary.
Supplementary Material
Supplementary Figure 1. Mass spectrometry characterization of epoxide reactions. (a) Degree of amine reactivity of bovine serum albumin (BSA) with epoxide molecules having different numbers of epoxide groups: 1 (GME), 2 (EGDGE, 1,4-BDE, DGDE), 3 (TGE), 4 (PEGE), 5 (P3PE) and with paraformaldehyde (PFA) and glutaraldehyde (GA). N=3 independent experiments. Mean +/− standard error mean was used for this bar graph. (b-c) MALDI-TOF spectra of BSA (b) or GFP (c) reacted with GME and P3PE. Corresponding mass shifts indicate a total of ~92 GME or ~45 P3PE molecules crosslinked with BSA, implying that single covalently attached P3PE molecules bridges ~2 epoxide-reactive residues (b). A similar calculation shows that roughly 1.5 available epoxide-reactive GFP side-chains are bridged by P3PE (c). Mass peak values are indicated as numbers in kDa. (d, e) DNA oligos reacted with epoxides at the reaction conditions used for tissue processing (pH 10, 0.1 M sodium carbonate buffer). MALDI-TOF spectra of (dA)15 (d) and (dC)15 oligos (e) show mass shifts associated respectively with multiple GME or P3PE epoxide crosslinks, respectively. Peak broadening was observed for P3PE crosslinked oligos indicating the formation of abundant salt adducts with polydisperse P3PE.
Supplementary Figure 2. Preservation of endogenous proteins and their probe-binding affinities in SHIELD tissues. (a) Venn diagram of antigenicity test results. All 53 tested antibodies compatible with PFA-fixed control tissue worked in SHIELD tissue. (b) Protein loss assay in the high-temperature tissue clearing condition (200 mM SDS, 70°C, 12 hr). N = 3 tissues. (c, d) FP preservation in SHIELD-processed tissues after multiple rounds of staining and destaining. (c) Endogenous YFP signal retention of PFA and SHIELD tissues after destaining treatments corresponding to 5 rounds of stainings. N=4 tissues. (d) Multiround staining images from the hippocampal region. Break lines indicate destaining steps. For the second round, secondary antibodies were added to confirm complete unbinding of the primary antibodies imaged at the first round. Thy1-H+ YFP mouse SHIELD tissue was used. Scale bars = 100 μm (e) Representative 21 immunofluorescence images in PFA, GA, and SHIELD-processed tissues. Scale bar = 100 μm. The same imaging and display settings were used for each antibody. (f) The contrast-adjusted reproduction of Figure 2i. The selected images were adjusted for better visual comparison. Scale bar = 20 μm (g) Representative images comparing the immunofluorescence of MBP and NF-H in uncleared PFA, GA, and SHIELD tissues. To exclude the effect of tissue clearing on antigenicity, uncleared sections were used. Scale bar = 20 μm. MBP, myelin basic protein; NF-H, neurofilament-H. (h) SHIELD maintained a SNR of MBP and NF-H immunofluorescences similar to that of the PFA-control in immunohistochemistry, indicating minimal epitope damage by P3PE crosslinking. N = 4 tissues. Unpaired T-test, *P < 0.05. Mean +/− standard error mean was used for all the bar graphs.
Supplementary Figure 3. Detection of transcripts in SHIELD-tissue by fluorescence in situ hybridization-hybridization chain reaction (FISH-HCR) with various probe designs. YFP and cell-type markers were targeted. (a-c) FISH-HCR with 18 nt (a-b) and 50 nt (c) probes for YFP mRNA. The endogenous YFP fluorescence signal was well co-localized with FISH Cy5 signals in individual cells. (d-h) FISH-HCR on mRNA transcripts of cell-type marker proteins and their corresponding ISH images from the Allen brain atlas (© 2015 Allen Institute for Brain Science. Allen Brain Atlas API. Available from: brain-map.org/api/index.html). (d, e) FISH-HCR for glutamate decarboxylase (GAD1, an inhibitory neuronal marker) using 22nt (d) and 35nt (e) probes. (f) Somatostatin (SST), (g) neuropeptide Y (NPY), and (h) vesicular glutamate transporter (vGluT2, an excitatory neuronal marker) mRNAs were successfully detected by FISH-HCR in cleared SHIELD-tissue. Scale bar = 1 mm. (i, j) GFP signal was preserved better in SHIELD tissue than in tissues processed with EDC (1-ethyl-3-(3-dimethylaminopropyl) carbodiimide hydrochloride) after clearing. (i) Bar graph. Unpaired T-test, **P<0.01. N=3 tissues. (j) Representative images. Scale bar = 1 mm. Mean +/− standard error mean is used for this graph.
Supplementary Figure 4. Structural integrity of SHIELD tissue. (a-b) Autofluorescence (a) and YFP (b) images of 1mm-thick tissues from different anatomical coordinates of mouse brain hemisphere before and after clearing, and after additional 70°C destaining step (300mM SDS, 2 hr). Images that were not included in Figure 3a are presented here. The contour of the uncleared sections are marked with yellow dotted lines in subsequent images. In YFP images, numbers on the top right corners indicate the intensity gain from image display range. PACT images after 70°C destaining step are not included because the tissues melted. Scale bars = 1 mm.
Supplementary Figure 5. Whole organ processing and clearing with SHIELD. (a) SWITCH chemistry in SHIELD processing. Epoxy-amine reactivity at 37°C pH 10 condition (SWITCH-ON) was 10-fold higher than reactivity at 4°C pH 7.4 condition (SWITCH-OFF). Unpaired T-test, *P < 0.05, N = 3 independent experiments. Mean +/− standard error mean is used for this bar graph. (b) Schematic diagram of whole organ SHIELD processing using SWITCH chemistry. The initial incubation of tissue in the SWITCH-OFF condition ensures complete and homogeneous distribution of epoxide molecules across the tissue volume. Subsequent SWITCH-ON condition initiates synchronized crosslinking throughout the tissue volume. (c) Comparison of SHIELD tissue processed with (right) or without SWITCH (left). Note that the control sample shows opaque tissue layer at its surface even after clearing, suggesting overfixation at the tissue surface. SHIELD tissue fixed with SWITCH chemistry is uniformly transparent throughout its volume after clearing. Grid = 1 mm. (d) SHIELD-processed mouse organs before (left panels) and after clearing (right panels). Grid = 1 mm. (e) 3D visualization of an intestine of ChAT-EGFP transgenic mouse showing processes of ChAT+ motor neurons innervating the intestine. Scale bars = 1 mm (left, lower right), 50 μm (upper right).
ACKNOWLEDGEMENTS
The authors thank the entire Chung laboratory for support and helpful discussions. We acknowledge Steven Speck, Andison Tran, Julien Senecal, Webster Guan, and Lee Kamentsky for their contribution to image processing and data analysis. K.C. was supported by the Burroughs Wellcome Fund Career Awards at the Scientific Interface, Searle Scholars Program, Packard award in Science and Engineering, NARSAD Young Investigator Award, McKnight Foundation Technology Award, JPB Foundation (PIIF and PNDRF), NCSOFT Cultural Foundation, and NIH (1-DP2-ES027992). R.C was supported by a SCSB fellowship. B.K.L was supported by Klingenstein foundation, Searle scholar program (Kinship foundation), Whitehall foundation, NARSAD young investigator award and grants from NIMH (R01MH107742, R01MH108594, U01MH114829). V. L is supported by Anandamahidol Foundation Fellowship. M.P.F. was partially supported by NIA P50 AG005134. H.J.K. holds a Career Award at the Scientific Interface from the Burroughs Wellcome Fund, which supported the work. H.W.Q. was supported in part by a Department of Energy Computational Science Graduate Fellowship (DOE-CSGF). This work was carried out in part using computational resources from the Extreme Science and Engineering Discovery Environment (XSEDE), which is supported by National Science Foundation grant number ACI-1548562. This work used the XStream computational resource, supported by the National Science Foundation Major Research Instrumentation program (ACI-1429830). S.-C.C. and J.W. were supported by HKSAR Research Grants Council (RGC) General Research Fund (GRF), #14201214. Resources that may help enable general users to establish the methodology are freely available online (http://www.chunglabresources.org). K.C. is a co-founder of LifeCanvas Technologies, a startup that aims to help the research community adopt technologies developed by the Chung Laboratory.
Footnotes
Data availability.
The data supporting the findings of this study are available from the corresponding author upon request.
Code availability.
The custom codes used in this study are available from the corresponding author upon request.
COMPETING INTERESTS
K.C. is a co-inventor on patent application owned by MIT covering the SHIELD and SWITCH technology ( PCT/US2016/064538 ).
References.
- 1.Masland RH Neuronal cell types. Current Biology 14, R497–R500 (2004). [DOI] [PubMed] [Google Scholar]
- 2.Kepecs A & Fishell G Interneuron cell types are fit to function. Nature 505, 318–326 (2014). [DOI] [PMC free article] [PubMed] [Google Scholar]
- 3.Alivisatos AP et al. The brain activity map. Science 339, 1284–1285 (2013). [DOI] [PMC free article] [PubMed] [Google Scholar]
- 4.DeFelipe J From the connectome to the synaptome: an epic love story. Science 330, 1198–1201 (2010). [DOI] [PubMed] [Google Scholar]
- 5.Zingg B et al. Neural networks of the mouse neocortex. Cell 156, 1096–1111 (2014). [DOI] [PMC free article] [PubMed] [Google Scholar]
- 6.Kasthuri N et al. Saturated Reconstruction of a Volume of Neocortex. Cell 162, 648–661 (2015). [DOI] [PubMed] [Google Scholar]
- 7.Crosetto N, Bienko M & Van Oudenaarden A Spatially resolved transcriptomics and beyond. Nature Reviews Genetics 16, 57–66 (2015). [DOI] [PubMed] [Google Scholar]
- 8.Shah S, Lubeck E, Zhou W & Cai L In Situ Transcription Profiling of Single Cells Reveals Spatial Organization of Cells in the Mouse Hippocampus. Neuron 92, 342–357 (2016). [DOI] [PMC free article] [PubMed] [Google Scholar]
- 9.Giesen C et al. Highly multiplexed imaging of tumor tissues with subcellular resolution by mass cytometry. Nat Meth 11, 417–422 (2014). [DOI] [PubMed] [Google Scholar]
- 10.Chung K et al. Structural and molecular interrogation of intact biological systems. Nature 497, 332–337 (2013). [DOI] [PMC free article] [PubMed] [Google Scholar]
- 11.Susaki EA & Ueda HR Whole-body and Whole-Organ Clearing and Imaging Techniques with Single-Cell Resolution: Toward Organism-Level Systems Biology in Mammals. Cell Chemical Biology (2016). [DOI] [PubMed] [Google Scholar]
- 12.Sylwestrak EL, Rajasethupathy P, Wright MA, Jaffe A & Deisseroth K Multiplexed Intact-Tissue Transcriptional Analysis at Cellular Resolution. Cell 164, 792–804 (2016). [DOI] [PMC free article] [PubMed] [Google Scholar]
- 13.Ku T et al. Multiplexed and scalable super-resolution imaging of three-dimensional protein localization in size-adjustable tissues. Nat. Biotechnol. 34, 973–981 (2016). [DOI] [PMC free article] [PubMed] [Google Scholar]
- 14.Murray E et al. Simple, Scalable Proteomic Imaging for High-Dimensional Profiling of Intact Systems. Cell 163, 1500–1514 (2015). [DOI] [PMC free article] [PubMed] [Google Scholar]
- 15.Renier N et al. iDISCO: a simple, rapid method to immunolabel large tissue samples for volume imaging. Cell 159, 896–910 (2014). [DOI] [PubMed] [Google Scholar]
- 16.Pan C et al. Shrinkage-mediated imaging of entire organs and organisms using uDISCO. Nat Meth 13, 859–867 (2016). [DOI] [PubMed] [Google Scholar]
- 17.Tainaka K, Kuno A, Kubota SI, Murakami T & Ueda HR Chemical Principles in Tissue Clearing and Staining Protocols for Whole-Body Cell Profiling. 10.1146/annurev-cellbio-111315-125001 32, annurev–cellbio–111315–125001 (2015). [DOI] [PubMed] [Google Scholar]
- 18.Ertürk A et al. Three-dimensional imaging of solvent-cleared organs using 3DISCO. Nat Protoc 7, 1983–1995 (2012). [DOI] [PubMed] [Google Scholar]
- 19.Chen F, Tillberg PW & Boyden ES Expansion microscopy. Science 347, 543–548 (2015). [DOI] [PMC free article] [PubMed] [Google Scholar]
- 20.Vincek V, Nassiri M, Nadji M & Morales AR A tissue fixative that protects macromolecules (DNA, RNA, and protein) and histomorphology in clinical samples. Lab. Invest. 83, 1427–1435 (2003). [DOI] [PubMed] [Google Scholar]
- 21.Pelegri-Oday EM, Lin EW & Maynard HD Therapeutic protein-polymer conjugates: Advancing beyond pegylation. J. Am. Chem. Soc. 136, 14323–14332 (2014). [DOI] [PubMed] [Google Scholar]
- 22.Kabanov AV & Vinogradov SV Nanogels as pharmaceutical carriers: Finite networks of infinite capabilities. Angewandte Chemie International Edition 48, 5418–5429 (2009). [DOI] [PMC free article] [PubMed] [Google Scholar]
- 23.Sheldon RA & van Pelt S Enzyme immobilisation in biocatalysis: Why, what and how. Chem Soc Rev 42, 6223–6235 (2013). [DOI] [PubMed] [Google Scholar]
- 24.Hartmann M Ordered Mesoporous Materials for Bioadsorption and Biocatalysis. Chemistry of Materials 17, 4577–4593 (2005). [Google Scholar]
- 25.Mateo C et al. Some special features of glyoxyl supports to immobilize proteins. Enzyme Microb. Technol. 37, 456–462 (2005). [Google Scholar]
- 26.Migneault I, Dartiguenave C, Bertrand MJ & Waldron KC Glutaraldehyde: Behavior in aqueous solution, reaction with proteins, and application to enzyme crosslinking. BioTechniques 37, 790–802 (2004). [DOI] [PubMed] [Google Scholar]
- 27.Tsien RY THE GREEN FLUORESCENT PROTEIN. Annual Review of Biochemistry 67, 509–544 (1998). [DOI] [PubMed] [Google Scholar]
- 28.Kim S-Y et al. Stochastic electrotransport selectively enhances the transport of highly electromobile molecules. PNAS 112, E6274–E6283 (2015). [DOI] [PMC free article] [PubMed] [Google Scholar]
- 29.Tsien R Fluorescent Probes Of Cell Signaling. Annu. Rev. Neurosci. 12, 227–253 (1989). [DOI] [PubMed] [Google Scholar]
- 30.Back JF, Oakenfull D & Smith MB Increased Thermal Stability of Proteins in the Presence of Sugars and Polyols. Biochemistry 18, 5191–5196 (1979). [DOI] [PubMed] [Google Scholar]
- 31.Mason JT & O’Leary TJ Effects of formaldehyde fixation on protein secondary structure: a calorimetric and infrared spectroscopic investigation. J Histochem Cytochem 39, 225–229 (1991). [DOI] [PubMed] [Google Scholar]
- 32.Enoki S, Saeki K, Maki K & Kuwajima K Acid denaturation and refolding of green fluorescent protein. Biochemistry 43, 14238–14248 (2004). [DOI] [PubMed] [Google Scholar]
- 33.Fowler CB, Evers DL, O’Leary TJ & Mason JT Antigen retrieval causes protein unfolding: Evidence for a linear epitope model of recovered immunoreactivity. J Histochem Cytochem 59, 366–381 (2011). [DOI] [PMC free article] [PubMed] [Google Scholar]
- 34.Hama H et al. Scale: a chemical approach for fluorescence imaging and reconstruction of transparent mouse brain. Nat Neurosci 14, 1481–1488 (2011). [DOI] [PubMed] [Google Scholar]
- 35.Hopwood D Theoretical and practical aspects of glutaraldehyde fixation. Histochem. J. 4, 267–303 (1972). [DOI] [PubMed] [Google Scholar]
- 36.Lee K, Choi S, Yang C, Wu H-C & Yu J Autofluorescence generation and elimination: a lesson from glutaraldehyde. Chemical Communications 49, 3028–3030 (2013). [DOI] [PubMed] [Google Scholar]
- 37.Deforce DLD, Ryniers FPK, Van Den Eeckhout EG, Lemière F & Esmans EL Analysis of DNA adducts in DNA hydrolysates by capillary zone electrophoresis and capillary zone electrophoresis-electrospray mass spectrometry. Anal. Chem. 68, 3575–3584 (1996). [DOI] [PubMed] [Google Scholar]
- 38.Pena JTG et al. miRNA in situ hybridization in formaldehyde and EDC–fixed tissues. Nat Meth 6, 139–141 (2009). [DOI] [PMC free article] [PubMed] [Google Scholar]
- 39.Pappa VI et al. Role of image-guided core-needle biopsy in the management of patients with lymphoma. Journal of Clinical Oncology 14, 2427–2430 (2016). [DOI] [PubMed] [Google Scholar]
- 40.Nojima S et al. CUBIC pathology: three-dimensional imaging for pathological diagnosis. Sci Rep 7, 9269 (2017). [DOI] [PMC free article] [PubMed] [Google Scholar]
- 41.Tanaka N et al. Whole-tissue biopsy phenotyping of three-dimensional tumours reveals patterns of cancer heterogeneity. Nat. biomed. eng. 1, 796–806 (2017). [DOI] [PubMed] [Google Scholar]
- 42.Glaser AK et al. Light-sheet microscopy for slide-free non-destructive pathology of large clinical specimens. Nat. biomed. eng 1, 0084–10 (2017). [DOI] [PMC free article] [PubMed] [Google Scholar]
- 43.Tillberg PW et al. Protein-retention expansion microscopy of cells and tissues labeled using standard fluorescent proteins and antibodies. Nat. Biotechnol. 34, 987–992 (2016). [DOI] [PMC free article] [PubMed] [Google Scholar]
- 44.Dumitriu D, Rodriguez A & Morrison JH High-throughput, detailed, cell-specific neuroanatomy of dendritic spines using microinjection and confocal microscopy. Nat Protoc 6, 1391–1411 (2011). [DOI] [PMC free article] [PubMed] [Google Scholar]
- 45.Ke M-T et al. Super-Resolution Mapping of Neuronal Circuitry With an Index-Optimized Clearing Agent. Cell Rep 14, 2718–2732 (2016). [DOI] [PubMed] [Google Scholar]
- 46.Gerfen CR & Wilson CJ in Handbook of Chemical Neuroanatomy 12, 371–468 (Elsevier, 1996). [Google Scholar]
- 47.Obeso JA, Rodriguez-Oroz MC, Stamelou M, Bhatia KP & Burn DJ The expanding universe of disorders of the basal ganglia. Lancet 384, 523–531 (2014). [DOI] [PubMed] [Google Scholar]
- 48.Saunders A, Huang KW & Sabatini BL Globus Pallidus Externus Neurons Expressing parvalbumin Interconnect the Subthalamic Nucleus and Striatal Interneurons. PLoS ONE 11, e0149798 (2016). [DOI] [PMC free article] [PubMed] [Google Scholar]
- 49.Knowland D et al. Distinct Ventral Pallidal Neural Populations Mediate Separate Symptoms of Depression. Cell 170, 284–297.e18 (2017). [DOI] [PMC free article] [PubMed] [Google Scholar]
- 50.Ye L et al. Wiring and Molecular Features of Prefrontal Ensembles Representing Distinct Experiences. Cell 1–32 (2016). doi: 10.1016/j.cell.2016.05.010 [DOI] [PMC free article] [PubMed] [Google Scholar]
- 51.Economo MN et al. A platform for brain-wide imaging and reconstruction of individual neurons. Elife 5, e10566 (2016). [DOI] [PMC free article] [PubMed] [Google Scholar]
- 52.Luo L, Callaway EM & Svoboda K Genetic Dissection of Neural Circuits: A Decade of Progress. Neuron 98, 256–281 (2018). [DOI] [PMC free article] [PubMed] [Google Scholar]
- 53.Chen KH, Boettiger AN, Moffitt JR, Wang S & Zhuang X RNA imaging. Spatially resolved, highly multiplexed RNA profiling in single cells. Science 348, aaa6090–aaa6090 (2015). [DOI] [PMC free article] [PubMed] [Google Scholar]
- 54.Beliveau BJ et al. Single-molecule super-resolution imaging of chromosomes and in situ haplotype visualization using Oligopaint FISH probes. Nat Commun 6, 7147 (2015). [DOI] [PMC free article] [PubMed] [Google Scholar]
- 55.Spurr AR A low-viscosity epoxy resin embedding medium for electron microscopy. Journal of Ultrastructure Research 26, 31–43 (1969). [DOI] [PubMed] [Google Scholar]
- 56.Halgren TA Merck molecular force field. I. Basis, form, scope, parameterization, and performance of MMFF94. Journal of Computational Chemistry 17, 490–519 (1996). [Google Scholar]
- 57.Halgren TA Merck molecular force field. II. MMFF94 van der Waals and electrostatic parameters for intermolecular interactions. Journal of Computational Chemistry 17, 520–552 (1996). [Google Scholar]
- 58.Arpino JAJ, Rizkallah PJ & Jones DD Crystal Structure of Enhanced Green Fluorescent Protein to 1.35 Å Resolution Reveals Alternative Conformations for Glu222. PLoS ONE 7, e47132 (2012). [DOI] [PMC free article] [PubMed] [Google Scholar]
- 59.Ryckaert J-P, Ciccotti G & Berendsen HJC Numerical integration of the cartesian equations of motion of a system with constraints: molecular dynamics of n-alkanes. Journal of Computational Physics 23, 327–341 (1977). [Google Scholar]
- 60.Yang B et al. Single-cell phenotyping within transparent intact tissue through whole-body clearing. Cell 158, 945–958 (2014). [DOI] [PMC free article] [PubMed] [Google Scholar]
- 61.Renier N et al. Mapping of Brain Activity by Automated Volume Analysis of Immediate Early Genes. Cell 165, 1789–1802 (2016). [DOI] [PMC free article] [PubMed] [Google Scholar]
- 62.Choi HMT, Beck VA & Pierce NA Next-Generation in Situ Hybridization Chain Reaction: Higher Gain, Lower Cost, Greater Durability. ACS Nano 8, 4284–4294 (2014). [DOI] [PMC free article] [PubMed] [Google Scholar]
- 63.Chen F et al. Nanoscale imaging of RNA with expansion microscopy. Nat Meth 13, 679–684 (2016). [DOI] [PMC free article] [PubMed] [Google Scholar]
- 64.Shah S et al. Single-molecule RNA detection at depth by hybridization chain reaction and tissue hydrogel embedding and clearing. Development 143, 2862–2867 (2016). [DOI] [PMC free article] [PubMed] [Google Scholar]
- 65.Moffitt JR & Zhuang X RNA Imaging with Multiplexed Error-Robust Fluorescence In Situ Hybridization (MERFISH). Methods in Enzymology 572, 1–49 (2016). [DOI] [PMC free article] [PubMed] [Google Scholar]
- 66.Dean KM, Roudot P, Welf ES, Danuser G & Fiolka R Deconvolution-free Subcellular Imaging with Axially Swept Light Sheet Microscopy. Biophys. J. 108, 2807–2815 (2015). [DOI] [PMC free article] [PubMed] [Google Scholar]
- 67.Hedde PN & Gratton E Selective plane illumination microscopy with a light sheet of uniform thickness formed by an electrically tunable lens. Microscopy Research and Technique 6, 2181 (2016). [DOI] [PMC free article] [PubMed] [Google Scholar]
- 68.Oh SW et al. A mesoscale connectome of the mouse brain. Nature 508, 207–214 (2014). [DOI] [PMC free article] [PubMed] [Google Scholar]
- 69.Schnell SA, Staines WA & Wessendorf MW Reduction of Lipofuscin-like Autofluorescence in Fluorescently Labeled Tissue. J Histochem Cytochem 47, 719–730 (2016). [DOI] [PubMed] [Google Scholar]
- 70.Gómez-Gaviro MV et al. Optimized CUBIC protocol for three-dimensional imaging of chicken embryos at single-cell resolution. Development 144, 2092–2097 (2017). [DOI] [PubMed] [Google Scholar]
Associated Data
This section collects any data citations, data availability statements, or supplementary materials included in this article.