Abstract
Background
Overcoming oxidative stress is a critical step for tumor progression; however, the underlying mechanisms in colorectal cancer (CRC) remain unclear.
Methods
We investigated nicotinamide adenine dinucleotide (phosphate) (NAD(P))-dependent enzyme methylene tetrahydrofolate dehydrogenase 2 (MTHFD2) expression, clinical relevance, redox modification, and molecular mechanisms using the CRC cells and tissues (n = 462 paired samples). The antitumor effects of MTHFD2 inhibitor LY345899 on CRC tumorigenesis and metastasis were evaluated in vitro and in vivo. Data analysis used Kaplan-Meier, Pearson’s correlation, and Student t test where appropriate. All statistical tests were two-sided.
Results
Here, we report that the patients with high expression of MTHFD2 have a shorter overall survival (HR = 1.62, 95% CI = 1.12 to 2.36, P = .01) and disease-free survival (HR = 1.55, 95% CI = 1.07 to 2.27, P = .02) than patients with low MTHFD2 expression. Suppression of MTHFD2 disturbs NADPH and redox homeostasis and accelerates cell death under oxidative stress, such as hypoxia or anchorage independence (P ≤ .01 for all). Also, genetic or pharmacological inhibition of MTHFD2 suppresses CRC cell growth and lung and peritoneal metastasis in cell-based xenografts (n = 5–8 mice per group). Importantly, LY345899 treatment statistically significantly suppresses tumor growth and decreases the tumor weight in CRC patient-derived xenograft models (n = 10 mice per group, mean [SD] tumor weight of the vehicle-treated group was 1.83 [0.19] mg vs 0.74 [0.30] mg for the LY345899-treated group, P < .001)
Conclusions
Our study presents evidence that MTHFD2 confers redox homeostasis and promotes CRC cell growth and metastasis. The folate analog LY345899 as MTHFD2 inhibitor displays therapeutic activity against CRC and warrants further clinical investigation for CRC treatment.
Colorectal cancer (CRC) is the third most common type of cancer and the fourth most common cause of cancer death worldwide (1,2). The high mortality rate of CRC is mainly attributable to its metastasis (1). Growing evidence points to the fundamental roles for metabolic reprogramming in tumorigenesis and metastatic progression (3,4). Our recent studies investigated the roles of NAD metabolism in promoting glycolysis (5,6); however, the regulation of NADP metabolism in CRC remains unclear and attracts our interest.
In cancer cells, overcoming oxidative stress is a critical step for tumor progression (7,8). Thus, elevated reactive oxygen species (ROS) levels are usually counteracted by elevated antioxidant defenses to maintain redox homeostasis (9). Redox homeostasis is dependent on a balance between levels of oxidants and antioxidants (10). The latter are dependent on the generation of NADPH, which is used to maintain reduced glutathione (GSH) (11). The potential NADPH-producing enzymes mainly include glucose-6-phosphate dehydrogenase, malic enzyme 1/2, isocitrate dehydrogenase 1/2, and transhydrogenase and methylene tetrahydrofolate dehydrogenase 1/2 (MTHFD1/2) (12). Under various cellular stresses, such as anchorage-independent growth and hypoxia, cells increase demand for the above-mentioned robust systems to produce NADPH (13). Our recent studies showed that disrupting glucose-6-phosphate dehydrogenase-mediated NADPH homeostasis enhances chemosensitivity (14); however, which pathway predominantly controls NADPH homeostasis in CRC remains unclear.
MTHFD2 is an NAD(P)-dependent enzyme and plays an essential role in mitochondrial one-carbon folate metabolism (15). More recently, studies have shown that MTHFD2 expression is markedly elevated in many cancers and is a novel target for drug development (16–18). Also, MTHFD2 knockout impairs colon cancer xenograft tumor growth (19). Here, we identified that MTHFD2 is the most overexpressed NADPH generation enzyme in CRC. Given that hypoxia or anchorage independence induces ROS generation (20,21), we hypothesized that MTHFD2-mediated NADPH homeostasis may have the capacity to protect cell survival against oxidative stress, resulting in CRC progression.
In the present study, we investigate the clinical relevance, function, and underlying regulatory mechanisms of MTHFD2 in CRC. Also, we test the hypothesis that MTHFD2 is an actionable target for CRC treatment.
Methods
A complete description of the methods can be found in the Supplementary Methods (available online).
Patients and Cells
CRC tissue specimens (n = 462 paired samples) were collected after obtaining written informed consent and in accordance with our Institutional Review Board and the Declaration of Helsinki (Supplementary Table 1, available online). Overall survival was defined as the time from the date of surgery to the date of death from any cause or latest follow-up, whereas disease-free survival was measured from the date of surgery to the date of confirming recurrence or death from any cause, whichever occurred first. The CRC cell lines were purchased from the American Type Culture Collection (Manassas, VA) and cultured under conditions specified by the supplier. The 293 T cell expressing inducible KrasG12V (293T/iKras) was established as described previously (22). All cells were negatively tested for mycoplasma contamination and authenticated based on short tandem repeat fingerprinting before use.
Determination of ROS, GSH/GSSG, and NADPH/NADP+ Levels
The levels of mitochondria and cellular ROS were determined by flow cytometer using CMH2XRos (#M7513) and CM-H2DCF-DA (#C6827) as fluorescent probes (BD Biosciences, San Jose, CA), respectively, as described in previous publications (10,14). The intracellular levels of GSH/oxidized glutathione (GSSG) and NADPH/NADP+ were measured with a GSH/GSSG Assay kit (#V6612) and a NADPH/NADP+ Assay kit (#G9081) (Promega, WI) according to the manufacturer’s instructions.
In Vivo Tumorigenesis and Metastasis Study
All mouse experiments were performed in accordane with a protocol approved by our institutional Animal Care and Use Committee. Female BABL/c nude mice (4–5 weeks old) were obtained from the Animal Center of Guangdong province (Guangzhou, China). For the in vivo tumorigenesis study, CRC cells (2 × 10⁶, in phosphate buffered saline) were subcutaneously injected into the flank of nude mice (5 mice per group). Patient-derived xenografts (PDX) tumor from two patients with liver metastasis were implanted into the flank of mice. When tumors became palpable, the tumor-bearing mice were randomly assigned to two groups (5 mice per group) by random numbers generated by computer and treated with LY345899 for 4 weeks (intraperitoneal [i.p.], 5 d/wk). Tumor size was measured every 4 days using a caliper, and tumor volume was calculated using the standard formula V = length × width2/2. Mice were euthanized when they met the institutional euthanasia criteria for tumor size and overall health condition. The tumors were removed, photographed, and weighed.
To evaluate the effect of MTHFD2 on in vivo metastasis, two xenograft models were used. For tumor lung metastasis, the CRC cells (2 × 10⁶) were injected into the tail vein of two groups of nude mice (8 mice/group). Eight weeks postinjection, the mice were killed and the lung was removed and paraffin embedded and stained with hematoxylin and eosin (H&E). The micrometastases in the lungs were examined and counted under a dissecting microscope. For tumor mesenteric metastasis, the cell or PDX-based tissues were orthotopically implanted into the cecum (8 mice/group). Following treatment with LY345899 for 4 weeks (i.p., 5 d/wk), the mice were killed, the intestines were removed, and the metastatic nodules in the intestines were counted.
Statistical Analysis
For comparison of the statistical differences between two groups, the Student t test was used. Matched groups (three or more) were compared using one-way analysis of variance ANOVA and Tukey’s multiple comparisons test. For correlation analysis between two continuous variables, r’s represent Pearson’s correlation coefficients, and P values were calculated by the Pearson’s correlation test. Survival curves were plotted using the Kaplan–Meier method and compared by log-rank test. The parameters with P less than .05 in univariate analyses were included in the multivariable Cox analysis. Statistical analyses were performed with GraphPad version 6.0. A P less than .05 was considered statistically significant. All statistical tests were two-sided.
Results
The Expression and Clinical Significance of MTHFD2 in CRC
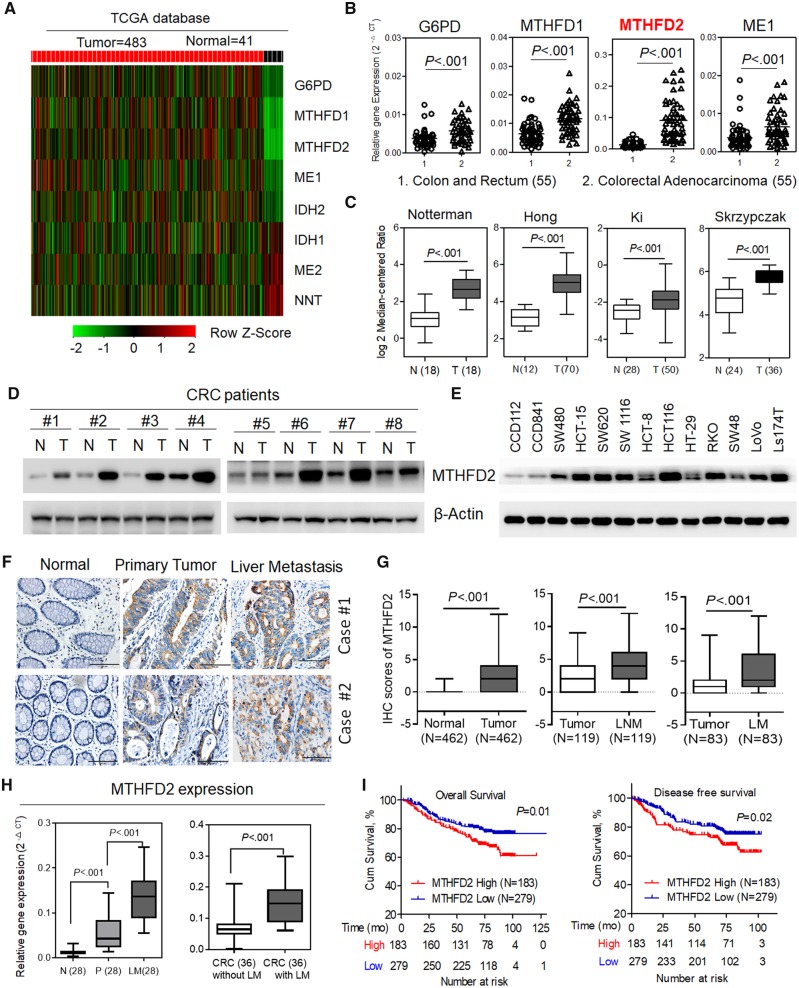
The regulation of redox homeostasis in cancer cells is required for NADPH homeostasis (13). To systematically determine the pathway that predominantly controls NADPH homeostasis in CRC, we first searched The Cancer Genome Atlas database and conducted quantitative polymerase chain reaction (qPCR) analysis. The analyses revealed that several enzymes, including glucose-6-phosphate dehydrogenase, malic enzyme 1, and MTHFD1/2, were overexpressed in tumor tissues vs matched normal tissues (P < .001) (Figure 1A and B; Supplementary Figure 1A, available online). Furthermore, the overexpression of MTHFD2 in CRC or other tumors was also supported by Oncomine and The Cancer Genome Atlas database (Figure 1C; Supplementary Figure 1B, available online). Immunoblotting analysis showed that MTHFD2 protein level was notably increased in representative CRC tissues and CRC cells (Figure 1, D and E). Also, these CRC cells exhibited an increase in ROS level accompanied by increased GSH/GSSG and NADPH/NADP+ ratios (P = .04, P = .009, and P = .002, respectively) (Supplementary Figure 1C, available online). The comprehensive consideration of the statistical significance and the expression difference made MTHFD2 an attractive target for further exploration.
Figure 1.
The expression and clinical significance of methylene tetrahydrofolate dehydrogenase 2 (MTHFD2) in colorectal cancer (CRC). A) Expression profiling of various potential nicotinamide adenine dinucleotide phosphate (NADPH)-producing enzymes in The Cancer Genome Atlas (TCGA) CRC database. B) Quantitative polymerase chain reaction (qPCR) analysis of the indicated gene expression in 55 paired CRC tissues. C) MTHFD2 expression in multiple CRC microarray data sets is available from the Oncomine database. D and E) Immunoblotting analysis of MTHFD2 protein levels in paired CRC tissues, CRC cells, and colorectal epithelial cells (CCD112, CCD841). F) Representative immunohistochemical staining showing positive staining in primary CRC tumor tissues and paired liver metastatic tissues (scale bar = 100 µm). G) The immunohistochemical staining scores of MTHFD2 in paired primary CRC tumor tissues (N = 462), lymph node metastatic tissues (LNM, N = 119), or liver metastatic tissues (LM, N = 83). H) qPCR analysis of MTHFD2 expression in 28 paired liver metastatic tissues and 72 CRC tissues with or without liver metastasis. I) Kaplan–Meier analysis of 5-year overall survival or disease-free survival for CRC patients with low vs high expression of MTHFD2 (Kaplan–Meier analysis with the log-rank test). β-Actin was included as a loading control. Data in C, G, and H are presented as a box-and-whiskers graph (min-max), and the horizontal line across each box indicates the median. All statistical analyses were performed using Student paired t test. All statistical tests were two-sided. ME1 = malic enzyme 1; G6PD = glucose-6-phosphate dehydrogenase; MTHFD1/2 = methylene tetrahydrofolate dehydrogenase 1/2; N = adjacent normal tissues; T = tumor.
Consistently, MTHFD2 expression levels were notably increased in liver and lymph node metastasis tissues compared with paired primary tissues analyzed using tissue microarray (P < .001 for both) (Figure 1, F and G). PCR analysis also confirmed the highly expressed MTHFD2 in CRC liver metastatic tissues or CRC tissue with liver metastasis (P < .001 for both) (Figure 1H). These results indicate that increased MTHFD2 expression may promote CRC tumorigenesis and metastasis. Strikingly, Kaplan–Meier survival analysis indicated that patients with high MTHFD2 expression levels have a shorter overall survival (HR = 1.62, 95% CI = 1.12 to 2.36, P = .01) and disease-free survival (HR = 1.55, 95% CI = 1.07 to 2.27, P = .02). (Figure 1I). Multivariable analysis also indicated that the MTHFD2 expression was an independent prognostic factor in CRC patients (HR = 1.55, 95% CI = 1.07 to 2.23, P = .02, Supplementary Table 2, available online), suggesting that MTHFD2 is a potential prognostic biomarker.
Effects of MTHFD2 Inhibition on NADPH Homeostasis and CRC Cell Survival During Hypoxia
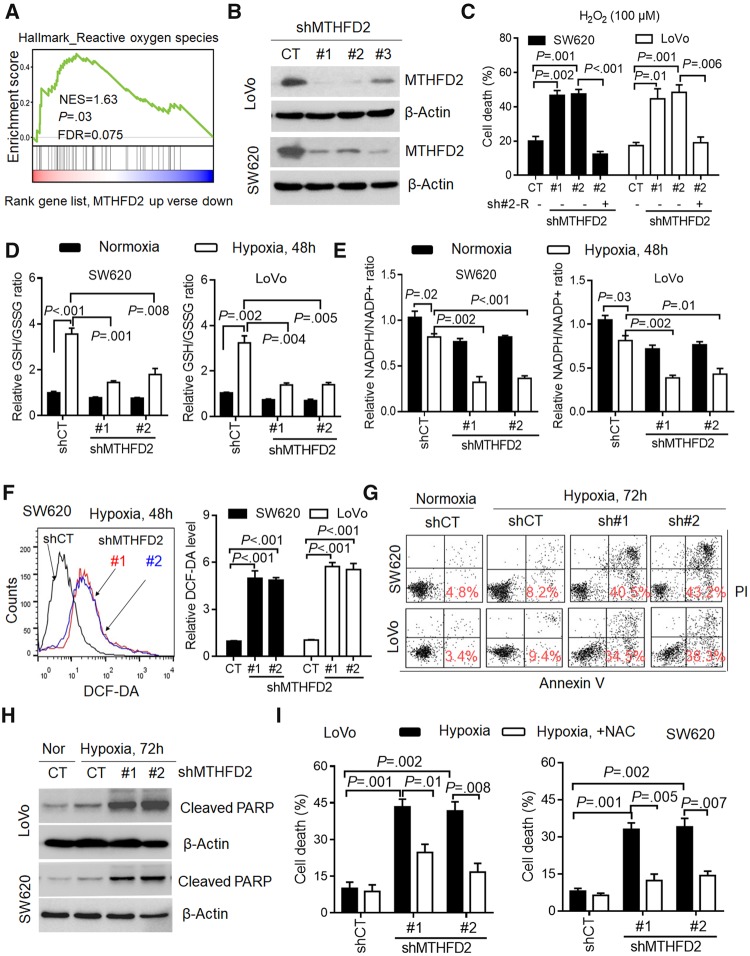
Gene set enrichment (GSEA) analysis revealed that the signature of ROS-related genes is enriched in tumors with high expression of MTHFD2 (normalized enrichment score = 1.63, P = .03) (Figure 2A), indicating its critical role for redox homeostasis. Indeed, MTHFD2 knockdown caused obvious decreases in cellular NADPH/NADP+ and GSH/GSSG ratios in detected CRC cells (P ≤ .01 for all), which could be rescued with siRNA resistance plasmid (Supplementary Figure 2, A and B, available online). Then, we stably knocked down MTHFD2 (Figure 2B), and found that MTHFD2 suppression disturbed redox homeostasis and increased cell death in CRC cells subjected to hydrogen peroxide (P ≤ .01 for all) (Supplementary Figure 2, C and D, available online, Figure 2C). These findings demonstrate that MTHFD2 plays an essential role in maintaining NADPH homeostasis in CRC.
Figure 2.
Effects of methylene tetrahydrofolate dehydrogenase 2 (MTHFD2) inhibition on colorectal cancer (CRC) cell survival during hypoxia. A) Gene set enrichment analysis revealed that the MTHFD2 expression is positively correlated with reactive oxygen species (ROS)-related gene signature available from The Cancer Genome Atlas CRC database. B) Immunoblotting evaluating the knockdown efficiency of MTHFD2 with three unique shRNAs (#1, #2, #3) in SW620 and LoVo cells. C) Cell death (Annexin V/PI positive cells) was measured by Annexin-V/PI assays in indicated cells treated with hydrogen peroxide (H2O2, 100 µM) for 48 hours. D and E) The nicotinamide adenine dinucleotide phosphate (NADP)/NADP+ and reduced glutathione (GSH)/oxidized glutathione (GSSG) levels were measured in the indicated CRC cells under normoxia or hypoxia. F) Representative histograms and quantification of cellular ROS levels in the indicated CRC cells exposed to hypoxia for 48 hours, as detected by the fluorescent probe 2′,7′–dichlorodihydrofluorescein diacetate (DCF-DA). G) Cell death was measured by Annexin-V/PI assays in the indicated CRC cells under normoxia or hypoxia for 72 hours (red numbers indicate subpopulation of cells positive for Annexin V/PI). H) Immunoblotting analysis of cleaved poly ADP-ribose polymerase (PARP) in the indicated CRC cells. I) Quantification of cell death in the indicated CRC cells after hypoxia for 72 hours (with or without 5 mM N-acetyl-L-cysteine). β-Actin was included as a loading control. Data in C–F and I are presented as the mean (SD) (n = 3), and statistical analyses were performed using Student unpaired t test. All statistical tests were two-sided. CT = control; NES = Normalized enrichment score; FDR = False discovery rate; shMTHFD2 = short hairpin RNA-MTHFD2.
During tumor progression, hypoxia develops when tumor growth exceeds the ability of available vasculature (21). Because hypoxic exposure obviously induced mitochondrial and cellular ROS generation (P < .05 for all) (Supplementary Figure 2, E and F, available online), we postulated that MTHFD2 was required for NADPH generation to maintain GSH under hypoxia. Indeed, exposure of SW620 and LoVo cells to hypoxia led to a compensatory increase in cellular antioxidant activity demonstrated by the increased ratio of GSH/GSSG (P < .001 and P = .002, respectively) (Figure 2D) and a modest decrease in NADPH/NADP+ levels (P = .02 and P = .03, respectively) (Figure 2E). In contrast, MTHFD2 knockdown was associated with an impaired hypoxic induction of GSH decreased NADPH/NADP+ ratios, and increased ROS levels (P ≤ .01 for all) (Figure 2D–F). Accordingly, MTHFD2 knockdown CRC cells exhibited abundant cell death and obvious expression of cleaved poly ADP-ribose polymerase (Figure 2, G and H). Interestingly, the hypoxia-induced cell death could be rescued by transfecting with shRNA resistance plasmid or adding the antioxidant N-acetyl-L-cysteine (NAC) (P ≤ .01 for all) (Figure 2I; Supplementary Figure 4A, available online). Together, these data suggest MTHFD2 is required for maintenance of the redox homeostasis and promoting CRC cell survival under hypoxia.
Effects of MTHFD2 Inhibition on CRC Cell Anoikis Under Detachment
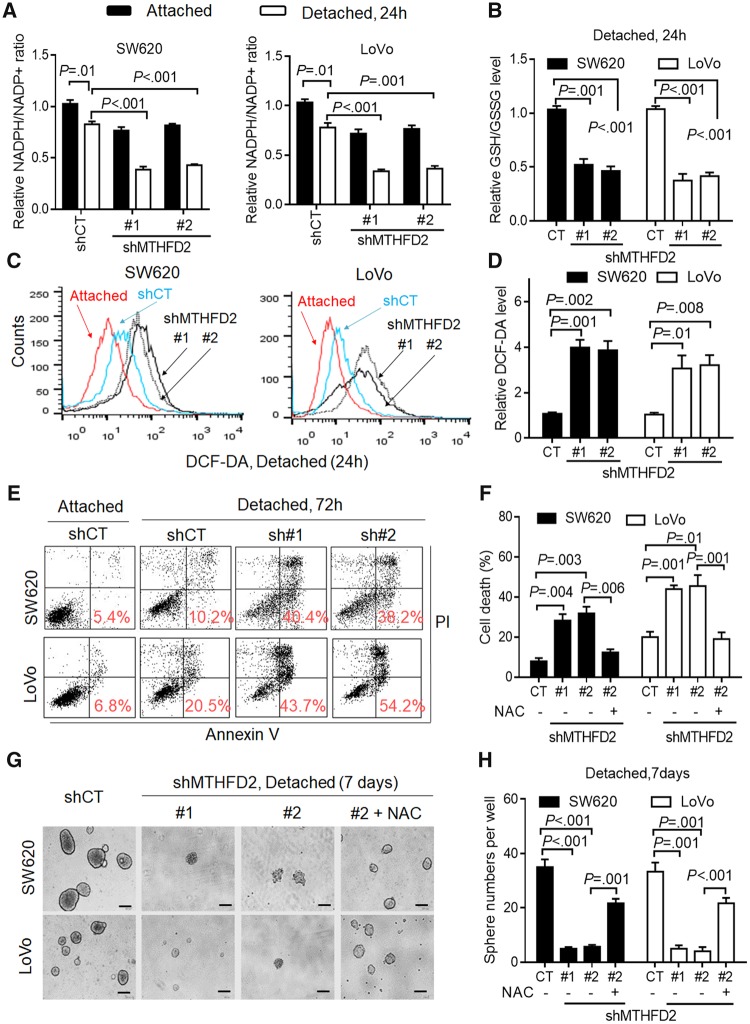
During tumor metastasis, metastatic cancer cells must adapt to and survive in the absence of the extracellular matrix and thus bypass anoikis (20,23). For the obviously increased ROS levels in CRC cells under detached conditions (P ≤ .01 for all) (Supplementary Figure 3, A and B, available online), we proposed that CRC cells under detachment need MTHFD2 to withstand oxidative stress. Indeed, MTHFD2 suppression exhibited an obvious decrease in NADPH/NADP+ and GSH/GSSG levels under detachment for 24 hours (P ≤ .001 for all) (Figure 3, A and B). Cellular ROS levels were also increased in MTHFD2 knockdown cells under detachment for 24 hours (P ≤ .01 for all) (Figure 3, C and D). Accordingly, MTHFD2 knockdown CRC cells had a statistically significant increase in cell death, which could be rescued by adding NAC or transfecting with shRNA resistance plasmid (P ≤ .01 for all) (Figure 3, E and F, Supplementary Figure 4A, available online). Furthermore, we studied the ability of CRC cells to form neurospheres (10). We found that MTHFD2 suppression resulted in disrupted cell sphere formation ability, which was partly rescued by pretreatment with NAC (P ≤ .001 for all) (Figure 3, G and H). In addition, we found that MTHFD2 suppression caused a decrease in the cell growth but has no effects on the invasion capacity (Supplementary Figure 3, C and D, available online), suggesting MTHFD2-mediated anoikis resistance may play key roles in CRC metastasis. Taken together, we demonstrate that MTHFD2 promotes anoikis resistance and enhances CRC malignancy in vitro.
Figure 3.
Effects of methylene tetrahydrofolate dehydrogenase 2 (MTHFD2) inhibition on colorectal cancer (CRC) cell anoikis under detachment. A and B) Cellular nicotinamide adenine dinucleotide phosphate (NADP)/NADP+ and reduced glutathione (GSH)/oxidized glutathione (GSSG) levels were measured in the indicated CRC cells under attached or detached conditions for 24 hours. C and D) Representative histograms and quantification of cellular reactive oxygen species (ROS) levels in the indicated CRC cells under attached or detached conditions for 24 hours, as detected by the fluorescent probe 2′,7′–dichlorodihydrofluorescein diacetate (DCF-DA). E) Cell death was measured by Annexin-V/PI assays in the indicated CRC cells under attached or detached conditions for 72 hours (red numbers indicate subpopulation of cells positive for Annexin V/PI). F) Quantification of cell death in the indicated cells cultured under detached conditions for 72 hours (with or without 5 mM N-acetyl-L-cysteine). G-H) Phase-contrast micrographs and quantification of sphere formation by MTHFD2-knockdown and control CRC cells cultured under detached conditions in 6-well ultralow attachment plates (2.0 x 10³ cells/well) (scale bar = 200 µm). Data in A, B, D, F, and H are presented as the mean (SD) (n = 3). All statistical analyses were performed using Student unpaired t test. All statistical tests were two-sided. CT = control.
Effects of MTHFD2 Inhibition on CRC Tumorigenesis and Metastasis in Vivo
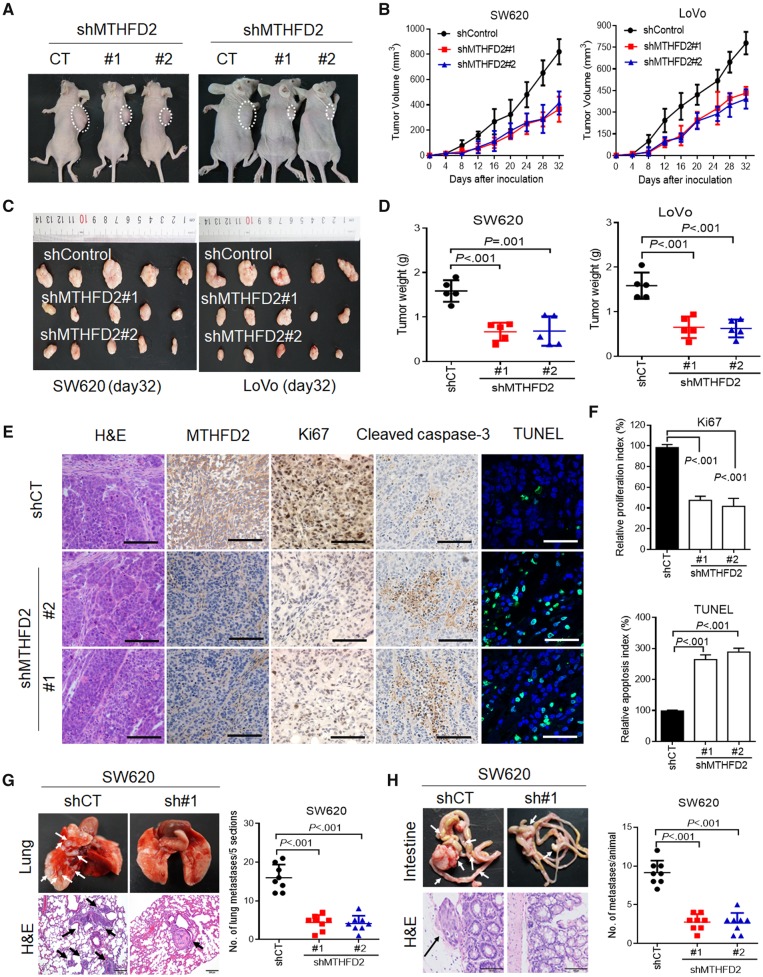
To test whether MTHFD2 contributes to CRC tumorigenesis in vivo, we performed cell-based xenograft experiments. As expected, the MTHFD2 knockdown group clearly reduced tumor growth and decreased tumor weight (P ≤ .001 for control vs knockdown groups) (Figure 4A–D). Furthermore, MTHFD2 knockdown SW620 cell-induced tumor biopsies indicated more reduced cell proliferation indices (Ki67-positive) and enhanced cell apoptosis as determined by cleaved caspase-3 and TdT-mediated dUTP Nick-End Labeling staining (P ≤ .001 for control vs knockdown groups) (Figure 4, E and F). Because anchorage independence is essential for survival of circulating cancer cells during metastasis (24), we further explored the role of MTHFD2 in lung colonization. Mice injected with control CRC cells induced a heavy lung metastatic burden verified by histologic examination, whereas knockdown of MTHFD2 almost abolished this lung metastasis (mean number in the control group = 16.00 [3.42] vs 4.37 [1.99] [sh#1] or 4.12 [2.03] [sh#2] for MTHFD2-knockdown groups for SW620 cells, P < .001, and similar results were seen for LoVo cell with a P < .001) (Figure 4G, Supplementary Figure 4B, available online). To further determine the effects of MTHFD2 on promoting CRC metastasis, tumors formed by CRC cells were orthotopically implanted into the cecum of nude mice (n = 8). The results indicated that MTHFD2 suppression also reduced mesenteric metastatic nodules across the intestinal wall (mean number in the control group = 9.12 [1.55] vs 2.75 [1.03] [sh#1] or 2.62 [1.30] [sh#2] for MTHFD2-knockdown groups for SW620 cell, P<.001, and similar results were seen for LoVo cell groups with a P<.001) (Figure 4H, Supplementary Figure 4C, available online). Overall, the above results highlight the crucial roles of MTHFD2 in CRC tumorigenesis and metastasis.
Figure 4.
Effects of methylene tetrahydrofolate dehydrogenase 2 (MTHFD2) inhibition on colorectal cancer (CRC) tumorigenesis and metastasis in vivo. A) Xenograft model was established in nude mice subcutaneously implanted with MTHFD2-knockdown and control CRC cells (N = 5). Representative images of tumor-bearing mice were taken at day 28. B) Tumor volumes recorded on the indicated days are shown. C) Photograph and comparison of excised tumor size. D) The tumor weights of the indicated group on day 32 were measured. These mouse experiments were repeated once. E) Paraffin-embedded tumor sections derived from the SW620 group were stained with hematoxylin and eosin (H&E) or MTHFD2, Ki67, and cleaved caspase 3 antibodies (scale bar = 100 µm). Apoptotic cells were visualized by TdT-mediated dUTP Nick-End Labeling (TUNEL) staining (green) and counterstained with 4′,6-diamidino-2-phenylindole (DAPI) (blue) (scale bar = 10 µm). F) The proliferation index (Ki67 staining) and apoptotic index (TUNEL staining) in tumor sections were also quantified. G) Representative H&E staining and statistical results of metastatic lung nodules from mice injected via the tail vein with MTHFD2 knockdown and control SW620 cells for 60 days (five sections evaluated per lung). H) Representative H&E staining and statistical results of scattered tumors in the excised intestines of mice (N = 8) orthotopically implanted with the indicated cells. Arrows indicate the metastatic foci (scale bar = 100 µm). All statistical analyses were performed using Student unpaired t test. All statistical tests were two-sided. CT = control; shCT = short hairpin RNA-Control; shControl = short hairpin RNA-Control; shMTHFD2 = short hairpin RNA-MTHFD2.
Signaling Pathway Involved in MTHFD2 Expression in CRC
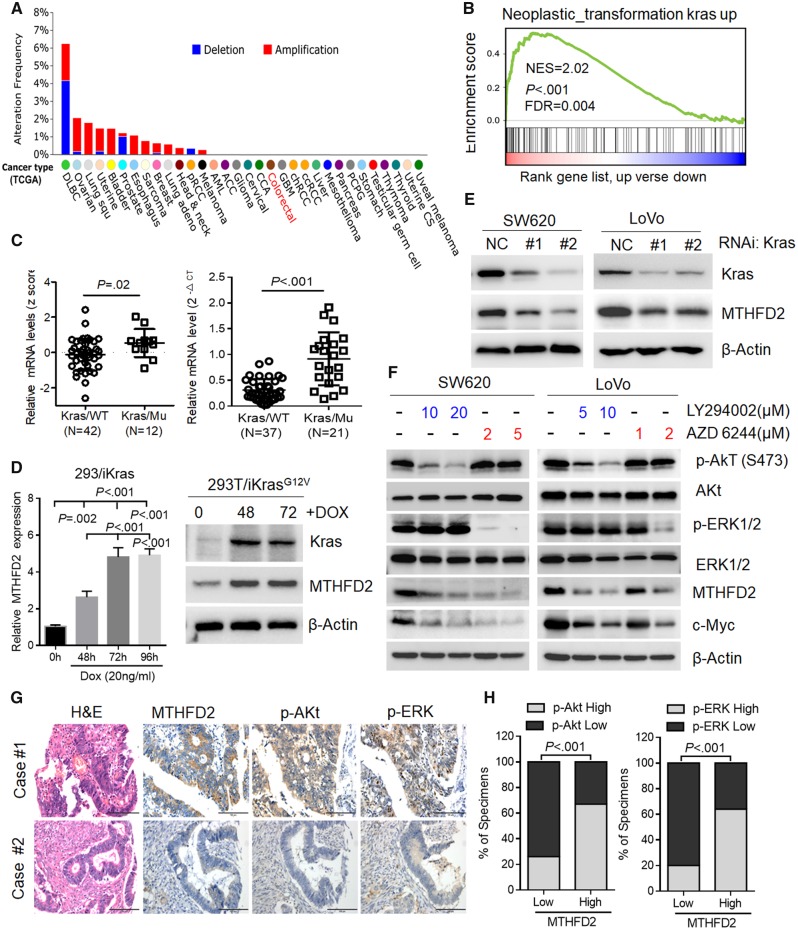
To access the molecular regulation of MTHFD2, we first surveyed its genetic alterations using the cBioPortal datasets and found that the MTHFD2 locus is unamplified in CRC, indicating that MTHFD2 may be transcriptionally regulated (Figure 5A). Recent study shows that MTHFD2 expression is stimulated by Activating transcription factor 4 activated by mammalian target of rapamycin complex 1 in murine fibroblasts (25). However, GSEA analysis revealed that the MTHFD2 expression is positively corrected with Kras-regulated pathways in CRC (normalized enrichment score = 2.02, P < .001, Figure 5B). Activating Kras mutations account for 40% of human CRC patients and drive CRC tumorigenesis (26). Our analysis reveals that MTHFD2 expression levels are statistically significantly increased in Kras-mutant cells (P = .02), and qPCR analysis also proved higher levels of MTHFD2 expression in CRC tumor tissues with mutant Kras (mean mRNA levels in Kras/wild-type group = [0.21] vs 0.92 [0.51] in Kras/Mu group, P < .001, respectively) (Figure 5C). Using previously established 293T/iKras cell (22), we also observed that MTHFD2 expression levels were increased following Kras induction (Figure 5D). Inversely, depletion of Kras decreased MTHFD2 expression in CRC cells (Figure 5E). These above results clearly demonstrate that oncogenic Kras upregulated MTHFD2 expression in CRC cells.
Figure 5.
Signaling pathway involved in methylene tetrahydrofolate dehydrogenase 2 (MTHFD2) expression in colorectal cancer (CRC). A) Distribution of alteration frequency of MTHFD2 in multiple cancer types. Details in parentheses indicate the source of the corresponding tumor dataset (cBioPortal for Cancer Genomics). B) Gene set enrichment demonstrating the enrichment of Kras-related gene sets in the ranked gene list of MTHFD2 up vs MTHFD2 down available from The Cancer Genome Atlas CRC database. C) Quantitative polymerase chain reaction (qPCR) analysis of the MTHFD2 expression levels in Kras-mutant (Mu) vs Kras wild-type (WT) cells (NCI-60), or CRC specimens with wild-type Kras (N = 37) vs mutant Kras (N = 21). D) qPCR and immunoblotting analysis of MTHFD2 expression in 293T/iKras cells after Kras induction by 20 ng/mL doxycycline (Dox) for indicated time. Statistical analysis was performed using one-way analysis of variance with Tukey’s multiple comparison test. E) Immunoblotting analysis of MTHFD2 expression in SW620 and LoVo cells transfected with Kras siRNAs (#1, #2). F) Immunoblotting analysis of MTHFD2 expression in SW620 or LoVo cells treated with Akt (also known as protein kinase B or PKB), which is a well know as the serine/threonine kinase or extracellular signal regulated kinase1/2 (ERK1/2). Inhibitor at the indicated concentration for 48 hours. G) MTHFD2 expression was inversely associated with p-Akt and p-ERK expression in 462 clinical CRC specimens. Shown are visualizations of two representative cases (scale bar = 100 µm). H) Percentages of samples showing low or high MTHFD2 expression relative to p-Akt and p-ERK. Chi-square test was used to study the association between MTHFD2 and p-Akt or p-ERK expression. All statistical tests were two-sided. CT = control; NES = Normalized enrichment score; FDR = False discovery rate; NC = Negative control; RNAi = RNA interference; iKras = Inducible kras; H&E = Haematoxylin and Eosin stain.
Then, we investigated whether blocking the major Kras downstream signaling pathways, including Akt (also known as protein kinase B or PKB), extracellular signal regulated kinase1/2 (ERK1/2), and nuclear factor κB, would decrease MTHFD2 expression. We found that the expression of MTHFD2 was statistically significantly decreased in detected CRC cells treated with either Akt inhibitor LY294002 or ERK1/2 inhibitor AZD6244 (Supplementary Figure 5, A and F, available online). Silencing of the Akt or ERK1/2 pathway in these cells with siRNA also resulted in downregulation of MTHFD2 mRNA as determined by qPCR analysis (Supplementary Figure 5B, available online). Also, correlation studies in 426 CRC tissue specimens showed that MTHFD2 expression was positively correlated with the expression levels of p-Akt, p-ERK, and Ki67 (P < .001 for all) (Figure 5, G and H, Supplementary Figure 5C, available online). These results suggest that MTHFD2 overexpression was induced by both Akt and ERK1/2 pathways activated by Kras.
Transcriptional Regulation of MTHFD2 in CRC
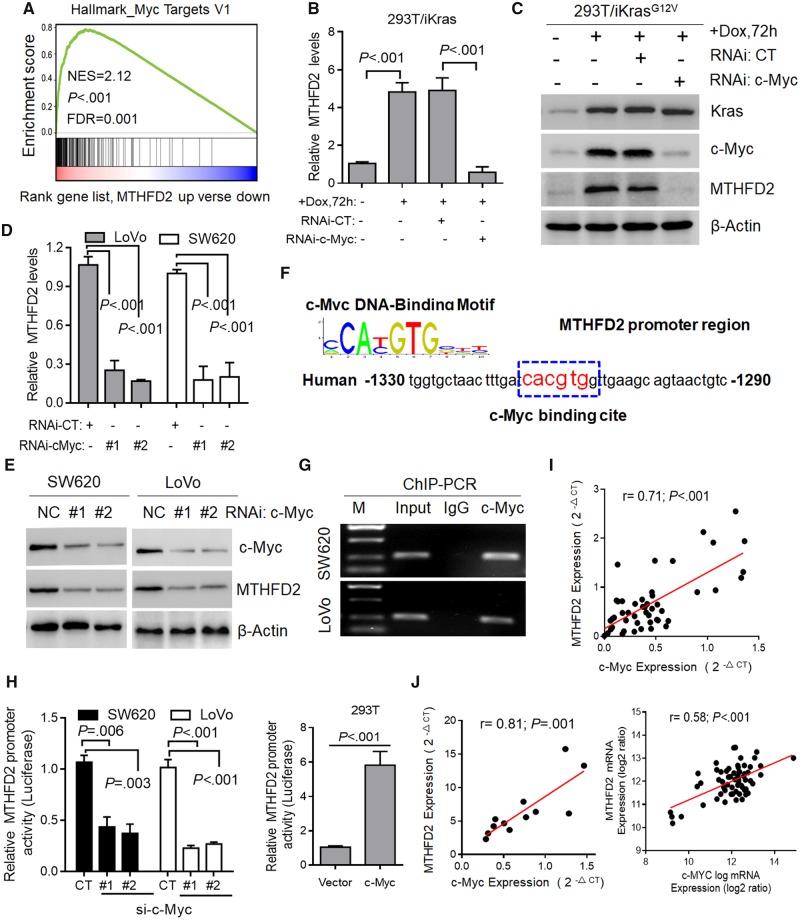
Previous study indicates that activation of Ras/Akt/ERK pathways induce c-Myc stabilization by attenuation of its ubiquitin-mediated protein degradation mechanism (27,28). Consistent with a recent report (29), GSEA analysis revealed that MTHFD2 expression was enriched in the transcriptional profiling of c-Myc (P < .001, Figure 6A). To investigate whether Kras regulates MTHFD2 via c-Myc, we knocked down c-Myc and observed decreased MTHFD2 levels in 293T/iKras cells (P < .001) (Figure 6, B and C). Further study also indicated that depletion of c-Myc obviously decreased the expression of MTHFD2 in LoVo and SW620 cells (P < .001 for all) (Figure 6, D and E). We next identified a c-Myc binding element (CACGTA) in the MTHFD2 promoter (Figure 6F). Chromatin immunoprecipitation-polymerase chain reaction ChIP-PCR assays showed MTHFD2 promoter occupancy by c-Myc (Figure 6G), and luciferase promoter assay showed that c-Myc suppression decreased MTHFD2 activity and vice versa (P < .01 for all) (Figure 6H). In addition, qPCR analysis revealed that expression of MTHFD2 is tightly correlated with the expression of c-Myc in 48 paired CRC tissue samples (r = 0.71, P < .001) (Figure 6I). This positive correlation was also validated in 12 CRC cell lines and the public CCLC database (r = 0.81, P = .001; r = 0.58, P < .001, respectively) (Figure 6J). These findings demonstrate that c-Myc transcriptionally upregulates MTHFD2 expression though Kras-activated AKT and ERK pathways in CRC.
Figure 6.
Transcriptional regulation of methylene tetrahydrofolate dehydrogenase 2 (MTHFD2) in colorectal cancer (CRC). A) Gene set enrichment enrichment score and distribution of c-Myc-regulated genes along the rank of MTHFD2 up vs MTHFD2 down available from The Cancer Genome Atlas CRC database. B and C) Quantitative polymerase chain reaction (qPCR) and immunoblotting analysis of MTHFD2 expression in 293T/iKras cells after Kras induction and/or c-Myc depletion for 72 hours. D and E) qPCR and immunoblotting analysis of MTHFD2 expression in SW620 and LoVo cells transfected with c-Myc siRNAs (#1, #2). F) c-Myc DNA-binding sites are present in the human MTHFD2 promoter region. G) Chromatin immunoprecipitation-polymerase chain reaction (ChIP-PCR) in SW620 and LoVo cells. Representative of two independent experiments. H) Relative MTHFD2 luciferase promoter activity in indicated cells with c-Myc depletion or overexpression. I) Scatterplots of MTHFD2 vs c-Myc mRNA expression in CRC tissues (N = 48) analyzed by qPCR. J) Scatterplots of MTHFD2 vs c-Myc mRNA expression in cell lines (N = 62) available from CCLE database and CRC cell lines (N = 12). Pearson correlation coefficient (r) and P value are displayed. Data in B, D, and H are presented as the mean (SD) (n = 3), and statistical analyses were performed using Student unpaired t test. All statistical tests were two-sided. CT = control; DOX = doxycycline; NES = Normalized Enrichment Score; FDR = False Discovery Rate; NC = Negative Control; RNAi = RNA interference; IgG = Immunoglobulin G; si-c-Myc = Small interfering RNA-c-Myc.
Antitumor Activity of MTHFD2 Inhibitor LY345899 in CRC
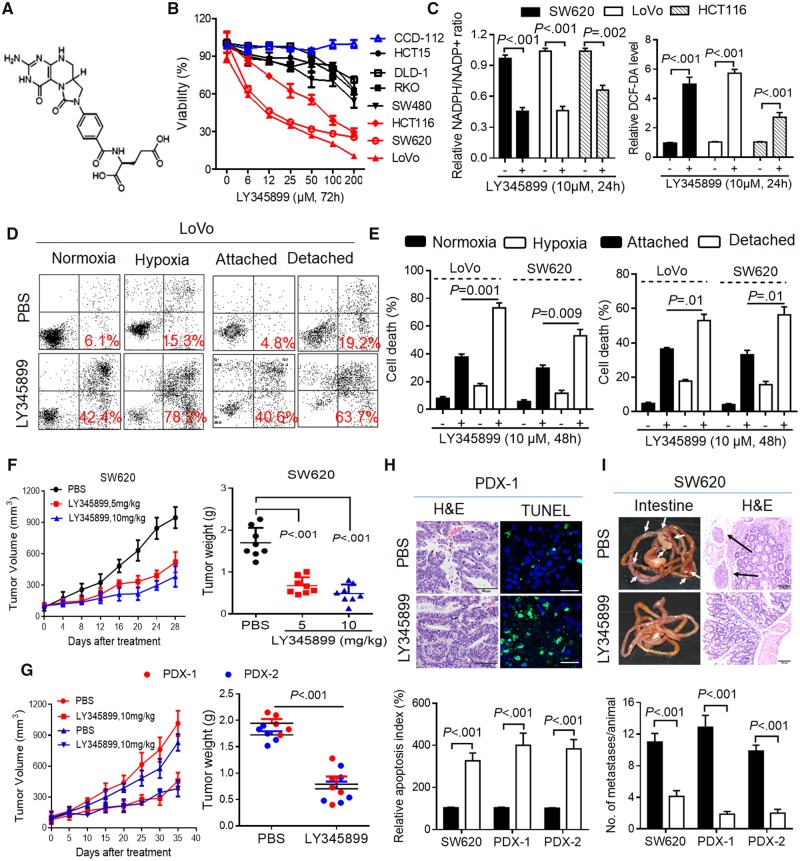
A recent study reported the crystal structure of MTHFD2 and a substrate-based inhibitor LY345899 targeting cytoplasmic and mitochondrial MTHFD enzyme (30). Following this study, we synthesized LY345899 and tested its antitumor activity in CRC (Figure 7A). The results indicated that LY345899 treatment for 72 hours caused a decrease in the cell viability of the CRC cells with highly expressed MTHFD2 (LoVo, SW620, HCT116) (Figure 7B). These CRC cells treated with low-dose LY345899 (1 μM) for 14 days statistically significantly reduced cell colony formation (Supplementary Figure 6, A and B, available online). As expected, LY345899 treatment decreased cellular NADPH/NADP+ and GSH/GSSG levels (P < .01 for all) (Figure 7C, Supplementary Figure 6C, available online), increased cellular ROS levels, and caused more cell death in CRC cells, which could be rescued by adding NAC (P < .001 for all) (Figure 7C, Supplementary Figure 6, D and E, available online). However, addition of 5 mM formate to media did not rescue the cell apoptosis in these cells (Supplementary Figure 6E, available online), suggesting that the cell death induced by LY345899 treatment is likely distinct from any reduction in formate production but redox modification. Accordingly, LY345899 treatment for 48 hours obviously enhanced cell death under hypoxia or detached conditions (P ≤ .01 for all) (Figure 7, D and E).
Figure 7.
Antitumor activity of methylene tetrahydrofolate dehydrogenase 2 (MTHFD2) inhibitor LY345899 in colorectal cancer (CRC). A) Chemical structure of LY345899. B) The cell viability of the indicated CRC cells treated with LY345899 for 72 hours was determined by MTS assay. C) The relative nicotinamide adenine dinucleotide phosphate (NADP)/NADP+ (NADP/NADP+) and reactive oxygen species (ROS) levels were measured in the indicated CRC cells treated with LY345899 (10 µM) for 24 hours. D and E) Representative and statistical results of annexin V/PI staining in LoVo and SW620 cells treated with LY345899 for 48 hours under hypoxia or detachment. F) The tumor growth curves and weights were measured and recorded for SW620-based xenograft mice treated with LY345899 (5 mg/kg or 10 mg/kg per mouse, intraperitoneal (ip, 5 d/wk). The mice were treated with LY345899 when the tumor volume reached 100 mm3. Statistical analysis was performed using one-way analysis of variance with Tukey’s multiple comparison test. G) The tumor growth curves and the weights were measured and recorded for the patient derived xenograft (PDX) mice (#1, #2) treated with LY345899 (10 mg/kg per mouse, ip, 5 d/wk) (N = 5). H) Representative and quantification of TdT-mediated dUTP Nick-End Labeling staining for apoptosis analysis in the indicated groups (scale bar = 10 µm). I) Images and statistical results of scattered tumors in the excised intestines of LY345899-treated mice (N = 8) orthotopically implanted with CRC cells or PDX tissues (scale bar = 100 µm). Data in B, D, and H are presented as the mean (SD) (n = 3), and statistical analyses were performed using Student unpaired t test. All statistical tests were two-sided. DCF-DA = 2′,7′–dichlorodihydrofluorescein diacetate; H&E = haematoxylin and eosin staining; PBS = phosphate buffered saline.
Importantly, we found that LY345899 treatment showed potent antitumor activity in vivo, which was evident by the reduced SW620 cell or PDX-based tumor growth and tumor weight (mean tumor weight = 1.83 [0.19] mg for vehicle-treated PDX group vs 0.74 [0.30] mg for LY345899-treated group, P < .001, and similar results were seen in the other groups with a P < .001) (Figure 7, F and G, Supplementary Figure 6F, available online). Immunohistochemical staining showed the treated tumor also displayed lower cell proliferation indices and higher cell apoptosis (Supplementary Figures 6G and 7H, available online). Additionally, no statistically significant weight loss or other signs of acute or delayed toxicity were observed in any of the mice during treatment (Supplementary Figure 6F, available online). We also found that LY345899 treatment reduced mesenteric metastatic nodules in mice implanted with SW620 or PDX-based tissues into the cecum (P < .001 for untreated vs treated groups) (Figure 7I). These findings indicate that LY345899 displays therapeutic activity against CRC and warrants further clinical investigation for CRC treatment.
Discussion
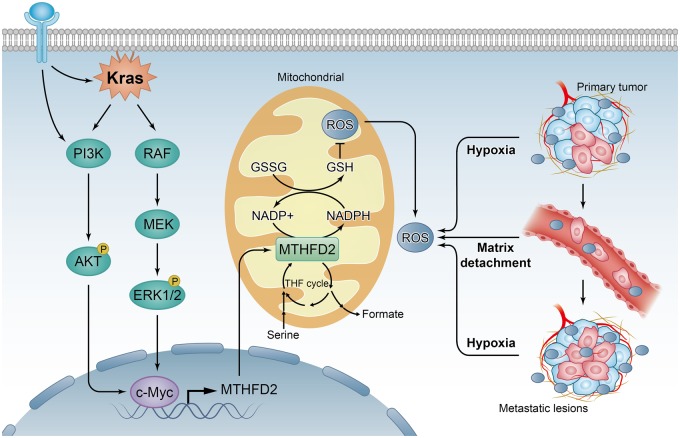
The folate metabolism pathway produces one-carbon formyl groups for various cellular processes, including de novo purine and thymidine synthesis, which are necessary for cell proliferation, not typically considered as an important NADPH source (31). In this pathway, MTHFD2 can generate NADPH from NADP+ (12), suggesting it may play critical roles in cellular detoxification. In support of this, a recent study has revealed that folate pathway inhibition induces oxidative stress and inhibits melanoma cell distant metastasis (32). Consistently, antifolates have been found to induce oxidative stress (33), and dietary supplementation with folate promotes the progression of breast cancer (34). As illustrated in Figure 8, we present evidence that MTHFD2 is required for the maintenance of NADPH level under conditions of oxidative stress, such as hypoxia and extracellular matrix detachment. Furthermore, we demonstrate that MTHFD2-dependent redox homeostasis rescues CRC cells from the need for NADPH generation, thus enhancing malignancy and distant metastasis. Mechanistically, we clarify that the MTHFD2 is transcriptionally upregulated by c-Myc though Kras downstream, including PI3K/Akt and ERK pathways. Thus, our study provides a biochemical explanation for the cooperation between Kras and c-Myc activation in CRC development, which allows us a better understanding their oncogenetic roles.
Figure 8.
Proposed working model of this study. Methylene tetrahydrofolate dehydrogenase 2 (MTHFD2) confers redox homeostasis under hypoxia or extracellular matrix detachment and thus enhances malignancy and distant metastasis for colorectal cancer (CRC). Mechanistically, MTHFD2 is transcriptionally upregulated by c-Myc though Kras downstream, including PI3K/Akt and ERK pathways. GSH = reduced glutathione; GSSG = oxidized glutathione; NADP = nicotinamide adenine dinucleotide phosphate; ROS = reactive oxygen species; THF = tetrahydrofolate; PI3K = phosphatidylinositide 3-kinases; Akt = Protein kinase B (PKB); ERK = Extracellular signal regulated kinase.
Understanding MTHFD2-mediated folate metabolism may prove useful in developing new therapies. With differential expression of MTHFD2 in cancer tissues (17), targeting of MTHFD2 may offer a superior therapeutic window. The fact that MTHFD2 expression is elevated in CRC and correlates with poor prognosis also suggests that this enzyme may represent a novel therapeutic target for CRC treatment. Following recent study (30), we also demonstrated that the first inhibitor of MTHFD2 LY345899 is a promising therapeutic compound for CRC treatment.
This study, however, had some limitations. The antitumor effects of LY345899 need to be further investigated in immunocompetent mouse models together with CRC patients, either alone or in combination with chemotherapy. Future study should focus on the development of more effective and selective inhibitors for MTHFD2, testing their effects in preclinical trials and the combinatorial effects with clinical chemotherapy drugs.
In conclusion, our results show that MTHFD2 is an actionable target, and its inhibitor LY345899 is a promising therapeutic compound warranting further clinical investigation for CRC treatment.
Funding
This research was supported by the National Natural Science Foundation of China (81602137); Natural Science Foundation of Guangdong Province (2018B030306049, 2017A030313485, 2014A030312015); Science and Technology Program of Guangdong (2015B020232008); Science and Technology Program of Guangzhou (201508020012, 201508020250, 201604020003); National Key Research and Development Program of China (2016YFC1201704); and the Fundamental Research Funds for the Central Universities (17ykzd31).
Notes
Affiliations of authors: Sun Yat-sen University Cancer Center, State Key Laboratory of Oncology in South China, Collaborative Innovation Center for Cancer Medicine, Guangzhou, China (HQJ, YXL, DLC, ZXZ, ZXL, QNW, HYM, ZXW, DSW, HYP, ZLZ, DX, PH, RHX); Departments of Molecular and Cellular Oncology, The University of Texas MD Anderson Cancer Center, Houston, TX (HQJ, MCH, PJC); Department of Biochemistry and Molecular Biology, Zhongshan School of Medicine, Sun Yat-Sen University, Guangzhou, China (BL); The University of Texas Graduate School of Biomedical Sciences, Houston, TX (MCH, PJC)
The funders had no role in the design of the study; the collection, analysis, or interpretation of the data; the writing of the manuscript; or the decision to submit the manuscript for publication. We acknowledge the many helpful suggestions and support from the members of our laboratories. The authors declare no potential conflicts of interest.
Supplementary Material
References
- 1.Rabeneck L, Horton S, Zauber AG, Earle C. Colorectal Cancer. In: Gelband H, Jha P, Sankaranarayanan R, et al., eds. Cancer: Disease Control Priorities. 3rd ed. (Volume 3). Washington, DC: The International Bank for Reconstruction and Development / The World Bank; 2015. [PubMed]
- 2. Zhou Q, Li K, Lin GZ, et al. Incidence trends and age distribution of colorectal cancer by subsite in Guangzhou, 2000-2011. Chin J Cancer. 2015;343:34.. [DOI] [PMC free article] [PubMed] [Google Scholar]
- 3. Huang R, Zong X.. Aberrant cancer metabolism in epithelial-mesenchymal transition and cancer metastasis: mechanisms in cancer progression. Crit Rev Oncol Hematol. 2017;115:13–22. [DOI] [PubMed] [Google Scholar]
- 4. Weber GF. Metabolism in cancer metastasis. Int J Cancer. 2016;1389:2061–2066. [DOI] [PubMed] [Google Scholar]
- 5. Ju HQ, Zhuang ZN, Li H, et al. Regulation of the Nampt-mediated NAD salvage pathway and its therapeutic implications in pancreatic cancer. Cancer Lett. 2016;3791:1–11. [DOI] [PubMed] [Google Scholar]
- 6. Ju HQ, Ying H, Tian T, et al. Mutant Kras- and p16-regulated NOX4 activation overcomes metabolic checkpoints in development of pancreatic ductal adenocarcinoma. Nat Commun. 2017;8:14437.. [DOI] [PMC free article] [PubMed] [Google Scholar]
- 7. Gorrini C, Harris IS, Mak TW.. Modulation of oxidative stress as an anticancer strategy. Nat Rev Drug Discov. 2013;1212:931–947. [DOI] [PubMed] [Google Scholar]
- 8. Cairns RA, Harris IS, Mak TW.. Regulation of cancer cell metabolism. Nat Rev Cancer. 2011;112:85–95. [DOI] [PubMed] [Google Scholar]
- 9. Ju HQ, Gocho T, Aguilar M, et al. Mechanisms of overcoming intrinsic resistance to gemcitabine in pancreatic ductal adenocarcinoma through the redox modulation. Mol Cancer Ther. 2015;143:788–798. [DOI] [PubMed] [Google Scholar]
- 10. Ju HQ, Lu YX, Chen DL, et al. Redox regulation of stem-like cells though the CD44v-xCT axis in colorectal cancer: mechanisms and therapeutic implications. Theranostics. 2016;68:1160–1175. [DOI] [PMC free article] [PubMed] [Google Scholar]
- 11. Trachootham D, Alexandre J, Huang P.. Targeting cancer cells by ROS-mediated mechanisms: a radical therapeutic approach? Nat Rev Drug Discov. 2009;87:579–591. [DOI] [PubMed] [Google Scholar]
- 12. Fan J, Ye J, Kamphorst JJ, et al. Quantitative flux analysis reveals folate-dependent NADPH production. Nature. 2014;5107504:298–302. [DOI] [PMC free article] [PubMed] [Google Scholar]
- 13. Schieber M, Chandel NS.. ROS function in redox signaling and oxidative stress. Curr Biol. 2014;2410:R453–R462. [DOI] [PMC free article] [PubMed] [Google Scholar]
- 14. Ju HQ, Lu YX, Wu QN, et al. Disrupting G6PD-mediated Redox homeostasis enhances chemosensitivity in colorectal cancer. Oncogene. 2017;3645:6282–6292. [DOI] [PMC free article] [PubMed] [Google Scholar]
- 15. Christensen KE, Mackenzie RE.. Mitochondrial methylenetetrahydrofolate dehydrogenase, methenyltetrahydrofolate cyclohydrolase, and formyltetrahydrofolate synthetases. Vitam Horm. 2008;79:393–410. [DOI] [PubMed] [Google Scholar]
- 16. Liu F, Liu Y, He C, et al. Increased MTHFD2 expression is associated with poor prognosis in breast cancer. Tumour Biol. 2014;359:8685–8690. [DOI] [PubMed] [Google Scholar]
- 17. Nilsson R, Jain M, Madhusudhan N, et al. Metabolic enzyme expression highlights a key role for MTHFD2 and the mitochondrial folate pathway in cancer. Nat Commun. 2014;51:3128.. [DOI] [PMC free article] [PubMed] [Google Scholar]
- 18. Tedeschi PM, Vazquez A, Kerrigan JE, et al. Mitochondrial methylenetetrahydrofolate dehydrogenase (MTHFD2) overexpression is associated with tumor cell proliferation and is a novel target for drug development. Mol Cancer Res. 2015;1310:1361–1366. [DOI] [PMC free article] [PubMed] [Google Scholar]
- 19. Ducker GS, Chen L, Morscher RJ, et al. Reversal of cytosolic one-carbon flux compensates for loss of the mitochondrial folate pathway. Cell Metab. 2016;236:1140–1153. [DOI] [PMC free article] [PubMed] [Google Scholar]
- 20. Schafer ZT, Grassian AR, Song L, et al. Antioxidant and oncogene rescue of metabolic defects caused by loss of matrix attachment. Nature. 2009;4617260:109–113. [DOI] [PMC free article] [PubMed] [Google Scholar]
- 21. Guzy RD, Hoyos B, Robin E, et al. Mitochondrial complex III is required for hypoxia-induced ROS production and cellular oxygen sensing. Cell Metab. 2005;16:401–408. [DOI] [PubMed] [Google Scholar]
- 22. Hu Y, Lu W, Chen G, et al. K-ras(G12V) transformation leads to mitochondrial dysfunction and a metabolic switch from oxidative phosphorylation to glycolysis. Cell Res. 2012;222:399–412. [DOI] [PMC free article] [PubMed] [Google Scholar]
- 23. Buchheit CL, Weigel KJ, Schafer ZT.. Cancer cell survival during detachment from the ECM: multiple barriers to tumour progression. Nat Rev Cancer. 2014;149:632–641. [DOI] [PubMed] [Google Scholar]
- 24. Valastyan S, Weinberg RA.. Tumor metastasis: molecular insights and evolving paradigms. Cell. 2011;1472:275–292. [DOI] [PMC free article] [PubMed] [Google Scholar]
- 25. Ben-Sahra I, Hoxhaj G, Ricoult SJH, et al. mTORC1 induces purine synthesis through control of the mitochondrial tetrahydrofolate cycle. Science. 2016;3516274:728–733. [DOI] [PMC free article] [PubMed] [Google Scholar]
- 26. Sebolt-Leopold JS, Herrera R.. Targeting the mitogen-activated protein kinase cascade to treat cancer. Nat Rev Cancer. 2004;412:937–947. [DOI] [PubMed] [Google Scholar]
- 27. Tsai WB, Aiba I, Long Y, et al. Activation of Ras/PI3K/ERK pathway induces c-Myc stabilization to upregulate argininosuccinate synthetase, leading to arginine deiminase resistance in melanoma cells. Cancer Res. 2012;7210:2622–2633. [DOI] [PMC free article] [PubMed] [Google Scholar]
- 28. Hsieh AL, Walton ZE, Altman BJ, et al. MYC and metabolism on the path to cancer. Semin Cell Dev Biol. 2015;43:11–21. [DOI] [PMC free article] [PubMed] [Google Scholar]
- 29. Pikman Y, Puissant A, Alexe G, et al. Targeting MTHFD2 in acute myeloid leukemia. J Exp Med. 2016;2137:1285–1306. [DOI] [PMC free article] [PubMed] [Google Scholar]
- 30. Gustafsson R, Jemth AS, Gustafsson NM, et al. Crystal structure of the emerging cancer target MTHFD2 in complex with a substrate-based inhibitor. Cancer Res. 2017;774:937–948. [DOI] [PubMed] [Google Scholar]
- 31. Ducker GS, Rabinowitz JD.. One-carbon metabolism in health and disease. Cell Metab. 2017;251:27–42. [DOI] [PMC free article] [PubMed] [Google Scholar]
- 32. Piskounova E, Agathocleous M, Murphy MM, et al. Oxidative stress inhibits distant metastasis by human melanoma cells. Nature. 2015;5277577:186–191. [DOI] [PMC free article] [PubMed] [Google Scholar]
- 33. Ayromlou H, Hajipour B, Hossenian MM, et al. Oxidative effect of methotrexate administration in spinal cord of rabbits. J Pak Med Assoc. 2011;6111:1096–1099. [PubMed] [Google Scholar]
- 34. Deghan Manshadi S, Ishiguro L, Sohn KJ, et al. Folic acid supplementation promotes mammary tumor progression in a rat model. PLoS One. 2014;91:e84635.. [DOI] [PMC free article] [PubMed] [Google Scholar]
Associated Data
This section collects any data citations, data availability statements, or supplementary materials included in this article.


