Abstract
Hepatocellular carcinoma (HCC) is the most common type of primary liver cancer, and can be induced by hepatitis B virus (HBV) infection. The aim of the present study was to screen prognosis-associated long noncoding RNAs (lncRNAs) and construct a risk score system for the disease. The RNA-sequencing data of patients with HCC (including 100 HCC samples and 26 normal samples) were extracted from The Cancer Genome Atlas (TCGA) database. In addition, GSE55092, GSE19665 and GSE10186 datasets were downloaded from the Gene Expression Omnibus database. Combined with weighted gene co-expression network analysis, the identification and functional annotation of stable modules was performed. Using the MetaDE package, the consensus differentially expressed RNAs (DE-RNAs) were analyzed. To construct a risk score system, prognosis-associated lncRNAs and the optimal lncRNA combination were separately analyzed by survival and penalized packages. Finally, pathway enrichment analysis for the nodes in an lncRNA-mRNA network was conducted via Gene Set Enrichment Analysis. A total of four stable modules and 3,051 consensus DE-RNAs were identified. The stable modules were significantly associated with the histological grades of HCC, tumor, node and metastasis stage, pathological stage, recurrence and exposure to radiation therapy. A 9-lncRNA optimal combination [DiGeorge syndrome critical region gene 9, glucosidase, β, acid 3 (GBA3), HLA complex group 4, N-acetyltransferase 8B, neighbor of breast cancer 1 gene 2, prostate androgen-regulated transcript 1, ret finger protein like 1 antisense RNA 1, solute carrier family 22 member 18 antisense and T-cell leukemia/lymphoma 6] was selected from the 14 prognosis-associated lncRNAs, and was further supported by the validation dataset, GSE10186. The lncRNA-mRNA co-expression network revealed lncRNA GBA3 as a positive regulator of phosphoenolpyruvate carboxykinase 2, an important enzyme in the metabolic pathway of gluconeogenesis. A risk score system was established based on the optimal 9 lncRNAs, which may be valuable for predicting the prognosis of patients with HBV-positive HCC and improving understanding of mechanisms associated with the pathogenesis of this disease. On the contrary, a larger, independent cohort of patients is required to further validate the risk-score system.
Keywords: hepatocellular carcinoma, hepatitis B virus, long noncoding RNAs, weighted gene co-expression network analysis, risk score system
Introduction
Hepatocellular carcinoma (HCC) is the most common type of primary liver cancer in adults, accounting for the highest mortality rate in patients with cirrhosis (1). HCC is typically associated with hepatitis virus infection [hepatitis B virus (HBV) or hepatitis C virus (HCV)] or exposure to aflatoxin and alcohol; ~75% of HCC cases are induced by HBV infection (2,3). Patients with HCC are characterized by the presentation of yellow skin, weight loss, abdominal swelling, nausea, loss of appetite, vomiting, abdominal pain or fatigue (4). The stages of disease progression in newly diagnosed patients can greatly affect the prognosis of HCC (5). Patient outcome is typically poor, with only 10–20% of HCC cases fully recovering following surgery (6). HCC commonly occurs in males aged 30–50 years; annually, 662,000 cases of HCC-associated mortality are reported worldwide (7). Therefore, the pathogenesis of HBV-induced HCC requires further investigation to improve the diagnosis and treatment of this disease.
Long noncoding RNAs (lncRNAs) serve important roles in various cellular activities, including gene expression regulation, tumor growth, apoptosis, autophagy and cell differentiation (8,9). Via regulation of lncRNAs, such as zinc finger E-box binding homeobox 2 antisense RNA 1, HBV X (HBx) promotes the metastasis of HCC cells via the induction of epithelial-mesenchymal transition (10). The expression of lncRNA downregulated expression by HBx is reduced in HBV-associated HCC samples, and exhibits an inverse correlation with HBx expression and functions as a tumor suppressor in HBV-associated hepatocarcinogenesis (11). The lncRNA Unc-51 like kinase 4 pseudogene 2 is upregulated in HBV-associated HCC tissues and may be involved in mediating disease pathogenesis by associating with enhancer of zeste homolog 2 (12). The expression of lncRNA LINC00152 can be enhanced by HBx, and its suppression is a potential therapeutic strategy for the treatment of HCC (13,14). The serum expression levels of lncRNAs AX800134 and uc001ncr were identified as potential diagnostic markers for HBV-associated HCC (15). The lncRNAs uc003wbd and AF085935 are dysregulated in the serum of patients with HBV or HCC, and may be potential targets for the screening of HBV and HCC (16). The lncRNA DBH antisense RNA 1 contributes to cell proliferation and survival via the Ras/mitogen activated protein kinase signaling pathway, and serves a carcinogenic role in HBV-associated HCC (17). Therefore, identifying the lncRNAs associated with HBV-induced HCC is important for understanding the underlying mechanisms and identifying novel therapies for the treatment of this disease.
Bioinformatics methods are extensively used for analyzing gene expression profiles to investigate the mechanisms of human diseases (18). Wang et al (19) analyzed the RNA-Seq data of patients in The Cancer Genome Atlas (TCGA), and used four independent prognostic lncRNAs identified by univariate Cox proportional hazards (Cox-PH) regression analysis to construct a risk score model. Zheng et al (20) sorted the samples downloaded from TCGA into four cohorts, based on their clinical history of viral hepatitis infection and alcohol consumption. Then, the lncRNAs dysregulated in normal samples versus three tumor sample cohorts, based on HBV infection, HCV infection and history of alcohol consumption, were identified to further select for disease-associated lncRNAs; however, a risk score model was not generated and further investigation is required. Yuan et al (21) collected samples from HCC patients, patients with HBV-positive chronic hepatitis and cancer-free controls, and subsequently conducted reverse transcription-quantitative polymerase chain reaction (RT-qPCR) analysis of 10 candidate lncRNAs to identify differentially expressed lncRNAs in HCC patients compared with patients with chronic hepatitis or healthy controls. Risk score analysis revealed that the combination of three lncRNAs with α-fetoprotein could distinguish patients with HCC from those with chronic hepatitis or healthy controls. In the present study, the RNA-Seq data of patients in TCGA and three other datasets of HBV infection were downloaded. The RNA-Seq data from TCGA, GSE55092 and GSE19665 were integrated together to determine differentially expressed RNAs (DE-RNAs). Subsequently, prognosis-associated lncRNAs were selected by univariate Cox-PH regression analysis. The risk score system based on these lncRNAs was supported by the validation dataset, GSE10186. The constructed risk score system in the present study differs from those in the three aforementioned studies, and may provide a novel basis for predicting the prognosis of patients with HBV-induced HCC.
Materials and methods
Expression profile data
The mRNA-sequencing data of HCC (platform: Illumina HiSeq 2000 RNA Sequencing; extracted on 11th February 2018) were extracted from TCGA (https://cancergenome.nih.gov/) database, which included 100 HCC and 26 normal samples.
Additionally, microarray data in the Gene Expression Omnibus (GEO, http://www.ncbi.nlm.nih.gov/geo/) database were identified using ‘hepatocellular carcinoma’ as the key word. Relevant databases were selected based on the following criteria: i) The database contained gene expression profile data; ii) the samples were solid tumor tissues from patients with HCC; iii) the database contained HBV infection information; and iv) the database contained human expression profiles. A total of three databases [including GSE55092 (22), GSE19665 (23) and GSE10186 (24,25)] were selected. GSE55092 (including 39 HCC samples and 81 normal samples) and GSE19665 (including 5 HCC samples and 5 normal samples) were based on the Affymetrix-GPL570 platform (Affymetrix; Thermo Fisher Scientific, Inc., Waltham, MA, USA); the databases contained no prognosis information, and were used for screening prognosis-associated lncRNAs and constructing the risk score system. GSE10186 (including 118 HCC samples; platform: Affymetrix-GPL5474; Affymetrix; Thermo Fisher Scientific, Inc.) contained prognosis information and used for validating the risk score system. Among the 118 HCC samples, there were 79 samples with HBV infection status and prognosis information (including 19 HBV positive samples and 60 HBV negative samples; 48 alive samples and 31 dead samples, mean survival time=88.62±45.04 months) (Table I).
Table I.
| Characteristics | TCGA | GSE19965 | GSE10186 |
|---|---|---|---|
| Tumor samples | 100 | 5 | 79 |
| Control samples | 26 | 5 | 0 |
| Age (mean ± SD, years) | 61.64±14.70 | 64.30±8.23 | NA |
| Sex (male/female) | 60/40 | 9/1 | NA |
| Neoplasm histological grade (G1/G2/G3/G4/NA) | 12/51/35/1/1 | NA | NA |
| Pathologic stage (I/II/III/IV/NA) | 38/33/23/3/3 | NA | NA |
| Satellite lesions (positive/negative/NA) | NA | NA | 2/59/18 |
| Pathology differentiated (moderately/poorly/moderately-poorly) | NA | 7/1/2 | NA |
| Microvascular invasion (positive/negative/NA) | 36/52/12 | NA | 16/45/18 |
| Alcohol status (Yes/No/NA) | NA | NA | 46/30/3 |
| HBV infection (positive/negative/NA) | 57/43 | 5/5 | 19/60 |
| Live status (dead/alive) | 42/58 | NA | 48/31 |
| Overall survival time (mean ± SD, months) | 31.22±29.53 | NA | 88.62±45.04 |
NA, not available; SD, standard deviation; TCGA, The Cancer Genome Atlas.
Data preprocessing
The datasets were preprocessed by the following two methods according to their differences in testing platforms. For TCGA, the preprocessCore package (version 1.40.0, http://bioconductor.org/packages/release/bioc/html/preprocessCore.html) (26) in R was applied for data normalization. For the CEL files based on Affy platform, format conversion, the supplement of missing values, background correction and data standardization were conducted with the oligo package (version 1.41.1, http://www.bioconductor.org/packages/release/bioc/html/oligo.html) (27) in R.
Then, lncRNAs were annotated with the Ref_seq and Transcript_ID provided by annotation platforms. The detection sequences in the platforms were aligned with the human reference genome GRCh38 by Clustal 2 software (http://www.clustal.org/clustal2/) (28). By combining the annotation and alignment results, lncRNAs and relevant expression information were finally obtained (29,30).
Weighted gene co-expression network analysis (WGCNA)
WGCNA is an algorithm for the construction of a co-expression network and the identification of disease-associated modules (31). With TCGA as the training dataset, and GSE55092 and GSE19665 as the validation datasets, the R package WGCNA (version 1.61, http://cran.r-project.org/web/packages/WGCNA/index.html) (31) was used to build a co-expression network and screen the stable modules associated with HCC. The processes of WGCNA included calculating correlations in expression between the datasets, and determining adjacent function and module partition (each module contained ≥200 RNA, cutHeight=0.99). Additionally, functional annotation for the stable modules was conducted via the userListEnrichment function in the WGCNA package (31).
Differential expression analysis
For TCGA, GSE55092 and GSE19665, the DE-RNAs between HCC and normal samples were analyzed via the MetaDE.ES algorithm in the MetaDE package (version 1.0.5, http://cran.r-project.org/web/packages/MetaDE/) (32,33). The RNAs with Qpval >0.05, tau2=0, and P<0.05 and false discovery rate <0.05 were defined as consensus DE-RNAs. In particular, this study focused on the differential expression of lncRNAs in stable modules.
Construction and validation of risk score system
Univariate Cox regression analysis in survival package (version 2.4, http://cran.r-project.org/web/packages/survival/index.html) (34) was performed using TCGA to select for prognosis-associated lncRNAs from the lncRNAs in stable modules. The lncRNAs with P<0.05 were considered to be prognosis-associated lncRNAs.
Subsequently, the optimal lncRNA combinations were screened by the Cox-PH model in penalized package (http://bioconductor.org/packages/penalized/) (35). The parameter ‘lambda’ in the Cox-PH model was acquired via 1,000× calculation based on a cross-validation likelihood (cvl) algorithm (36). The risk score system was constructed via weighting the expression level (exprlncRNA) of each lncRNA in the optimal lncRNA combination using the corresponding regression coefficient (β). The formula of the risk score system was as follows:
Risk score = βlncRNA1 × exprlncRNA1 + βlncRNA2 × exprlncRNA2 + … + βlncRNAn × exprlncRNAn.
Additionally, the robustness of the risk score system in prognosis prediction was evaluated using GSE10186 as the validation dataset, with Kaplan-Meier (KM) survival curves and receiver operating characteristic (ROC) curve analysis.
Analysis of lncRNA-associated pathways
Gene sets were extracted from stable modules involving the optimal lncRNAs. Using Gene Set Enrichment Analysis (http://software.broadinstitute.org/gsea/index.jsp) (37), pathway enrichment analysis was performed to identify lncRNA-associated pathways. The cut-off criterion was set as P<0.05.
Results
WGCNA is able to select for stable modules
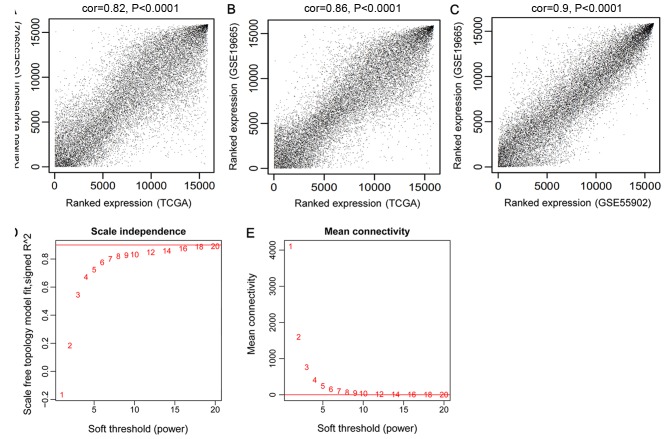
There were 15,988 mRNAs and 851 lncRNAs shared by GSE55092, GSE19665 and TCGA. The modules significantly associated with HCC were selected by WGCNA. The consistency of the expression values of the common RNAs was analyzed to ensure the comparability of RNA expression in the three datasets. The expression correlations were all >0.80 and P<1×10−200. Therefore, the three datasets exhibited significant and positive correlations (Fig. 1A-C).
Figure 1.
Correlations between TCGA, GSE55092 and GSE19665, and the selection of the adjacency matrix weighting parameter β (power). (A) Correlation between the expression data of TCGA and GSE55092. (B) Correlation between the expression data of TCGA and GSE19665. (C) Correlation between the expression data of GSE55092 and GSE19665. (D) The selection diagram of the adjacency matrix weighting parameter ‘power’ (the red line indicates that the square of correlation coefficient was 0.9). (E) Mean connectivity of RNAs under various values of ‘power’ (the red line indicates that the mean connectivity degree of the RNAs in co-expression network was 8 when β=8). TCGA, The Cancer Genome Atlas.
An appropriate adjacency matrix weighting parameter β (power) was selected to enable the co-expression network to approach a scale-free network distribution. The squares of the correlation coefficients between log(k) and log[p(k)] were acquired to select parameter β. A higher square value indicated that the co-expression network was closer to scale-free network distribution (Fig. 1D). The corresponding parameter β was selected when the square value first reached 0.9, namely β=8. The mean connectivity degree of the RNAs in the co-expression network was 8 when β=8, which was in accordance with small world architecture (Fig. 1E).
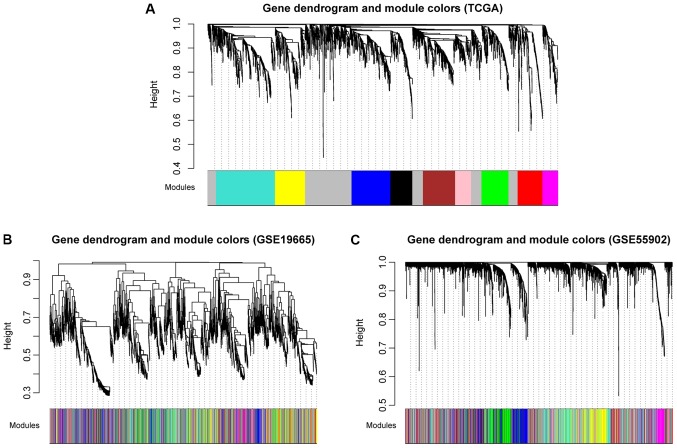
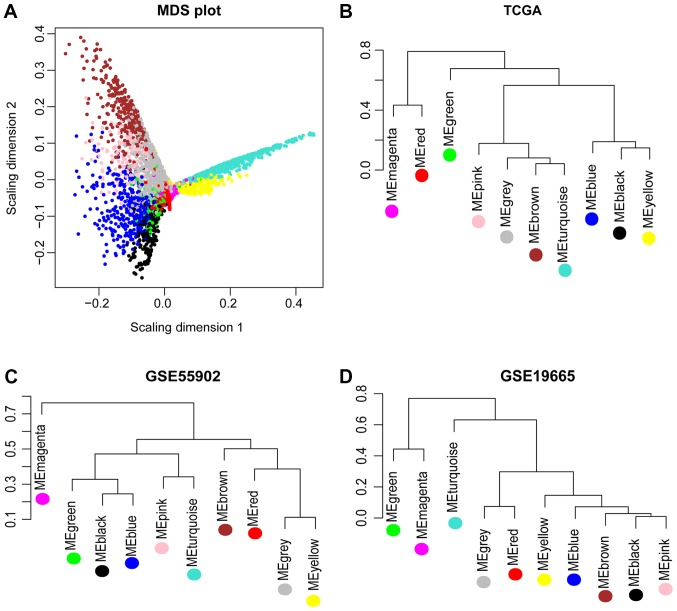
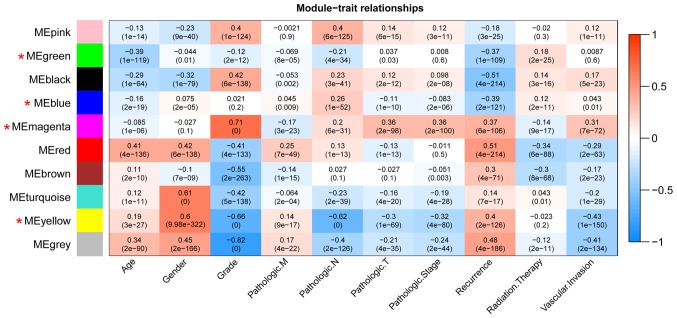
Using TCGA as the training dataset, a total of 10 modules were identified by constructing RNA adjacent matrices and system clustering trees (Fig. 2A). According to the modules of TCGA and the RNAs in each module, corresponding module partitioning was performed with GSE19665 (Fig. 2B) and GSE55092 (Fig. 2C) to determine the stabilities of the modules of TCGA. Module partitions and correlations for TCGA were presented in Fig. 3A and B, respectively. The results suggested that RNAs within the same module were gathered together, thus possessing similar expression (Fig. 3A). Additionally, the clustering results of GSE55092 (Fig. 3C) and GSE19665 (Fig. 3D) indicated that magenta, blue, yellow and green modules were characterized by independent branches; four modules (blue, magenta, yellow and green) were revealed to be stable modules (preservation Z score >10). Additionally, functional annotation demonstrated that the lncRNAs in blue, magenta, yellow and green modules respectively associated with ‘inflammatory responses’, ‘cell cycle’, ‘blood coagulation’ and ‘cell adhesion’ (Table II). Furthermore, the clinical information [including age, gender, grade, tumor, node and metastasis (TNM) stage, pathological stage, recurrence, radiation therapy and vascular invasion] of the samples in TCGA were integrated to calculate the correlation between the RNAs in each module and clinical factor. The results revealed that the four stable modules were significantly correlated to grade, TNM stage, pathologic stage, recurrence and radiation therapy (Fig. 4). Thus, the lncRNAs in the four stable modules were examined for subsequent analysis.
Figure 2.
Module partition trees corresponding to the analyzed datasets. (A) TCGA, (B) GSE19665 and (C) GSE55092. The colors represent separate modules. TCGA, The Cancer Genome Atlas.
Figure 3.
MDS plot and system clustering trees. (A) MDS plot of the RNAs in the modules of TCGA (the horizontal and vertical axes represent the fit of the first and second principal components, respectively). (B) System clustering tree for the modules of TCGA. (C) System clustering tree for the modules of GSE55092. (D) System clustering tree for the modules of GSE19665. MDS, multidimensional scaling; TCGA, The Cancer Genome Atlas.
Table II.
Stabilities of the 10 modules identified in TCGA and the biological functions enriched for the lncRNAs in the modules.
| TCGA | Color | Module size | mRNA | LncRNA | Preservation Z-score | Module annotation |
|---|---|---|---|---|---|---|
| Module 1 | black | 206 | 206 | 0 | 5.6804 | Chemotaxis |
| Module 2 | blue | 371 | 364 | 7 | 18.9870 | Inflammatory response |
| Module 3 | brown | 303 | 302 | 1 | 0.7094 | Oxidation-reduction process |
| Module 4 | green | 264 | 255 | 9 | 26.5495 | Cell adhesion |
| Module 5 | grey | 796 | 794 | 2 | 0.8546 | Response to nutrient levels |
| Module 6 | magenta | 147 | 143 | 4 | 26.2491 | Cell cycle |
| Module 7 | pink | 150 | 150 | 0 | 8.0652 | Regulation of cell proliferation |
| Module 8 | red | 233 | 232 | 1 | 0.3724 | Synaptic transmission |
| Module 9 | turquoise | 555 | 552 | 3 | 6.3217 | Ion transport |
| Module 10 | yellow | 286 | 283 | 3 | 25.7553 | Blood coagulation |
Module size, mRNA, lncRNA columns represent the number of all RNAs, mRNA, and lncRNAs in the corresponding module, respectively. 5<Z≤10 indicates stable, and Z>10 indicates highly stable. Module annotation indicates the functions involving the lncRNAs in the modules. LncRNA, long noncoding RNA; TCGA, The Cancer Genome Atlas.
Figure 4.
Correlation heatmap between the modules of TCGA and clinical factors. The horizontal and vertical axes indicate clinical factors and modules, respectively. Color gradient from blue to red indicates that the correlation shifts from negative to positive. The numbers in grids and parentheses respectively represent correlation coefficients and P-values. TCGA, The Cancer Genome Atlas.
Differential expression analysis
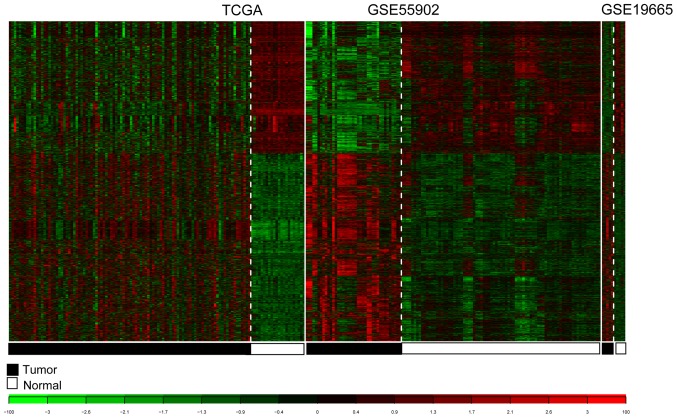
For TCGA, GSE55092 and GSE19665, 3,051 consensus DE-RNAs were reported. The 3,051 DE-RNAs included 10 lncRNAs and 3,041 mRNAs. The clustering heatmaps for the consensus DE-RNAs in the three datasets are presented in Fig. 5.
Figure 5.
Heatmaps of the consensus differentially expressed RNAs in TCGA, GSE55092 and GSE19665. White and black represent normal and tumor samples, respectively. TCGA, The Cancer Genome Atlas.
Construction and validation of the risk score system
The expression levels of the lncRNAs in stable modules were extracted from TCGA, and then 14 prognosis-associated lncRNAs were selected based on univariate Cox regression analysis. Using the Cox-PH model, the optimal lncRNA combination was selected from the 14 prognosis-associated lncRNAs. Finally, a 9-lncRNA optimal combination was obtained, involving: DiGeorge syndrome critical region gene 9 (DGCR9); glucosidase, β, acid 3 (GBA3); HLA complex group 4 (HCG4); N-acetyltransferase 8B (NAT8B); neighbor of breast cancer 1 gene 2 (NBR2); prostate androgen-regulated transcript 1 (PART1); ret finger protein like 1 antisense RNA 1 (RFPL1S); solute carrier family 22 member 18 antisense (SLC22A18AS) and T-cell leukemia/lymphoma 6 (TCL6; Table III). The formula for the risk score system based on the optimal lncRNA combination was:
Table III.
LncRNAs in the optimal lncRNA combination.
| LncRNA | Coefa | Hazard ratio | P-value | Module color |
|---|---|---|---|---|
| DGCR9 | −0.0308 | 0.90 | 0.0230 | blue |
| GBA3 | 0.2033 | 1.07 | 0.0240 | magenta |
| HCG4 | 0.4416 | 1.11 | 0.0170 | magenta |
| NAT8B | 0.7662 | 1.11 | 0.0120 | magenta |
| NBR2 | −0.5517 | 0.72 | 0.0068 | yellow |
| PART1 | 0.3786 | 1.04 | 0.0490 | green |
| RFPL1S | 0.0590 | 1.09 | 0.0340 | green |
| SLC22A18AS | 0.0427 | 1.11 | 0.0200 | green |
| TCL6 | 1.4731 | 1.23 | 0.0004 | green |
Coef, the coefficient value obtained from the Cox-Proportional Hazards Cox-PH model. Hazard ratio represents the risk score. Module color indicates the module in which the lncRNAs were located. DGCR9, DiGeorge syndrome critical region gene 9; GBA3, glucosidase, β, acid 3; HCG4, HLA complex group 4; lncRNA, long noncoding RNA; NAT8B, N-acetyltransferase 8B; NBR2, neighbor of breast cancer 1 gene 2; PART1, prostate androgen-regulated transcript 1; RFPL1S, ret finger protein like 1 antisense RNA 1; SLC22A18AS, solute carrier family 22 member 18 antisense; TCL6, T-cell leukemia/lymphoma 6.
Risk score = (−0.03084) × ExpDGCR9 + (0.203324) × ExpGBA3 + (0.441589) × ExpHCG4 + (0.766193) × ExpNAT8B + (−0.5517) × ExpNBR2 + (0.378576) × ExpPART1 + (0.058961) × ExpRFPL1S + (0.042655) × ExpSLC22A18AS + (1.473117) × ExpTCL6.
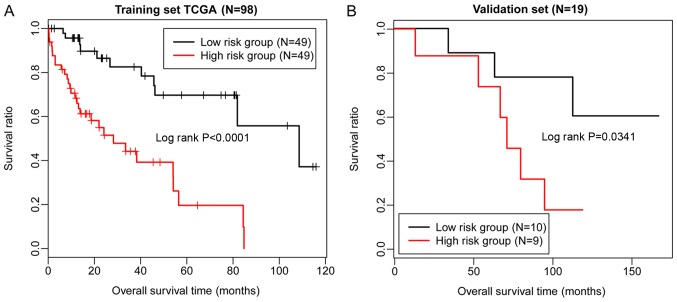
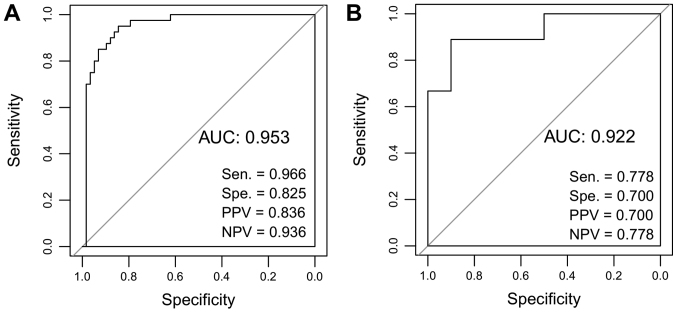
Risk scores were calculated for the samples in the dataset from TCGA using the risk score system. Based on the median of risk scores, the samples in TCGA were classified into high- and low-risk groups. Then, the difference between the survival times of individuals within the two groups was characterized by KM survival curves. The results indicated that the risk score system could effectively distinguish the high- and low-risk groups (P<0.01; Fig. 6A). Subsequently, the risk score system was applied to the validation dataset GSE10186, demonstrating that the high- and low-risk groups could also be differentiated (P=0.0341; Fig. 6B). Therefore, the risk score system exhibited high robustness, and the nine lncRNAs were significantly associated with the prognosis of patients with HCC. Furthermore, ROC curve analysis was applied to evaluate the predictive diagnostic value of the 9-lncRNA risk score system using TCGA and the validation dataset. The sensitivity, specificity, positive predictive value, negative predictive value, and the area under the ROC curves (AUC) were determined. The AUC values of the 9-lncRNA risk score system for TCGA and GSE10186 were 0.953 and 0.922, respectively (Fig. 7).
Figure 6.
KM survival curves. (A) KM survival curve demonstrating the overall survival times of TCGA. (B) KM survival curve presenting the overall survival times of the validation dataset GSE10186. Red and black indicate high- and low-risk groups, respectively. KM, Kaplan-Meier; TCGA, The Cancer Genome Atlas.
Figure 7.
ROC curve analysis of the 9-lncRNA risk score system. (A) ROC analysis of 9-lncRNA risk score system for The Cancer Genome Atlas dataset. (B) ROC analysis of 9-lncRNA risk score system for validation dataset GSE10186. The sensitivity, specificity, PPV, NPV and the AUC were presented. AUC, area under the curve; lncRNA, long noncoding RNA; NPV, negative predictive value; PPV, positive predictive value; ROC, receiver operating characteristic.
Analysis of lncRNA-associated pathways
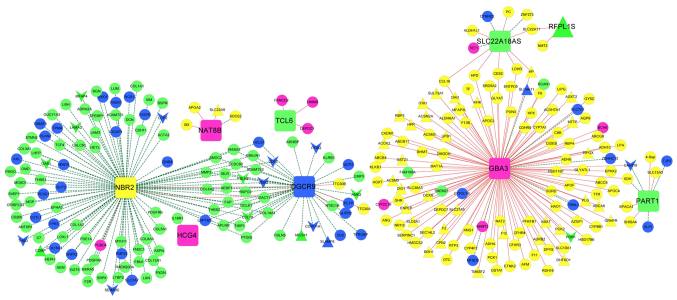
mRNAs closely associated with the nine lncRNAs were selected from the four stable modules, and an lncRNA-mRNA co-expression network was constructed (Fig. 8). In particular, phosphoenolpyruvate carboxykinase 2 (PCK2) was positively regulated by the lncRNA GBA3 in the co-expression network. The gene sets corresponding to the nine lncRNAs were separately determined with pathway enrichment analysis. The results revealed that the mRNAs associated with the nine lncRNAs were mainly enriched in ‘cell cycle’, ‘drug metabolism’, ‘peroxisome proliferator-activated receptor (PPAR) signaling pathway’, ‘cell focal adhesion’, ‘calcium signaling pathways’, and ‘endogenous cell receptor interactions’.
Figure 8.
LncRNA-mRNA co-expression network for the nine optimal lncRNAs. Squares represent lncRNAs. Regular triangles and inverted triangles separately represent consensus upregulated genes and downregulated genes. Circles represent non-consensus differentially expressed RNAs co-expressed with lncRNAs. The color of a node indicates the module involved. Red and green lines represent positive and negative co-expression associations, respectively. LncRNA, long noncoding RNA; DGCR9, DiGeorge syndrome critical region gene 9; GBA3, glucosidase, β, acid 3; HCG4, HLA complex group 4; NAT8B, N-acetyltransferase 8B; NBR2, neighbor of breast cancer 1 gene 2; PART1, prostate androgen-regulated transcript 1; RFPL1S, ret finger protein like 1 antisense RNA 1; SLC22A18AS, solute carrier family 22 member 18 antisense; TCL6, T-cell leukemia/lymphoma 6.
Discussion
In the present study, blue, magenta, yellow and green modules were screened as four stable modules by WGCNA. Additionally, the four stable modules were determined to be significantly associated with certain clinical factors, including grade, TNM stage, pathologic stage, recurrence and radiation therapy. For TCGA, GSE55092 and GSE19665, a total of 3,051 consensus DE-RNAs were identified, including 10 lncRNAs and 3,041 mRNAs. Subsequently, 14 prognosis-associated lncRNAs were selected, and a 9-lncRNA optimal combination, including DGCR9, GBA3, HCG4, NAT8B, NBR2, PART1, RFPL1S, SLC22A18AS and TCL6 was identified. A risk score system was built based on the optimal lncRNA combination, which effectively distinguished high- and low-risk individuals within the validation dataset GSE10186.
DGCR5 expression was reported to be lower in HCC serum and tissues (38); therefore, DGCR5 may function as a valuable diagnostic and prognostic marker in patients with HCC. There was a significant correlation reported between NAT2 polymorphism and HCC in smokers positive for HBV, indicating that NAT2 may be associated with HBV-associated hepatocarcinogenesis in smokers (39,40). NAT10 exhibits higher levels of expression in HCC tissues compared with peritumoral tissues (41); thus, NAT10 may be applied in the prognosis and treatment of patients with HCC. NAT10 overexpression enhances the tumorigenic activity of mutated p53 via upregulating its expression, and is correlated with the poor survival of patients, suggesting that NAT10 serves critical roles in the prognosis and therapy of p53-mutated HCC (42). Therefore, DGCR9 and NAT8B may be important in the pathology of HCC.
In the present study, PCK2 was proposed to be positively regulated by GBA3 in the lncRNA-mRNA co-expression network. The insulin signaling pathway (involving PCK2) and the ubiquitin-mediated proteolysis pathway [involving HECT, UBA and WWE domain containing 1, E3 ubiquitin protein ligase (HUWE1)] serve critical roles in hepatocarcinogenesis, and PCK2 and HUWE1 may affect the proliferation of HCC cells via involvement in the aforementioned pathways (43). Via the induction of NBR2 and adenosine 5′-monophosphate-activated protein kinase/PPARα signaling, microRNA-19a can suppress the autophagy of D-GalN/lipopolysaccharide-stimulated hepatocytes (44). SLC22A18 is a paternally imprinted gene that encodes a polyspecific organic cation transporter, which exhibits gain-of-imprinting in breast cancers and hepatocarcinomas (45). SLC22A18 is predominantly expressed in fetal and adult kidney and liver tissues; additionally, SLC22A18 and SLC22A18AS exhibit genomic imprinting in adult liver and breast tissues (46). Collectively, these studies suggest that GBA3, NBR2 and SLC22A18AS expression may affect the progression of HCC in patients.
To the best of our knowledge, no studies have previously reported associations of PART1 or TCL6 with HCC; however, PART1 and TCL6 have been linked to the prognosis of other tumors. For example, the lncRNA PART1 correlated with the overall survival and progression-free survival of patients with oral squamous cell carcinoma (47). PART1 also contributes to cell proliferation and apoptosis in prostate cancer by suppressing Toll-like receptor signaling pathways (48); therefore, PART1 may present a potential therapeutic target. Additionally, the expression of TCL6 is downregulated in clear cell renal cell carcinoma, and may be an unfavorable prognostic indicator for the disease (49). Thus, it is possible that PART1 and TCL6 may also be involved in the pathogenesis of HCC.
There are certain limitations to the present study. The constructed 9-lncRNA risk score system requires the demonstration of clinical relevance by using clinical samples obtained from an independent patient cohort. Additionally, platform differences and data heterogeneities between the downloaded datasets may affect the accuracy of the risk score system. The validation dataset, GSE10186, contained the largest number of samples with HBV infection information among the three GEO datasets; however, a greater number of samples is required for rigorous and robust analysis.
In conclusion, four stable modules and 14 prognosis-associated lncRNAs were identified. A risk score system was established based on the optimal nine lncRNAs, which may be valuable for predicting the prognosis of patients with HBV-positive HCC, and improve understanding of the pathology of HCC. Furthermore, employing the system with a larger independent cohort of patients is required for further validation.
Acknowledgements
Not applicable.
Funding
The present study was supported by the Project supported by the Presidential Foundation of the 302 Hospital of the People's Liberation Army (grant no. YNKT2014027).
Availability of data and materials
The datasets used during the current study are available from the corresponding author on reasonable request.
Authors' contributions
HL performed data analysis and wrote the manuscript. PZ, XJ, YZ, YC, TY, JW and LW contributed significantly in the interpretation and the analysis of data, and in revising the manuscript. YS conceived and designed the study. All authors read and approved the final manuscript.
Ethics approval and consent to participate
Not applicable.
Patient consent for publication
Not applicable.
Competing interests
The authors declare that they have no competing interests.
References
- 1.Llovet JM, Burroughs A, Bruix J. Hepatocellular carcinoma. Gastroenterologist. 2003;362:1907–1917. doi: 10.1016/S0140-6736(03)14964-1. [DOI] [PubMed] [Google Scholar]
- 2.Nguyen VTT, Law MG, Dore GJ. Hepatitis B-related hepatocellular carcinoma: Epidemiological characteristics and disease burden. J Viral Hepat. 2009;16:453–463. doi: 10.1111/j.1365-2893.2009.01117.x. [DOI] [PubMed] [Google Scholar]
- 3.Hiotis SP, Rahbari NN, Villanueva GA, Klegar E, Luan W, Wang Q, Yee HT. Hepatitis B vs. hepatitis C infection on viral hepatitis-associated hepatocellular carcinoma. BMC Gastroenterol. 2012;12:64. doi: 10.1186/1471-230X-12-64. [DOI] [PMC free article] [PubMed] [Google Scholar]
- 4.Waghray A, Murali AR, Menon KN. Hepatocellular carcinoma: From diagnosis to treatment. World J Hepatol. 2015;7:1020–1029. doi: 10.4254/wjh.v7.i8.1020. [DOI] [PMC free article] [PubMed] [Google Scholar]
- 5.Yuen MF, Hou JL, Chutaputti A, Asia Pacific Working Party on Prevention of Hepatocellular Carcinoma Hepatocellular carcinoma in the Asia pacific region. J Gastroenterol Hepatol. 2009;24:346–353. doi: 10.1111/j.1440-1746.2009.05784.x. [DOI] [PubMed] [Google Scholar]
- 6.Giannini EG, Farinati F, Ciccarese F, Pecorelli A, Rapaccini GL, Di Marco M, Benvegnù L, Caturelli E, Zoli M, Borzio F, et al. Prognosis of untreated hepatocellular carcinoma. Hepatology. 2015;61:184–190. doi: 10.1002/hep.27443. [DOI] [PubMed] [Google Scholar]
- 7.Jemal A, Bray F, Siegel RL, Ferlay J, Lortet-Tieulent J, Jemal A. Global cancer statistics, 2012. CA Cancer J Clin. 2015;65:87–108. doi: 10.3322/caac.21262. [DOI] [PubMed] [Google Scholar]
- 8.Beckedorff FC, Amaral MS, Deocesano-Pereira C, Verjovski-Almeida S. Long non-coding RNAs and their implications in cancer epigenetics. Biosci Rep. 2013;33:e00061. doi: 10.1042/BSR20130054. [DOI] [PMC free article] [PubMed] [Google Scholar]
- 9.Wilusz JE, Sunwoo H, Spector DL. Long noncoding RNAs: Functional surprises from the RNA world. Genes Dev. 2009;23:1494–1504. doi: 10.1101/gad.1800909. [DOI] [PMC free article] [PubMed] [Google Scholar]
- 10.Jin Y, Wu D, Yang W, Weng M, Li Y, Wang X, Zhang X, Jin X, Wang T. Hepatitis B virus × protein induces epithelial-mesenchymal transition of hepatocellular carcinoma cells by regulating long non-coding RNA. Virol J. 2017;14:238. doi: 10.1186/s12985-017-0903-5. [DOI] [PMC free article] [PubMed] [Google Scholar]
- 11.Lv D, Wang Y, Zhang Y, Cui P, Xu Y. Downregulated long non-coding RNA DREH promotes cell proliferation in hepatitis B virus-associated hepatocellular carcinoma. Oncol Lett. 2017;14:2025–2032. doi: 10.3892/ol.2017.6436. [DOI] [PMC free article] [PubMed] [Google Scholar]
- 12.Yu TT, Xu XM, Hu Y, Deng JJ, Ge W, Han NN, Zhang MX. Long noncoding RNAs in hepatitis B virus-relatedhepatocellular carcinoma. World J Gastroenterol. 2015;21:7208–7217. doi: 10.3748/wjg.v21.i23.7208. [DOI] [PMC free article] [PubMed] [Google Scholar]
- 13.Deng X, Zhao XF, Liang XQ, Chen R, Pan YF, Liang J. Linc00152 promotes cancer progression in hepatitis B virus-associated hepatocellular carcinoma. Biomed Pharmacother. 2017;90:100–108. doi: 10.1016/j.biopha.2017.03.031. [DOI] [PubMed] [Google Scholar]
- 14.Li J, Wang X, Tang J, Jiang R, Zhang W, Ji J, Sun B. HULC and Linc00152 act as novel biomarkers in predicting diagnosis of hepatocellular carcinoma. Cell Physiol Biochem. 2015;37:687–696. doi: 10.1159/000430387. [DOI] [PubMed] [Google Scholar]
- 15.Wang K, Guo WX, Li N, Gao CF, Shi J, Tang YF, Shen F, Wu MC, Liu SR, Cheng SQ. Serum LncRNAs profiles serve as novel potential biomarkers for the diagnosis of HBV-positive hepatocellular carcinoma. PLoS One. 2015;10:e0144934. doi: 10.1371/journal.pone.0144934. [DOI] [PMC free article] [PubMed] [Google Scholar]
- 16.Lu J, Xie F, Geng L, Shen W, Sui C, Yang J. Investigation of serum lncRNA-uc003wbd and lncRNA-AF085935 expression profile in patients with hepatocellular carcinoma and HBV. Tumor Biol. 2015;36:3231–3236. doi: 10.1007/s13277-014-2951-4. [DOI] [PubMed] [Google Scholar]
- 17.Nguyen QT, Lee EJ, Huang MG, Park YI, Khullar A, Plodkowski RA. Diagnosis and treatment of patients with thyroid cancer. Am Health Drug Benefits. 2015;8:30–40. [PMC free article] [PubMed] [Google Scholar]
- 18.Servant N, Roméjon J, Gestraud P, La Rosa P, Lucotte G, Lair S, Bernard V, Zeitouni B, Coffin F, Jules-Clément G, et al. Bioinformatics for precision medicine in oncology: Principles and application to the SHIVA clinical trial. Front Genet. 2014;5:152. doi: 10.3389/fgene.2014.00152. [DOI] [PMC free article] [PubMed] [Google Scholar]
- 19.Wang Z, Wu Q, Feng S, Zhao Y, Tao C. Identification of four prognostic LncRNAs for survival prediction of patients with hepatocellular carcinoma. Peerj. 2017;5:e3575. doi: 10.7717/peerj.3575. [DOI] [PMC free article] [PubMed] [Google Scholar]
- 20.Zheng H, Li P, Kwok JG, Korrapati A, Li WT, Qu Y, Wang XQ, Kisseleva T, Wang-Rodriguez J, Ongkeko WM. Alcohol and hepatitis virus-dysregulated lncRNAs as potential biomarkers for hepatocellular carcinoma. Oncotarget. 2018;9:224–235. doi: 10.18632/oncotarget.22921. [DOI] [PMC free article] [PubMed] [Google Scholar]
- 21.Yuan W, Sun Y, Liu L, Zhou B, Wang S, Gu D. Circulating LncRNAs serve as diagnostic markers for hepatocellular carcinoma. Cell Physiol Biochem. 2017;44:125–132. doi: 10.1159/000484589. [DOI] [PubMed] [Google Scholar]
- 22.Melis M, Diaz G, Kleiner DE, Zamboni F, Kabat J, Lai J, Mogavero G, Tice A, Engle RE, Becker S, et al. Viral expression and molecular profiling in liver tissue versus microdissected hepatocytes in hepatitis B virus-associated hepatocellular carcinoma. J Transl Med. 2014;12:230. doi: 10.1186/s12967-014-0230-1. [DOI] [PMC free article] [PubMed] [Google Scholar]
- 23.Deng YB, Nagae G, Midorikawa Y, Yagi K, Tsutsumi S, Yamamoto S, Hasegawa K, Kokudo N, Aburatani H, Kaneda A. Identification of genes preferentially methylated in hepatitis C virus-related hepatocellular carcinoma. Cancer Sci. 2010;101:1501–1510. doi: 10.1111/j.1349-7006.2010.01549.x. [DOI] [PMC free article] [PubMed] [Google Scholar]
- 24.Hoshida Y, Nijman SM, Kobayashi M, Chan JA, Brunet JP, Chiang DY, Villanueva A, Newell P, Ikeda K, Hashimoto M, et al. Integrative transcriptome analysis reveals common molecular subclasses of human hepatocellular carcinoma. Cancer Res. 2009;69:7385–7392. doi: 10.1158/0008-5472.CAN-09-1089. [DOI] [PMC free article] [PubMed] [Google Scholar]
- 25.Shtraizent N, DeRossi C, Nayar S, Sachidanandam R, Katz LS, Prince A, Koh AP, Vincek A, Hadas Y, Hoshida Y, et al. MPI depletion enhances O-GlcNAcylation of p53 and suppresses the Warburg effect. elife. 2017;6:e22477. doi: 10.7554/eLife.22477. [DOI] [PMC free article] [PubMed] [Google Scholar]
- 26.Bolstad BM, Irizarry RA, Astrand M, Speed TP. A comparison of normalization methods for high density oligonucleotide array data based on variance and bias. Bioinformatics. 2003;19:185–193. doi: 10.1093/bioinformatics/19.2.185. [DOI] [PubMed] [Google Scholar]
- 27.Irizarry RA, Bolstad BM, Collin F, Cope LM, Hobbs B, Speed TP. Summaries of Affymetrix GeneChip probe level data. Nucleic Acids Res. 2003;31:e15. doi: 10.1093/nar/gng015. [DOI] [PMC free article] [PubMed] [Google Scholar]
- 28.Larkin MA, Blackshields G, Brown NP, Chenna R, McGettigan PA, McWilliam H, Valentin F, Wallace IM, Wilm A, Lopez R, et al. Clustal W and Clustal X version 2.0. Bioinformatics. 2007;23:2947–2948. doi: 10.1093/bioinformatics/btm404. [DOI] [PubMed] [Google Scholar]
- 29.Zhou M, Guo M, He D, Wang X, Cui Y, Yang H, Hao D, Sun J. A potential signature of eight long non-coding RNAs predicts survival in patients with non-small cell lung cancer. J Transl Med. 2015;13:231. doi: 10.1186/s12967-015-0556-3. [DOI] [PMC free article] [PubMed] [Google Scholar]
- 30.Zhou M, Xu W, Yue X, Zhao H, Wang Z, Shi H, Cheng L, Sun J. Relapse-related long non-coding RNA signature to improve prognosis prediction of lung adenocarcinoma. Oncotarget. 2016;7:29720–29738. doi: 10.18632/oncotarget.8825. [DOI] [PMC free article] [PubMed] [Google Scholar]
- 31.Langfelder P, Horvath S. WGCNA: An R package for weighted correlation network analysis. BMC Bioinformatics. 2008;9:559. doi: 10.1186/1471-2105-9-559. [DOI] [PMC free article] [PubMed] [Google Scholar]
- 32.Qi C, Hong L, Cheng Z, Yin Q. Identification of metastasis-associated genes in colorectal cancer using metaDE and survival analysis. Oncol Lett. 2016;11:568–574. doi: 10.3892/ol.2015.3956. [DOI] [PMC free article] [PubMed] [Google Scholar]
- 33.Wang X, Kang DD, Shen K, Song C, Lu S, Chang LC, Liao SG, Huo Z, Tang S, Ding Y, et al. An R package suite for microarray meta-analysis in quality control, differentially expressed gene analysis and pathway enrichment detection. Bioinformatics. 2012;28:2534–2536. doi: 10.1093/bioinformatics/bts485. [DOI] [PMC free article] [PubMed] [Google Scholar]
- 34.Wang P, Wang Y, Hang B, Zou X, Mao JH. A novel gene expression-based prognostic scoring system to predict survival in gastric cancer. Oncotarget. 2016;7:55343–55351. doi: 10.18632/oncotarget.10533. [DOI] [PMC free article] [PubMed] [Google Scholar]
- 35.Goeman JJ. L1 penalized estimation in the Cox proportional hazards model. Biom J. 2010;52:70–84. doi: 10.1002/bimj.200900028. [DOI] [PubMed] [Google Scholar]
- 36.Knafl GJ, Dixon JK, O'Malley JP, Grey M, Deatrick JA, Gallo A, Knafl KA. Scale development based on likelihood cross-validation. Stat Methods Med Res. 2012;21:599–619. doi: 10.1177/0962280210391444. [DOI] [PMC free article] [PubMed] [Google Scholar]
- 37.Tilford CA, Siemers NO. Gene set enrichment analysis. Methods Mol Biol. 2009;563:99–121. doi: 10.1007/978-1-60761-175-2_6. [DOI] [PubMed] [Google Scholar]
- 38.Huang R, Wang X, Zhang W, Zhangyuan G, Jin K, Yu W, Xie Y, Xu X, Wang H, Sun B. Down-regulation of LncRNA DGCR5 correlates with poor prognosis in hepatocellular carcinoma. Cell Physiol Biochem. 2016;40:707–715. doi: 10.1159/000452582. [DOI] [PubMed] [Google Scholar]
- 39.Yu MW, Yang SY, Yang SY, Hsiao TJ, Chang HC, Lin SM, Liaw YF, Chen PJ, Chen CJ. Role of N-acetyltransferase polymorphisms in hepatitis B related hepatocellular carcinoma: Impact of smoking on risk. Gut. 2000;47:703–709. doi: 10.1136/gut.47.5.703. [DOI] [PMC free article] [PubMed] [Google Scholar]
- 40.Zhang J, Xu F, Ouyang C. Joint effect of polymorphism in the N-acetyltransferase 2 gene and smoking on hepatocellular carcinoma. Tumor Biol. 2012;33:1059–1063. doi: 10.1007/s13277-012-0340-4. [DOI] [PubMed] [Google Scholar]
- 41.Zhang X, Liu J, Yan S, Huang K, Bai Y, Zheng S. High expression of N-acetyltransferase 10: A novel independent prognostic marker of worse outcome in patients with hepatocellular carcinoma. Int J Clin Exp Pathol. 2015;8:14765–14771. [PMC free article] [PubMed] [Google Scholar]
- 42.Li Q, Liu X, Jin K, Lu M, Zhang C, Du X, Xing B. NAT10 is upregulated in hepatocellular carcinoma and enhances mutant p53 activity. BMC Cancer. 2017;17:605. doi: 10.1186/s12885-017-3570-4. [DOI] [PMC free article] [PubMed] [Google Scholar]
- 43.Liu YX, Zhang SF, Ying-Hua JI, Guo SJ, Wang GF, Zhang GW. Whole-exome sequencing identifies mutated PCK2 and HUWE1 associated with carcinoma cell proliferation in a hepatocellular carcinoma patient. Oncol Lett. 2012;4:847–851. doi: 10.3892/ol.2012.825. [DOI] [PMC free article] [PubMed] [Google Scholar]
- 44.Liu YM, Ma JH, Zeng QL, Lv J, Xie XH, Pan YJ, Yu ZJ. MiR-19a affects hepatocyte autophagy via regulating lncRNA NBR2 and AMPK/PPARα in D-GalN/lipopolysaccharide--stimulated hepatocytes. J Cell Biochem. 2017;119:358–365. doi: 10.1002/jcb.26188. [DOI] [PubMed] [Google Scholar]
- 45.Ali AM, Bajaj V, Gopinath KS, Kumar A. Characterization of the human SLC22A18 gene promoter and its regulation by the transcription factor Sp1. Gene. 2009;429:37–43. doi: 10.1016/j.gene.2008.10.004. [DOI] [PubMed] [Google Scholar]
- 46.Martin-kleiner I, Radetić M, Grbeša I, Parazajder D, Kovačić M, Radetić M, Trošelj KG. Proceedings of the Congress of the Croatian Society of Biochemistry and Molecular Biology with international participation (HDBMB 2008) Croatian Society of Biochemistry and Molecular Biology; Zagreb: 2008. The analysis of the SLC22A18 gene and its natural antisense transcripts in human papillary thyroid tumors. [Google Scholar]
- 47.Li S, Chen X, Liu X, Yu Y, Pan H, Haak R, Schmidt J, Ziebolz D, Schmalz G. Complex integrated analysis of lncRNAs-miRNAs-mRNAs in oral squamous cell carcinoma. Oral Oncol. 2017;73:1–9. doi: 10.1016/j.oraloncology.2017.07.026. [DOI] [PubMed] [Google Scholar]
- 48.Sun M, Geng D, Li S, Chen Z, Zhao W. LncRNA PART1 modulates toll-like receptor pathway to influence cell proliferation and apoptosis in prostate cancer cells. Biol Chem. 2018;399:387–395. doi: 10.1515/hsz-2017-0255. [DOI] [PubMed] [Google Scholar]
- 49.Su H, Sun T, Wang H, Shi G, Zhang H, Sun F, Ye D. Decreased TCL6 expression is associated with poor prognosis in patients with clear cell renal cell carcinoma. Oncotarget. 2017;8:5789–5799. doi: 10.18632/oncotarget.11011. [DOI] [PMC free article] [PubMed] [Google Scholar]
Associated Data
This section collects any data citations, data availability statements, or supplementary materials included in this article.
Data Availability Statement
The datasets used during the current study are available from the corresponding author on reasonable request.


