

Abstract
Obesity is a major risk factor for metabolic disease. Growth differentiation factor 15 (GDF15) has shown promise as a weight loss agent for obesity in animal studies. In healthy lean humans, fasting plasma GDF15 increases after acute exercise. However, the role of GDF15 in human obesity and the response of plasma GDF15 to exercise training in patients with obesity is unknown. Here, 24 sedentary volunteers with obesity [age: 65 ± 1 yr; body mass index (BMI): 35.3 ± 0.9 kg/m2] participated in a supervised 12-wk aerobic exercise intervention: 1 h/day, 5 days/wk at ~85% maximum heart rate with controlled isocaloric diet. As a result, plasma GDF15 was significantly increased (PRE: 644.1 ± 42.6 pg/ml, POST: 704.4 ± 47.2 pg/ml, P < 0.01) after the exercise intervention. Inconsistent with animal models, ΔGDF15 was not correlated with change in weight, BMI, or resting energy expenditure. However, ΔGDF15 was correlated with a reduction in total fat mass (P < 0.05), abdominal fat mass (P < 0.05), and android fat mass (P ≤ 0.05). Participants with a positive GDF15 response to exercise had increased total fat oxidation (PRE: 0.25 ± 0.05 mg·kg−1·min−1, POST: 0.43 ± 0.07 mg·kg−1·min−1, P ≤ 0.05), metabolic flexibility [PRE: −0.01 ± 0.01 delta respiratory quotient (RQ), POST: 0.06 ± 0.01 delta RQ, P < 0.001], and insulin sensitivity (PRE: 0.33 ± 0.01 QUICKI index, POST: 0.34 ± 0.01 QUICKI index, P < 0.01), suggesting a link between GDF15 and fat mass loss as well as exercise-induced metabolic improvement in humans with obesity. We conclude that the exercise-induced increase in plasma GDF15 and the association with reduced fat mass may indicate a role for GDF15 as a therapeutic target for human obesity.
Keywords: exercise, fat mass loss, GDF15, obesity
INTRODUCTION
Obesity is a major worldwide health and economic burden that continues to increase in prevalence. Body fat accumulation increases the risk of developing metabolic syndrome (13), cardiovascular disease (21), type 2 diabetes (21), and cancer (29). Current treatment options for obesity are limited and are subject to their own limitations, especially for elderly adults with obesity. Novel pharmacological candidates for obesity treatment represent an important and unmet need.
Growth differentiation factor 15 (GDF15) is a promising candidate for obesity pharmacotherapy, as it may have a role in appetite suppression via the hind brain/gut axis. Infusion of recombinant GDF15 protein, or global overexpression of GDF15, has been shown to reduce food intake and body weight, and increase energy balance in HFD-induced obese mice (2) and primates (30). GDF15 also modulates metabolic activity by increasing gene expression of key thermogenic and lipolytic genes in brown and white adipose tissue (2). Furthermore, knockout of GDF15 in rodents increases body weight and causes a deterioration in glucose tolerance and insulin sensitivity (3). As a member of the transforming growth factor-β (TGF-β) family, the active form of the GDF15 dimer is secreted by various organs, including the liver, kidney, prostate, and brain (5). Circulating GDF15 binds to GDNF family receptor alpha like (GFRAL) and the receptor tyrosine-protein kinase (RET) co-receptor leading to activation of protein kinase B (AKT), extracellular signal-related kinase (ERK), and phospholipase C (PLC) pathways in the central nervous system. As a result, both energy intake and body weight are reduced in obese mice (4, 16, 31).
These previous animal studies provide strong preclinical evidence that GDF15 is effective for weight and fat mass loss. Whether this occurs in humans is unknown. Circulating levels of GDF15 are elevated in humans with obesity (26). It remains unclear whether GDF15 is a risk factor that contributes to the obesogenic progression or instead is a compensatory factor combating weight gain. There are very few reports on GDF15 in humans; however, studies have shown that circulating GDF15 increases after acute exercise in young, healthy, moderately active males (12) and after 35 days of training in elite rugby players (7), confirming the inducibility of GDF15 through exercise in men. Whether long-term exercise training alters GDF15 expression in human obesity, and to what extent any exercise-induced alterations in GDF15 might be associated with metabolic improvements following exercise training, is currently unclear.
The purpose of this study was to examine the effects of exercise training on GDF15 and the relationships between GDF15 and exercise-induced weight loss in humans with obesity. We hypothesized that exercise training would increase GDF15 levels in humans with obesity. Second, we hypothesized that increases in GDF15 would be associated with reductions in body weight and/or body composition.
METHODS
Subject information.
Twenty-four previously sedentary, weight-stable adults with obesity [body mass index (BMI): 35.3 ± 0.9 kg/m2] completed a 12-wk aerobic exercise training intervention using a parallel-group, repeated-measures design. All participants underwent comprehensive medical screening. Individuals with heart, kidney, liver, thyroid, intestinal, and/or pulmonary disease or those taking medications or dietary supplements known to affect the outcome variables were excluded. All female subjects were postmenopausal and were not using hormone replacement therapy before or during the study. Prior sedentary status (leisure-time activity below 300 kcal/day) was confirmed using the Minnesota Leisure Time Physical Activity questionnaire. Subjects self-reported weight stability (±2.5 kg) for at least 6 mo before enrollment. Personalized dietary requirements were determined using the Harris-Benedict equation derived from basal metabolic rates (ventilated-hood indirect calorimetry) and a sedentary activity factor of 1.2 (8). Resting ECG and submaximal exercise stress tests were used to exclude individuals contraindicated to physical activity. The study was approved by the Cleveland Clinic Institutional Review Board, and all subjects provided written informed consent in accordance with our guidelines for the protection of human subjects.
Exercise intervention and dietary prescription.
Exercise training was fully supervised and consisted of 60 min of aerobic exercise, performed on a treadmill and/or cycle ergometer, 5 days/wk for 12 wk. Exercise intensity was maintained at ~85% of the maximum heart rate obtained during an incremental maximal aerobic exercise test. Maximal oxygen consumption (V̇o2max; Jaeger Oxycon Pro, Viasys, Yorba Linda, CA) was determined as previously described (11). The test was deemed satisfactory if more than two of the following criteria were simultaneously achieved: plateau in oxygen consumption with increasing workloads, volitional fatigue, a heart rate within 10 beats/min of the age-predicted maximum, or a respiratory exchange ratio >1.10.
To ensure appropriate exercise intensity corresponding to the participants’ fitness changes, additional V̇o2max tests were performed at weeks 4 and 8. Preintervention V̇o2max tests were conducted >48 h before the metabolic measurement to control for acute effects of exercise. Exercise compliance was expressed as the percent of attended sessions to total number of prescribed exercise sessions. Personalized eucaloric diets were formulated by a registered dietitian and were prepared and provided to all participants. Dietary adherence was maintained via daily food container weigh backs and a daily food log in addition to a weekly diet counseling session. Nutritionist Pro software (Axxya Systems, Stafford, TX) was used for dietary analysis. Dietary compliance was calculated as follows: 100% × the mean of actual total energy intake, kcal/day divided by the mean of total calories provided (screening resting metabolic rate × 1.2).
Prior to all metabolic testing physical activity and diet were controlled during a 3-day inpatient stay in the Clinical Research Unit at the Cleveland Clinic. Body composition assessment, exercise measures, and metabolic testing were performed during the inpatient stay. During the postintervention inpatient stay, participants continued their exercise and diet as prescribed. On the third day, metabolic measures were performed ~16 h after the last exercise session.
Body composition.
Body composition was measured as previously described (11). Briefly, height and body weight were measured by standard techniques. Whole body adiposity (fat mass and fat-free mass), android fat (%), and gynoid fat (%) were measured by dual-energy X-ray absorptiometry (model iDXA, GE Healthcare - Lunar, Madison, WI). Computerized tomography scanning was used to quantify subcutaneous and visceral abdominal adiposity with a SOMATOM Sensation 16 Scanner (Siemens Medical Solutions, Malvern, PA) as previously described (17).
Substrate metabolism.
Indirect calorimetry (Vmax Encore, Viasys) measures were also performed for determination of substrate metabolism and resting energy expenditure during the 3-day inpatient stay pre- and postintervention as previously described (19). Briefly, on the second day of the inpatient stay and after an overnight fast, subjects were taken by wheelchair to void and to be weighed and then reclined in a semi-darkened, thermoneutral environment. Subjects were placed under a clear plastic hood, and expired air was collected over a 30-min time period (basal condition) as well as during the last 30 min of the hyperinsulinemic euglycemic clamp (insulin-stimulated condition).
Respiratory quotient (RQ) was calculated as the ratio of O2 consumed to CO2 produced. Resting energy expenditure was calculated using the Weir equation (28). Urinary nitrogen excretion measurements and substrate oxidation rates were calculated as previously described (6). In brief, urine was collected from and until completion of the calorimetry measures. Total volume and time of collection were recorded, and aliquots were analyzed for urea nitrogen (Roche Modular Diagnostics, Indianapolis, IN). Metabolic flexibility was calculated as ΔRQ at basal metabolic state and during the final 30 min of the hyperinsulinemic euglycemic clamp.
Insulin sensitivity.
Insulin sensitivity was measured by hyperinsulinemic euglycemic (40 mU·m−2·min−1, 90 mg/dl) clamp with isotopic labeling of [6,6 D2] glucose as previously described (20). Insulin sensitivity was defined as steady-state glucose metabolism relative to the prevailing insulin concentration (M/I) and the rate of glucose disposal (Rd). The QUICKI formula was also used as a secondary assessment of insulin sensitivity (QUICKI = 1/[log(I(0)) + log(G(0))]) from the oral glucose tolerance test (OGTT). I(0) is the average of the baseline insulin for the first 30 min, and G(0) is the average of the baseline glucose for the first 30 min (10). OGTT (75 g oral glucose) was performed at 0800 after an overnight fast. Blood samples were drawn from an antecubital vein at baseline and at 30, 60, 90, 120, 150, and 180 min time points.
Biochemical analyses.
Plasma GDF15 concentrations were measured via ELISA (R&D Systems, Minneapolis, MN). Plasma glucose concentrations were determined using a glucose oxidase assay (YSI 2300 STAT Plus analyzer, Yellow Springs Instruments, Yellow Springs, OH), and plasma insulin concentrations were measured via radioimmunoassay (Millipore, Billerica, MA). Plasma triglycerides and cholesterol were analyzed by enzymatic methods on an automated platform (Roche Modular Diagnostics). Glycated hemoglobin (HbA1c) was measured via nonporous ion exchange high-performance liquid chromatography (G7 HPLC Analyzer, Tosoh Bioscience). All samples were measured in duplicate, and each participant’s pre- and postintervention samples were batch analyzed.
Statistics.
Prism v7 (GraphPad, San Diego, CA) and SAS v9.4 (Cary, NC) were used for statistical analyses. Two-tailed paired t-tests were used to compare differences pre- and postintervention. A repeated-measures linear model was used to estimate group differences in responders, defined as exercise-induced GDF15 increases) versus nonresponders. This model, containing effects for time, grouping (responders vs. nonresponders), and fat mass, accounts for the subject’s internal variability and allows comparisons of both within- and between-group effects. Post hoc analyses were conducted using Bonferroni's multiple comparisons test whenever the interaction of time and grouping was significant and paired t-tests were used to compare within-group means. Normality of the residuals from these models was assessed with a Shapiro-Wilk test and a D'Agostino & Pearson omnibus test. The delta change in study outcomes was calculated as post (raw value) minus pre (raw value). Pearson’s correlation was used to examine associations for data that were normally distributed. Spearman’s rank correlation was used to identify relationships in nonparametric data. Significance was accepted as P ≤ 0.05. Data are expressed as mean ± SE.
RESULTS
Compliance to the exercise intervention.
Subject compliance to the 12-wk intervention was 95.07%. Based on dietary logs, 99.52% of prescribed food intake was consumed.
Anthropometric and biochemical responses to the exercise intervention.
As shown in Table 1, HbA1c and HDL remained unchanged, whereas body weight (P < 0.0001), BMI (P < 0.0001), fasting plasma glucose (P < 0.01), triglycerides (P < 0.01), total cholesterol (P < 0.01), VLDL (P < 0.0001), and LDL (P = 0.01) all decreased. V̇o2max (P < 0.0001), M/I (P < 0.0001), Rd (P < 0.001), and QUICKI (P < 0.001) were increased following exercise training.
Table 1.
Subject Characteristics
| Characteristics | Preintervention | Postintervention | P Value (paired t-test) |
|---|---|---|---|
| n, men, women | (24, 11, 13) | (24, 11, 13) | |
| Age, yr | 65.3 ± 0.9 | ||
| Weight, kg | 98.5 ± 3.1 | 90.5 ± 2.6 | <0.0001 |
| BMI, kg/m2 | 35.3 ± 0.9 | 32.3 ± 0.9 | <0.0001 |
| Glucose, mg/dl | 105.6 ± 3.0 | 95.1 ± 2.1 | <0.0001 |
| HbA1C, % | 5.6 ± 0.1 | 5.6 ± 0.1 | 0.26 |
| TG, mg/dl | 140.8 ± 14.6 | 97.6 ± 8.2 | <0.0001 |
| Cholesterol, mg/dl | 199.3 ± 7.8 | 169.5 ± 8.9 | <0.0001 |
| VLDL, mg/dl | 28.2 ± 2.9 | 19.5 ± 1.6 | <0.0001 |
| LDL, mg/dl | 123.4 ± 6.0 | 110.6 ± 5.8 | 0.01 |
| HDL, mg/dl | 47.7 ± 2.8 | 46.0 ± 2.6 | 0.14 |
| V̇o2max, ml·kg−1·min−1 | 20.9 ± 0.8 | 26.5 ± 1.2 | <0.0001 |
| V̇o2max, ml·kg FFM−1·min−1 | 38.1 ± 1.0 | 44.1 ± 1.3 | <0.0001 |
| M/I, mg/kg/min/µUml | 0.03 ± 0.003 | 0.05 ± 0.005 | <0.0001 |
| Basal Rd, mg·kg−1·min−1 | 2.2 ± 0.2 | 1.4 ± 0.3 | <0.001 |
| Insulin-stimulated Rd, mg/kg/min | 2.6 ± 0.3 | 4.1 ± 0.4 | <0.0001 |
| QUICKI index | 0.32 ± 0.004 | 0.33 ± 0.004 | <0.001 |
Values are means ± SE; n = no. of subjects. BMI, body mass index; FFM, fat-free mass; HbA1c, glycated hemoglobin; M/I, insulin sensitivity assessed using euglycemic clamp; QUICKI, insulin sensitivity index assessed using OGTT; Rd, rate of glucose disposal; TG, triglyceride; V̇o2max, maximal oxygen consumption.
Body composition, energy expenditure, and GDF-15 responses to exercise training.
As displayed in Table 2, exercise training led to reductions in total and regional fat mass. The reduction in total fat mass (P < 0.0001) included decreases in both subcutaneous fat and visceral fat (P < 0.0001). Absolute fat-free mass (kg) also decreased (P = 0.03), whereas total-body fat-free mass (fat-free mass %) increased (Fig. 1C, P < 0.01). No significant changes were observed in resting respiratory exchange ratios, energy expenditure, or basal oxidation rate [whole body fat oxidation (FOX), whole body carbon oxidation, whole body protein oxidation] pre- to postintervention.
Table 2.
Changes in body composition, energy expenditure, and substrate oxidation.
| Characteristics | Preintervention | Postintervention | P Value (paired t-test) |
|---|---|---|---|
| DEXA | |||
| Fat mass, kg | 44.3 ± 1.6 | 37.1 ± 1.8 | <0.0001 |
| Fat-free mass, kg | 54.2 ± 2.4 | 53.4 ± 2.4 | 0.03 |
| CT | |||
| Total abdominal fat, cm2 | 602.9 ± 24.0 | 497.6 ± 27.1 | <0.0001 |
| Total subcutaneous fat, cm2 | 484.2 ± 24.4 | 417.5 ± 25.2 | <0.0001 |
| Superficial subcutaneous fat, cm2 | 245.3 ± 14.7 | 237.9 ± 18.1 | 0.34 |
| Deep subcutaneous fat, cm2 | 238.9 ± 14.7 | 179.6 ± 11.0 | <0.0001 |
| Visceral fat, cm2 | 118.7 ± 15.4 | 80.1 ± 10.9 | <0.0001 |
| RER | 0.9 ± 0.001 | 0.9 ± 0.008 | 0.30 |
| EE*103, kcal·kg−1·min−1 | 10.8 ± 0.2 | 11.2 ± 0.3 | 0.13 |
| FOX, mg·kg−1·min−1 | 0.3 ± 0.04 | 0.4 ± 0.1 | 0.38 |
| COX, mg·kg−1·min−1 | 1.3 ± 0.1 | 1.1 ± 0.1 | 0.26 |
| POX, mg·kg−1·min−1 | 0.7 ± 0.1 | 0.8 ± 0.1 | 0.20 |
Values are means ± SE. COX, whole body carbon oxidation; CT, computed tomography; DEXA, dual-energy X-ray absorptiometry; EE, energy expenditure; FOX, whole body fat oxidation; POX, whole body protein oxidation; RER, respiratory exchange ratio.
Fig. 1.

Plasma GDF15 increased following 12 wk of aerobic exercise training, P < 0.01, n = 24 (A). Individual responses in the fasting plasma GDF15 (pg/ml) level before and after exercise training intervention (B). Percentage fat-free mass increased postexercise training (C); whole body percentage fat mass, android fat mass, and abdominal fat mass decreased postexercise training (D–F). The increase in fat-free mass was positively correlated with the delta change in GDF15 postexercise training, rho = 0.48, P < 0.05 (G); the Δfat mass (rho = −0.44, P < 0.05), Δandroid fat (rho = −0.42, P ≤ 0.05), Δabdominal fat were correlated with ΔGDF15 (r = −0.48, P < 0.05) (H–J). FFM, fat-free mass; GDF15, growth differentiation factor 15; Post, after exercise intervention; Pre, before exercise intervention; V̇o2max, maximal oxygen consumption.
Importantly, exercise training increased fasting plasma GDF15 (Pre: 644.11 ± 42.55 pg/ml; Post: 704.37 ± 47.19 pg/ml; P < 0.01, Fig. 1A). Examination of the individual GDF15 responses revealed that GDF15 increased in 14 of 24 subjects (Fig. 1B). Furthermore, when normalized to fat-free mass, GDF15 remained significantly increased (Pre: 12.34 ± 0.93 pg·ml−1·kg−1; Post: 13.59 ± 0.97 pg·ml−1·kg−1; P < 0.01, data not shown). In addition to increased fat-free mass as described above, fat mass (Fig. 1D), android fat (Fig. 1E), and abdominal fat were decreased (Fig. 1F). Although there was no association between the change in plasma GDF15 and body weight or BMI, there was a significant inverse correlation between the change in plasma GDF15 and the change in total fat mass (rho = −0.44, P < 0.05, Fig. 1H). In addition, the change in total abdominal fat (r = −0.48, P < 0.05, Fig. 1J) and android fat (rho = −0.42, P ≤ 0.05, Fig. 1I) were also inversely correlated with the change in plasma GDF15. Subsequent statistical outlier analysis led to the exclusion of fat mass and android fat data for one participant (data not shown). Statistical analyses revealed trending associations between the change in GDF15 and changes in total fat mass (rho = −0.40, P = 0.06, n = 23) and android fat (rho = −0.37, P = 0.09, n = 23).
Subgroup analyses.
Subgroup analyses were performed based on the change in plasma GDF15 pre- to postintervention (Fig. 1B). This approach yielded “responders” (increased GDF15 postintervention, n = 14, mean delta change: 133.0 ± 17.7 pg/ml, 22.8 ± 3%, P < 0.01) and “nonresponders” (decreased GDF15 level postintervention, n = 10, mean delta change: −41.6 ± 9.2 pg/ml, −6.0 ±1.2%, P < 0.01). There was no significant difference in baseline plasma GDF15 level, age, BMI, weight, fat mass, or fat-free mass between responders versus nonresponders (Table 3). Participants in the responder subgroup had higher levels of baseline aerobic fitness and respiratory exchange ratio and lower FOX, metabolic flexibility, and HbA1c levels compared with nonresponders. Men tended to be responders (9 of 11), whereas women tended to be nonresponders (8 of 13) (Table 3). The exercise training intervention reduced fat mass (Fig. 2B) in both groups, without altering fat-free mass (Fig. 2A). However, when examining regional fat, both the subcutaneous fat and visceral fat mass revealed a significantly greater reduction in the responder group compared with the nonresponders (P < 0.05; Fig. 2, C and D). Also, after adjusting for fat mass in a linear regression model, total cholesterol (P < 0.01) and LDL were reduced only in the responder group post intervention (P < 0.05) (Fig. 2, E and F). The interaction of cholesterol (F = 3.51, P = 0.07) and LDL (F = 3.88, P = 0.06) were marginally trending toward statistical significance.
Table 3.
Baseline level: nonresponders versus responders
| Characteristics | Nonresponders | Responders | P Value |
|---|---|---|---|
| n, men, women | (10, 2, 8) | (14, 9, 5) | 0.03* |
| Age, yr | 65 ± 1 | 66 ± 1 | 0.47 |
| Body weight, kg | 96.97 ± 6.49 | 99.55 ± 2.72 | 0.69 |
| BMI, kg/m2 | 35.16 ± 1.61 | 35.34 ± 1.03 | 0.92 |
| Fat mass, kg | 44.78 ± 2.48 | 43.93 ± 2.26 | 0.80 |
| Fat mass, % | 46.59 ± 1.35 | 44.20 ± 2.05 | 0.38 |
| Fat-free mass, kg | 52.19 ± 4.56 | 55.62 ± 2.66 | 0.50 |
| Fat-free mass, % | 53.41 ± 1.35 | 55.80 ± 2.05 | 0.38 |
| Plasma GDF15, pg/ml | 654.07 ± 56.37 | 636.99 ± 62.54 | 0.85 |
| RER | 0.84 ± 0.01 | 0.88 ± 0.01 | 0.04 |
| FOX, mg·kg FFM−1·min−1 | 0.44 ± 0.06 | 0.25 ± 0.05 | 0.01 |
| Metabolic flexibility | 0.03 ± 0.01 | 0.01 ± 0.01 | 0.01 |
| HbA1C | 6.03 ± 0.23 | 5.39 ± 0.15 | 0.03 |
| V̇o2max, ml·kg FFM−1·min−1 | 35.36 ± 1.53 | 40.09 ± 1.02 | 0.02 |
Values are means ± SE; n = no. of subjects. BMI, body mass index; FFM, fat-free mass; GDF15, GDF15, growth differentiation factor 15; FOX, whole body fat oxidation; RER, respiratory exchange ratio; V̇o2max, maximal oxygen consumption.
Sex difference.
Fig. 2.
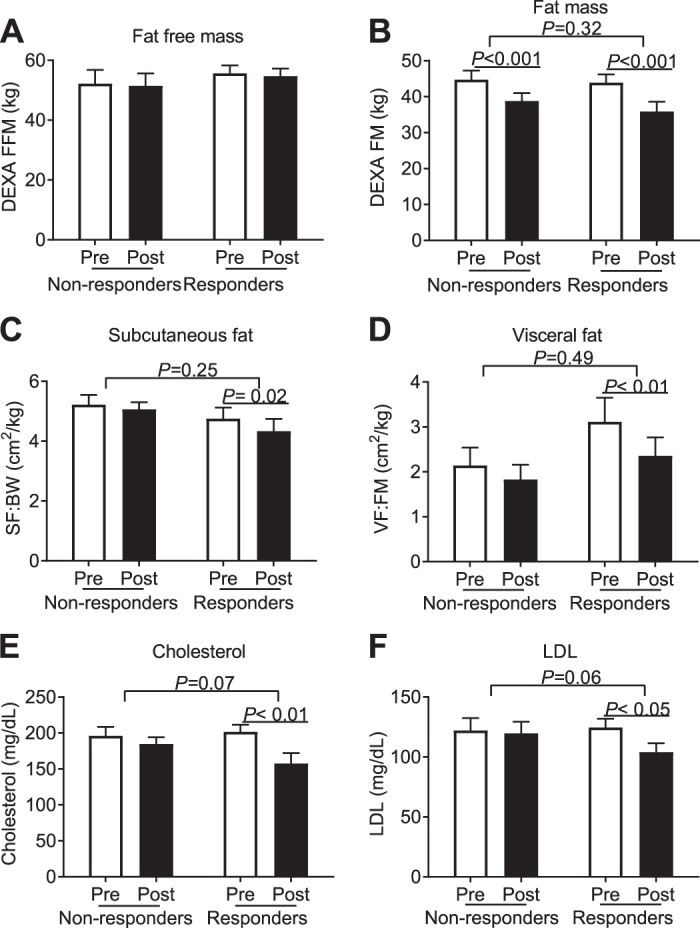
Difference in nonresponders (decreased GDF15 level postintervention) vs. responders (increased GDF15 level postintervention). Data were analyzed by two-way ANOVA. Raw value was used for plotting the figures, P value shown is the result of a repeated-measure linear model to estimate group differences in nonresponders vs. responders. Fat-free mass was not changed across the groups (A); fat mass was reduced in the combined groups, P < 0.001 (B). Subcutaneous fat to body weight ratio was significantly reduced in the responder group, P < 0.05 (C). Visceral fat to fat mass ratio was reduced in the responder group (D). Cholesterol and LDL were only decreased in the responder group, P < 0.001, P < 0.01, respectively (E and F). DEXA, dual-energy X-ray absorptiometry; DEXA FFM, fat-free mass measured by DEXA; DEXA FM, fat mass measured by DEXA; GDF15, growth differentiation factor 15; LDL, low density lipids; Post, after exercise intervention; Pre, before exercise intervention; SF:BW, subcutaneous fat:body weight; VF:FM, visceral fat:fat mass.
The metabolic divergence of responders and nonresponders is shown in Fig. 3. Before adjusting for fat mass, the responder group had a significantly greater increase in whole body FOX (P ≤ 0.05). After adjusting for fat mass in a linear regression model, the exercise intervention revealed a relative improvement in FOX in the responders compared with the nonresponders; interaction by two-way ANOVA analysis for FOX was statistically significant (F = 5.84, P = 0.02). As for metabolic flexibility, after adjusting for fat mass in a linear regression model, the responder group started with a lower level pre-intervention (P = 0.01) and had a significant increase post-intervention (P < 0.001), but the interaction was borderline significant (F = 3.9, P = 0.06). After adjusting for fat mass in a linear regression model, the insulin sensitivity derived from OGTT was increased in the responder group pre- to postintervention (P = 0.06, Fig. 3, B and C), and subjects in the responder group had a higher insulin sensitivity postintervention compared with nonresponders (P = 0.05). The exercise training intervention increased clamp-derived insulin sensitivity in both the responder and nonresponder groups (data not shown); however, there was no statistical difference between groups.
Fig. 3.
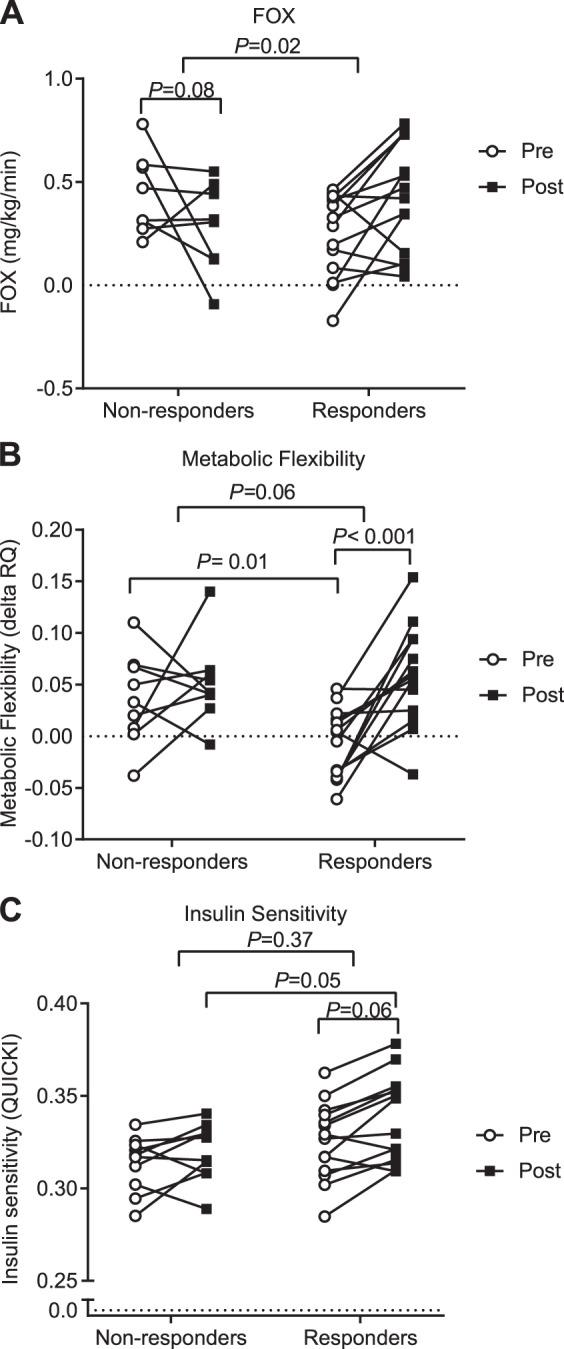
Individual responses are shown for both nonresponder and responder groups. Data were analyzed by two-way ANOVA. Raw values are plotted; the P value shown is the result of a repeated-measures linear model after adjusting for fat mass in a linear regression model to estimate group differences in nonresponders vs. responders. After adjusting for fat mass in a linear regression model, FOX is tending to decrease in the nonresponder group, P = 0.08 (A). Nonresponders had a greater metabolic flexibility at baseline, P = 0.01, whereas the responder group had a more significant increase in metabolic flexibility with exercise training, P < 0.001 (B). For insulin sensitivity, after adjusting for fat mass, there was no change in group differences, but responders had a higher insulin sensitivity postintervention, P = 0.05, and tended to have increased insulin sensitivity postintervention, P = 0.06 (C). P ≤ 0.05 is considered significant. FOX, whole body fat oxidation rate; Post, after exercise intervention; Pre, before exercise intervention; QUICKI, insulin sensitivity index; RQ, respiratory quotient.
DISCUSSION
We provide the first carefully controlled study examining the effects of a long-term exercise training intervention on circulating GDF15 levels in sedentary humans with obesity. Previous studies report elevated GDF15 after acute exercise or short-term training, including a 245-km ultramarathon race (22), 1 h of bicycle exercise (12), or 35 days of intense physical training in elite rugby players (7). However, those studies were performed in healthy, physically fit subjects, some were short in duration, and GDF15 was measured after both meal and exercise, with the effect of food intake not being completely excluded (18). In addition, neither the response of GDF15 to exercise training in subjects with obesity, nor the association of GDF15 with metabolism in humans with obesity has been previously assessed. Here, we extend these data from previous acute and short-term exercise studies to show that 12 wk of aerobic exercise training can increase plasma GDF15. According to earlier studies (1, 26), GDF15 is positively associated with age and BMI. The subjects described here are comprised of an older population with obesity; thus, baseline GDF15 levels were likely elevated before the intervention. This, in turn, makes the 9% increase in GDF15 postintervention all the more striking. A closer analysis of our data revealed a potential sex divergence in plasma GDF15 pre- to postintervention. In addition, a higher preintervention V̇o2max level in the responder group suggests that aerobic fitness levels may predict exercise-training-induced GDF15 responses. Further investigations into the role of sex and fitness levels and GDF15 responses are warranted.
Emerging evidence from animal studies suggests a therapeutic role for GDF15 in obesity. Body weight in obese monkeys (30) and mice (2) is significantly reduced following administration of recombinant GDF15. Even in the absence of a high-fat diet, greater fat mass and body weight were observed in mice lacking GDF15, which was rescued by GDF15 infusion (24). One of the proposed mechanisms for GDF15-induced weight loss involves the binding of GDF15 to GFRAL and the RET receptor, followed by activation of AKT, ERK, and PLC pathways, which may invoke a role in appetite suppression via the hind brain/gut axis (16). In cancer patients, GDF15 has been shown to play a role in anorexia-cachexia syndrome (23). However, a decrease in food intake may not be the sole mechanism for GDF15-induced weight loss, and whether GDF15 directly affects human body composition and body weight is still unknown. In our study, we controlled for the effect of food intake by providing participants with a eucaloric diet throughout the study period and by providing ongoing face-to-face contact with study personnel, including our research dietitians. Furthermore, plasma GDF15 was measured under fasting conditions. Inconsistent with previous animal studies, we did not observe an association between the change in GDF15 and change in body weight or BMI (data not shown). However, the percent decrease in fat mass and the reduction in abdominal fat and android fat were associated with upregulation of GDF15 after the intervention. Excessive abdominal fat and android fat are known to be risk factors for obesity-related comorbidities, including cardiovascular disease, type 2 diabetes, insulin resistance, and some cancers. Consistent with the correlation data, we observed that subcutaneous fat, visceral fat, cholesterol, and LDL were significantly reduced in the responder group, indicating that GDF15 may have an effect on exercise-induced fat mass loss and may play a role in reducing cardiovascular risk in obese populations. In addition, the greater improvement in whole body fat oxidation and metabolic flexibility in the responder group may provide some clues to explain the mechanism regarding GDF15 and exercise-induced reductions in fat mass. Those observations are consistent with animal studies showing that GDF15 overexpression leads to reduced fat mass in HFD obesogenic mice (15, 25, 27) and promotes fatty acid β-oxidation and ketogenesis by activating hepatic XBP1 signaling in mice (32). Treating diet-induced and genetic-induced obese mice with human recombinant GDF15 also increased the expression of lipolytic genes (Adrb3, ATGL, HSL) in both white and brown adipose tissue, and this may be the downstream mechanism for GDF15 mediation of fat oxidation rate (2).
Insulin resistance is a direct consequence of an obesogenic metabolism. Emerging evidence suggests a potential link between GDF15 and insulin resistance. However, findings from human versus animal studies are mixed. In humans with obesity, subjects with a greater reduction in homeostasis model assessment of insulin resistance (HOMA-IR) after Roux-en-Y gastric bypass surgery displayed less of an increase in GDF15 (26). Alternatively, studies in leptin deficient (ob/ob) mice provide direct evidence that administration of GDF15 increases insulin sensitivity, which was attributed to elevated oxidative metabolism and lipid mobilization in the liver, skeletal muscle, and adipose tissue (3). In ob/ob mice and HFD-fed mice, GDF15 upregulates the oxidative function of macrophages, promotes M2-like polarization, and reverses insulin resistance (9). Also, the ability of IL-13 to improve insulin sensitivity in HFD mice is GDF15 dependent, as demonstrated by the loss of effect in HFD-fed GDF15 knockout mice (14). In our study, we found that insulin sensitivity was significantly improved postintervention, but the improvement in insulin sensitivity was not correlated with GDF15. However, further subgroup analysis revealed that the improvement in insulin sensitivity was only observed in the responder subgroup, suggesting that the regulatory role for GDF15 in insulin resistance is differentially linked to phenotype. Further causative intervention studies are warranted to address the relationship between GDF15 and insulin resistance in humans.
The current study was limited to analysis of GDF15 levels before and 16 h after the last bout of exercise training. Although native GDF15 protein has a short half-life of ~3 h (30), it remains possible that the GDF15 levels observed postexercise training could be partly attributed to the last exercise bout. Future studies would benefit from assessing the interplay between acute, exercise-induced GDF15 and chronic adaptation to exercise. Another limitation is that the direct causative effects of GDF15 in humans with obesity were not investigated in this study. Since GDF15 has not yet been administered to humans, direct effects of the compound on human metabolism have not been assessed. Herein, we provide preliminary evidence that GDF15 is associated with fat mass loss in humans with obesity, though future studies are needed to determine if this effect is causative.
In conclusion, we show that aerobic exercise training increases circulating GDF15 levels in humans with obesity. The elevation in plasma GDF15 was associated with the loss of fat mass. Furthermore, whole body fat oxidation, metabolic flexibility, and insulin sensitivity were improved in a subgroup of participants who showed the greatest increase in GDF15. These data affirm a potential role for GDF15 in regulating an obesogenic metabolic phenotype in humans.
GRANTS
This research was supported by R01 DK108089, R01 AG12834, and R21 AR067477 (to J. P. Kirwan) and was supported in part by the National Institutes of Health, National Center for Research Resources, 1UL1RR024989, and the Louisiana Center for Clinical and Translational Sciences U54GM104940.
DISCLOSURES
No conflicts of interest, financial or otherwise, are declared by the authors.
AUTHOR CONTRIBUTIONS
H.Z., C.E.F., and J.P.K. conceived and designed research; H.Z. performed experiments; H.Z. analyzed data; H.Z. and C.E.F. interpreted results of experiments; H.Z. prepared figures; H.Z. drafted manuscript; H.Z., C.E.F., and J.P.K. edited and revised manuscript; H.Z., C.E.F., and J.P.K. approved final version of manuscript.
ACKNOWLEDGMENTS
We thank the research volunteers for outstanding dedication and effort and the nursing staff of the Cleveland Clinic Clinical Research Unit. We thank Dr. Robbie Beyl for statistical guidance and the staff and students who helped with the implementation of the study and assisted with data collection and who aided in revision of this manuscript.
REFERENCES
- 1.Carstensen M, Herder C, Brunner EJ, Strassburger K, Tabak AG, Roden M, Witte DR. Macrophage inhibitory cytokine-1 is increased in individuals before type 2 diabetes diagnosis but is not an independent predictor of type 2 diabetes: the Whitehall II study. Eur J Endocrinol 162: 913–917, 2010. doi: 10.1530/EJE-09-1066. [DOI] [PubMed] [Google Scholar]
- 2.Chrysovergis K, Wang X, Kosak J, Lee SH, Kim JS, Foley JF, Travlos G, Singh S, Baek SJ, Eling TE. NAG-1/GDF-15 prevents obesity by increasing thermogenesis, lipolysis and oxidative metabolism. Int J Obes 38: 1555–1564, 2014. doi: 10.1038/ijo.2014.27. [DOI] [PMC free article] [PubMed] [Google Scholar]
- 3.Chung HK, Ryu D, Kim KS, Chang JY, Kim YK, Yi HS, Kang SG, Choi MJ, Lee SE, Jung SB, Ryu MJ, Kim SJ, Kweon GR, Kim H, Hwang JH, Lee CH, Lee SJ, Wall CE, Downes M, Evans RM, Auwerx J, Shong M. Growth differentiation factor 15 is a myomitokine governing systemic energy homeostasis. J Cell Biol 216: 149–165, 2017. doi: 10.1083/jcb.201607110. [DOI] [PMC free article] [PubMed] [Google Scholar]
- 4.Emmerson PJ, Wang F, Du Y, Liu Q, Pickard RT, Gonciarz MD, Coskun T, Hamang MJ, Sindelar DK, Ballman KK, Foltz LA, Muppidi A, Alsina-Fernandez J, Barnard GC, Tang JX, Liu X, Mao X, Siegel R, Sloan JH, Mitchell PJ, Zhang BB, Gimeno RE, Shan B, Wu X. The metabolic effects of GDF15 are mediated by the orphan receptor GFRAL. Nat Med 23: 1215–1219, 2017. doi: 10.1038/nm.4393. [DOI] [PubMed] [Google Scholar]
- 5.Fairlie WD, Moore AG, Bauskin AR, Russell PK, Zhang HP, Breit SN. MIC-1 is a novel TGF-beta superfamily cytokine associated with macrophage activation. J Leukoc Biol 65: 2–5, 1999. doi: 10.1002/jlb.65.1.2. [DOI] [PubMed] [Google Scholar]
- 6.Frayn KN. Calculation of substrate oxidation rates in vivo from gaseous exchange. J Appl Physiol 55: 628–634, 1983. doi: 10.1152/jappl.1983.55.2.628. [DOI] [PubMed] [Google Scholar]
- 7.Galliera E, Lombardi G, Marazzi MG, Grasso D, Vianello E, Pozzoni R, Banfi G, Corsi Romanelli MM. Acute exercise in elite rugby players increases the circulating level of the cardiovascular biomarker GDF-15. Scand J Clin Lab Invest 74: 492–499, 2014. doi: 10.3109/00365513.2014.905697. [DOI] [PubMed] [Google Scholar]
- 8.Harris JA, Benedict FG. A biometric study of human basal metabolism. Proc Natl Acad Sci USA 4: 370–373, 1918. doi: 10.1073/pnas.4.12.370. [DOI] [PMC free article] [PubMed] [Google Scholar]
- 9.Jung SB, Choi MJ, Ryu D, Yi HS, Lee SE, Chang JY, Chung HK, Kim YK, Kang SG, Lee JH, Kim KS, Kim HJ, Kim CS, Lee CH, Williams RW, Kim H, Lee HK, Auwerx J, Shong M. Reduced oxidative capacity in macrophages results in systemic insulin resistance. Nat Commun 9: 1551, 2018. doi: 10.1038/s41467-018-03998-z. [DOI] [PMC free article] [PubMed] [Google Scholar]
- 10.Katz A, Nambi SS, Mather K, Baron AD, Follmann DA, Sullivan G, Quon MJ. Quantitative insulin sensitivity check index: a simple, accurate method for assessing insulin sensitivity in humans. J Clin Endocrinol Metab 85: 2402–2410, 2000. doi: 10.1210/jcem.85.7.6661. [DOI] [PubMed] [Google Scholar]
- 11.Kelly KR, Brooks LM, Solomon TP, Kashyap SR, O’Leary VB, Kirwan JP. The glucose-dependent insulinotropic polypeptide and glucose-stimulated insulin response to exercise training and diet in obesity. Am J Physiol Endocrinol Metab 296: E1269–E1274, 2009. doi: 10.1152/ajpendo.00112.2009. [DOI] [PMC free article] [PubMed] [Google Scholar]
- 12.Kleinert M, Clemmensen C, Sjøberg KA, Carl CS, Jeppesen JF, Wojtaszewski JFP, Kiens B, Richter EA. Exercise increases circulating GDF15 in humans. Mol Metab 9: 187–191, 2018. doi: 10.1016/j.molmet.2017.12.016. [DOI] [PMC free article] [PubMed] [Google Scholar]
- 13.Kwon H, Kim D, Kim JS. Body fat distribution and the risk of incident metabolic syndrome: a longitudinal cohort study. Sci Rep 7: 10955, 2017. doi: 10.1038/s41598-017-09723-y. [DOI] [PMC free article] [PubMed] [Google Scholar]
- 14.Lee SE, Kang SG, Choi MJ, Jung SB, Ryu MJ, Chung HK, Chang JY, Kim YK, Lee JH, Kim KS, Kim HJ, Lee HK, Yi HS, Shong M. Growth differentiation factor 15 mediates systemic glucose regulatory action of T-helper type 2 cytokines. Diabetes 66: 2774–2788, 2017. doi: 10.2337/db17-0333. [DOI] [PubMed] [Google Scholar]
- 15.Macia L, Tsai VW, Nguyen AD, Johnen H, Kuffner T, Shi YC, Lin S, Herzog H, Brown DA, Breit SN, Sainsbury A. Macrophage inhibitory cytokine 1 (MIC-1/GDF15) decreases food intake, body weight and improves glucose tolerance in mice on normal & obesogenic diets. PLoS One 7: e34868, 2012. doi: 10.1371/journal.pone.0034868. [DOI] [PMC free article] [PubMed] [Google Scholar]
- 16.Mullican SE, Lin-Schmidt X, Chin CN, Chavez JA, Furman JL, Armstrong AA, Beck SC, South VJ, Dinh TQ, Cash-Mason TD, Cavanaugh CR, Nelson S, Huang C, Hunter MJ, Rangwala SM. GFRAL is the receptor for GDF15 and the ligand promotes weight loss in mice and nonhuman primates. Nat Med 23: 1150–1157, 2017. doi: 10.1038/nm.4392. [DOI] [PubMed] [Google Scholar]
- 17.O’Leary VB, Marchetti CM, Krishnan RK, Stetzer BP, Gonzalez F, Kirwan JP. Exercise-induced reversal of insulin resistance in obese elderly is associated with reduced visceral fat. J Appl Physiol (1985) 100: 1584–1589, 2006. doi: 10.1152/japplphysiol.01336.2005. [DOI] [PMC free article] [PubMed] [Google Scholar]
- 18.Schernthaner-Reiter MH, Kasses D, Tugendsam C, Riedl M, Peric S, Prager G, Krebs M, Promintzer-Schifferl M, Clodi M, Luger A, Vila G. Growth differentiation factor 15 increases following oral glucose ingestion: effect of meal composition and obesity. Eur J Endocrinol 175: 623–631, 2016. doi: 10.1530/EJE-16-0550. [DOI] [PubMed] [Google Scholar]
- 19.Solomon TP, Haus JM, Cook MA, Flask CA, Kirwan JP. A low-glycemic diet lifestyle intervention improves fat utilization during exercise in older obese humans. Obesity (Silver Spring) 21: 2272–2278, 2013. doi: 10.1002/oby.20411. [DOI] [PMC free article] [PubMed] [Google Scholar]
- 20.Solomon TP, Haus JM, Kelly KR, Cook MD, Filion J, Rocco M, Kashyap SR, Watanabe RM, Barkoukis H, Kirwan JP. A low-glycemic index diet combined with exercise reduces insulin resistance, postprandial hyperinsulinemia, and glucose-dependent insulinotropic polypeptide responses in obese, prediabetic humans. Am J Clin Nutr 92: 1359–1368, 2010. doi: 10.3945/ajcn.2010.29771. [DOI] [PMC free article] [PubMed] [Google Scholar]
- 21.Stern MP, Haffner SM. Body fat distribution and hyperinsulinemia as risk factors for diabetes and cardiovascular disease. Arteriosclerosis 6: 123–130, 1986. doi: 10.1161/01.ATV.6.2.123. [DOI] [PubMed] [Google Scholar]
- 22.Tchou I, Margeli A, Tsironi M, Skenderi K, Barnet M, Kanaka-Gantenbein C, Papassotiriou I, Beris P. Growth-differentiation factor-15, endoglin and N-terminal pro-brain natriuretic peptide induction in athletes participating in an ultramarathon foot race. Biomarkers 14: 418–422, 2009. doi: 10.1080/13547500903062976. [DOI] [PubMed] [Google Scholar]
- 23.Tsai VW, Husaini Y, Manandhar R, Lee-Ng KK, Zhang HP, Harriott K, Jiang L, Lin S, Sainsbury A, Brown DA, Breit SN. Anorexia/cachexia of chronic diseases: a role for the TGF-β family cytokine MIC-1/GDF15. J Cachexia Sarcopenia Muscle 3: 239–243, 2012. doi: 10.1007/s13539-012-0082-6. [DOI] [PMC free article] [PubMed] [Google Scholar]
- 24.Tsai VW, Macia L, Johnen H, Kuffner T, Manadhar R, Jørgensen SB, Lee-Ng KK, Zhang HP, Wu L, Marquis CP, Jiang L, Husaini Y, Lin S, Herzog H, Brown DA, Sainsbury A, Breit SN. TGF-b superfamily cytokine MIC-1/GDF15 is a physiological appetite and body weight regulator. PLoS One 8: e55174, 2013. doi: 10.1371/journal.pone.0055174. [DOI] [PMC free article] [PubMed] [Google Scholar]
- 25.Tsai VW, Zhang HP, Manandhar R, Lee-Ng KKM, Lebhar H, Marquis CP, Husaini Y, Sainsbury A, Brown DA, Breit SN. Treatment with the TGF-b superfamily cytokine MIC-1/GDF15 reduces the adiposity and corrects the metabolic dysfunction of mice with diet-induced obesity. Int J Obes 42: 561–571, 2018. doi: 10.1038/ijo.2017.258. [DOI] [PubMed] [Google Scholar]
- 26.Vila G, Riedl M, Anderwald C, Resl M, Handisurya A, Clodi M, Prager G, Ludvik B, Krebs M, Luger A. The relationship between insulin resistance and the cardiovascular biomarker growth differentiation factor-15 in obese patients. Clin Chem 57: 309–316, 2011. doi: 10.1373/clinchem.2010.153726. [DOI] [PubMed] [Google Scholar]
- 27.Wang X, Chrysovergis K, Kosak J, Kissling G, Streicker M, Moser G, Li R, Eling TE. hNAG-1 increases lifespan by regulating energy metabolism and insulin/IGF-1/mTOR signaling. Aging (Albany NY) 6: 690–704, 2014. doi: 10.18632/aging.100687. [DOI] [PMC free article] [PubMed] [Google Scholar]
- 28.Weir JB. New methods for calculating metabolic rate with special reference to protein metabolism. J Physiol 109: 1–9, 1949. doi: 10.1113/jphysiol.1949.sp004363. [DOI] [PMC free article] [PubMed] [Google Scholar]
- 29.Winckler T. [Excessive body fat increases the risk of cancer]. Pharm Unserer Zeit 37: 277–278, 2008. doi: 10.1002/pauz.200890043. [DOI] [PubMed] [Google Scholar]
- 30.Xiong Y, Walker K, Min X, Hale C, Tran T, Komorowski R, Yang J, Davda J, Nuanmanee N, Kemp D, Wang X, Liu H, Miller S, Lee KJ, Wang Z, Véniant MM. Long-acting MIC-1/GDF15 molecules to treat obesity: Evidence from mice to monkeys. Sci Transl Med 9: eaan8732, 2017. doi: 10.1126/scitranslmed.aan8732. [DOI] [PubMed] [Google Scholar]
- 31.Yang L, Chang CC, Sun Z, Madsen D, Zhu H, Padkjær SB, Wu X, Huang T, Hultman K, Paulsen SJ, Wang J, Bugge A, Frantzen JB, Nørgaard P, Jeppesen JF, Yang Z, Secher A, Chen H, Li X, John LM, Shan B, He Z, Gao X, Su J, Hansen KT, Yang W, Jørgensen SB. GFRAL is the receptor for GDF15 and is required for the anti-obesity effects of the ligand. Nat Med 23: 1158–1166, 2017. doi: 10.1038/nm.4394. [DOI] [PubMed] [Google Scholar]
- 32.Zhang M, Sun W, Qian J, Tang Y. Fasting exacerbates hepatic growth differentiation factor 15 to promote fatty acid β-oxidation and ketogenesis via activating XBP1 signaling in liver. Redox Biol 16: 87–96, 2018. doi: 10.1016/j.redox.2018.01.013. [DOI] [PMC free article] [PubMed] [Google Scholar]