Abstract
Earlier research using muscle tissue demonstrated that postexercise elevation in insulin-stimulated glucose uptake (ISGU) occurs concomitant with greater insulin-stimulated Akt substrate of 160 kDa (AS160) phosphorylation (pAS160) on sites that regulate ISGU. Because skeletal muscle is a heterogeneous tissue, we previously isolated myofibers from rat epitrochlearis to assess fiber type-selective ISGU. Exercise induced greater ISGU in type I, IIA, IIB, and IIBX but not IIX fibers. This study tested if exercise effects on pAS160 correspond with previously published fiber type-selective exercise effects on ISGU. Rats were studied immediately postexercise (IPEX) or 3.5 h postexercise (3.5hPEX) with time-matched sedentary controls. Myofibers dissected from the IPEX experiment were analyzed for fiber type (myosin heavy chain isoform expression) and key phosphoproteins. Isolated muscles from the 3.5hPEX experiment were incubated with or without insulin. Myofibers (3.5hPEX) were analyzed for fiber type, key phosphoproteins, and GLUT4 protein abundance. We hypothesized that insulin-stimulated pAS160 at 3.5hPEX would exceed sedentary controls only in fiber types characterized by greater ISGU postexercise. Values for phosphorylation of AMP-activated kinase substrates (acetyl CoA carboxylaseSer79 and AS160Ser704) from IPEX muscles exceeded sedentary values in each fiber type, suggesting exercise recruitment of all fiber types. Values for pAS160Thr642 and pAS160Ser704 from insulin-stimulated muscles 3.5hPEX exceeded sedentary values for type I, IIA, IIB, and IIBX but not IIX fibers. GLUT4 abundance was unaltered 3.5hPEX in any fiber type. These results advanced understanding of exercise-induced insulin sensitization by providing compelling support for the hypothesis that enhanced insulin-stimulated phosphorylation of AS160 is linked to elevated ISGU postexercise at a fiber type-specific level independent of altered GLUT4 expression.
Keywords: AMP-activated protein kinase, glucose transport, insulin sensitivity
INTRODUCTION
Skeletal muscle accounts for the largest portion of insulin-stimulated glucose disposal (15), and skeletal muscle insulin resistance is a primary and essential defect leading to type 2 diabetes (29, 45). Therefore, it is crucial to understand the mechanisms underlying treatments that improve muscle insulin sensitivity. One exercise session can increase subsequent insulin-stimulated glucose uptake by skeletal muscle for several hours via mechanisms that remain to be clearly delineated (2, 10, 18, 20, 24, 28, 31, 42, 49, 53, 54, 56, 57).
Insulin’s binding of its receptor initiates a complex signaling cascade, including the activation of phosphatidylinositol 3-kinase, which subsequently leads to greater Akt activity (21). Akt is widely recognized as a central hub that connects proximal insulin-signaling events with distal regulators of GLUT4 translocation and glucose uptake (37). Evidence suggests that enhanced insulin-stimulated glucose uptake by muscle after acute exercise does not require amplification of proximal insulin-signaling events ranging from insulin receptor binding to Akt phosphorylation (4, 5, 10, 56). These results implicate more distal insulin-signaling events as potentially important for the improved insulin sensitivity postexercise. Akt has many protein substrates, including the Akt substrate of 160 kDa (also known as AS160 or TBC1D4), which is a Rab-GAP-activating protein and distal insulin-regulated protein that undergoes site-selective phosphorylation (6, 46). AS160 phosphorylation on Thr642 and Ser588 by Akt is required for the full effect of insulin on GLUT4 glucose transporter translocation and glucose uptake (46). Arias et al. (2) discovered that prior exercise that increased insulin-stimulated glucose uptake was accompanied by greater AS160 phosphorylation in rat epitrochlearis muscle. Multiple lines of evidence support the idea that enhanced AS160 phosphorylation is linked to improved insulin sensitivity postexercise. Acute exercise can induce elevated Thr642 and/or Ser588 phosphorylation in the rat epitrochlearis muscle (3, 10, 17, 48). Greater AS160 phosphorylation has also been reported in insulin-stimulated human muscle after exercise that improved insulin-stimulated glucose uptake (42). AMP-activated protein kinase (AMPK) is a crucial metabolic regulator that balances multiple catabolic and anabolic processes under various physiologic conditions, including the major energetic challenge of exercise (33). AMPK activation has been identified as a signaling event that likely contributes to enhanced insulin-independent glucose uptake in skeletal muscle during and shortly after exercise. Furthermore, recent evidence suggests that AMPK might also play an important role in the increase in insulin-stimulated glucose uptake in skeletal muscle several hours after acute exercise. AS160 phosphorylation on Ser704 (corresponding to Ser711 in mice and Ser713 in rats), an AMPK consensus motif, is also increased in muscle after exercise or muscle contraction in humans, mice, or rats (31, 52, 54). Kjøbsted et al. (30–32) implicated elevated AMPK-mediated pAS160Ser704 as a potential mechanism for greater insulin-stimulated pAS160Thr642, favoring higher insulin-stimulated glucose uptake.
Skeletal muscle is a heterogeneous tissue comprised of multiple fiber types. The gold-standard technique for identifying fiber type is determination of myosin heavy chain (MHC) isoform expression (51). Four MHC isoforms are expressed in rat skeletal muscle (types I, IIA, IIB, and IIX). It is well known that muscle’s metabolic properties are widely variable in muscles with varying fiber type composition (47). For example, mitochondrial content is related to skeletal muscle fiber type profile, and the rank order for the abundance of several mitochondrial proteins has been reported to be IIA > I > IIX > IIBX > IIB based on research that examined both MHC isoform expression and mitochondrial protein expression in single myofibers (9, 22, 38, 55). It has also been previously reported that GLUT4 glucose transporter protein abundance is related to muscle fiber type composition (11, 27, 40). Fiber type-selective GLUT4 abundance was greatest in type IIA fibers and lowest in type IIB fibers isolated from rat muscle (9), and GLUT4 levels correlated with the abundance of mitochondrial proteins in both rat and rabbit muscle (9, 34).
The conventional method to assess fiber type differences is to study multiple muscles or muscle regions with markedly different fiber type compositions. Caveats of this approach include 1) in addition to myocytes, other cell types (including adipose, nerve, and vascular cells) are analyzed in tissue samples; 2) no muscle exclusively expresses one fiber type; and 3) tissue analysis cannot discern the metabolic characteristics of hybrid fibers that express more than one MHC isoform. Fully understanding muscle at the cellular and fiber type-specific levels is impossible based solely on conventional tissue analysis.
To address fiber type-selective metabolic properties, we developed a unique method to measure both glucose uptake and MHC isoform expression in single myofibers (39). Using this method, we have demonstrated that insulin-stimulated glucose uptake is similar for type I and type IIA fibers, with intermediate values in type IIBX and IIX fibers, and the lowest values in type IIB fibers (7). Using the single fiber glucose uptake method, we recently reported that an exercise protocol that enhances insulin-stimulated glucose uptake by whole rat epitrochlearis muscle (2, 10, 18, 48, 49) also induces greater insulin-stimulated glucose uptake by type I, IIA, IIB, and IIBX fibers but not by type IIX fibers (7).
Insulin signaling recently was described for the first time in type I and II myofibers from sedentary humans (1). We recognized that this powerful approach also could be leveraged to test for fiber type-selective exercise effects on key signaling proteins in the rat epitrochlearis. By using an exercise protocol identical to the procedure that caused fiber type-selective improvements in insulin-stimulated glucose uptake, we exploited an unprecedented opportunity to test the hypothesized relationship between postexercise insulin sensitivity and site-specific AS160 phosphorylation across five different fiber types.
The primary aim of this study was to evaluate key signaling steps in individual fiber types of rat epitrochlearis after the same exercise protocol that induced fiber type-selective effects on insulin-stimulated glucose uptake (7). Using this exercise protocol, we determined muscle fiber type-selective signaling both immediately postexercise (IPEX) and 3.5 h postexercise (3.5hPEX). We hypothesized that pAMPKThr172 and pAS160Ser704 would be increased in all fiber types IPEX compared with sedentary (SED) controls. We also hypothesized that insulin-stimulated Akt phosphorylation (Thr308 and Ser473) would not be different 3.5hPEX versus SED values, regardless of fiber type. In addition, we hypothesized that insulin-stimulated pAS160Ser588, pAS160Thr642, and pAS160Ser704 would each be greater 3.5hPEX versus SED controls only in fiber types with greater insulin-stimulated glucose uptake postexercise.
Although we previously reported that increased insulin-stimulated glucose uptake can occur without altered total GLUT4 glucose transporter protein abundance in whole epitrochlearis muscles from rats 3.5hPEX (10), it seemed possible that exercise might have fiber type-selective effects on GLUT4 abundance that are not detectable based on whole muscle GLUT4 analysis. Therefore, we determined the fiber type-specific effect of prior exercise on GLUT4 protein expression.
Finally, it has been demonstrated that under some circumstances, increased hexokinase II expression can result in greater insulin-stimulated glucose uptake (16). Furthermore, hexokinase II mRNA expression and enzyme activity can be increased in whole muscles several hours after acute exercise (41). Accordingly, we also evaluated the effect of acute exercise on fiber type-selective hexokinase II abundance.
MATERIALS AND METHODS
Materials
Chemicals were from Sigma-Aldrich (St. Louis, MO) or Fisher Scientific (Hanover Park, IL) unless otherwise noted. Apparatus and reagents for SDS-PAGE, nonfat dry milk (no. 170-6404) and Clarity Max Western ECL Substrate (no. 1705062) were from Bio-Rad Laboratories (Hercules, CA). Pierce MemCode Reversible Protein Stain Kit (no. 24585), Tissue Protein Extraction Reagent (TPER; no. 78510), SimplyBlue SafeStain (LC6065), and SuperSignal West Femto Maximum Sensitivity Substrate (no. 34095) were from Thermo Fisher Scientific (Waltham, MA). PhosSTOP (no. 4906845001) and Protease Inhibitor Cocktail (no. P8340) were from Sigma-Aldrich (St. Louis, MO). Anti-phospho Akt Ser473 (pAktSer473; no. 9271), anti-phospho Akt Thr308 (pAktThr308; no. 13038), anti-Akt (no. 4691), anti-phospho AS160 Thr642 (pAS160Thr642; no. 8881), anti-phospho AS160 Ser588 (pAS160Ser588; no. 8730), anti-phospho AMPKα Thr172 (pAMPKαThr172; no. 2531), anti-AMP-activated protein kinase-α (AMPKα; no. 5831), anti-AS160 (AS160; no. 2670), anti-acetyl CoA carboxylase (ACC; no. 3676), anti-phospho ACC Ser79 (pACCSer79; no. 3661), anti-hexokinase II (HKII; no. 2867), and anti-rabbit IgG horseradish peroxidase conjugate (no. 7074) were from Cell Signaling Technology (Danvers, MA). Anti-GLUT4 (no. CBL243) was from EMD Millipore (Billerica, MA). Phosphospecificity of anti-phospho AS160 Ser704 (pAS160Ser704), provided by Dr. Laurie Goodyear (Joslin Diabetes Center, Harvard Medical School), was confirmed by analyzing muscles expressing wild-type AS160 or an AS160-S704A-mutant (52).
Animal Treatment
Animal care procedures were approved by the University of Michigan Committee on Use and Care of Animals and performed in accordance with the Guide for the Care and Use of Laboratory Animals of the National Institutes of Health. Male Wistar rats (7–8 wk old; Charles River Laboratories, Boston,MA) were housed (23–24°C) and maintained on a 12:12-h light-dark cycle (lights out at 1700) with unlimited access to rodent chow (Laboratory Diet no. 5L0D; LabDiet, St. Louis, MO) and water. Rats were fasted at ~1700 on the night before the terminal experiment. The following morning at ~0700, exercised rats swam in a barrel filled with water (~45-cm depth; 6 rats per barrel) for four 30-min bouts, with 5-min rest between bouts. Other rats were time-matched SED controls with each experiment. This exercise protocol induces increased insulin-stimulated glucose uptake by whole epitrochlearis muscles (2, 18, 48, 49) and single fibers (7) from rats at ∼3.5hPEX.
Muscle Dissection and Incubation
Rats were anesthetized (intraperitoneal injection of pentobarbital sodium, 50 mg/kg body wt) IPEX or 3.5hPEX along with time-matched SED rats. For the IPEX experiment, following loss of pedal withdrawal reflex, both epitrochlearis muscles from each rat were rapidly dissected out, immediately frozen in liquid N2, and stored (−80°C).
For the 3.5hPEX experiment, exercised rats were dried and returned to their cages without food following the final exercise bout. Both epitrochlearis muscles were dissected from anesthetized exercised rats at 3.5hPEX after completion of exercise along with dissection of muscles from time-matched SED controls. After dissection, muscles used for analysis of phosphoproteins and hexokinase II protein abundance were incubated (30min, 35°C) in vials containing 2 ml Krebs Henseleit (KHB) supplemented with 0.1% bovine serum albumin (BSA), 2 mM sodium pyruvate, and 6 mM mannitol with or without a submaximally effective concentration of insulin (0.6 nM) (solution 1). After this initial incubation, muscles were incubated (20 min, 35°C) in other vials containing 2 ml of solution 1 with the same insulin concentration as the previous incubation step. After final incubation step, muscles were blotted on filter paper moistened with ice-cold KHB, immediately frozen in liquid N2, and stored (−80°C) until processing and analysis.
Isolation and Freeze-Drying of Single Muscle Fibers
Muscle fibers were collected and processed as described previously (1) with a few modifications. Frozen muscles were freeze-dried (48 h). Subsequently, individual muscle fiber segments (~2-mm length) were carefully dissected from lyophilized muscles under a microscope (EZ4D; Leica, Buffalo Grove,IL) using fine forceps in a humidity-controlled room (~30–35% humidity). After isolation, fibers were placed in a PCR tube, and 6 μl of lysis buffer (TPER; 1 mM Na3VO4, 1 mM EDTA, 1 mM EGTA, 2.5 mM sodium pyrophosphate tetrabasic decahydrate, 1 mM β-glycerophosphate, 1 μg/ml leupeptin, 1 mM phenylmethylsulfonyl fluoride, 100 μl/ml Protease Inhibitor Cocktail, and 1 tablet/5 ml PhosSTOP) were added per tube. PCR tubes were placed on ice (15 min), and 6 μl of 6×-Laemmli sample buffer were added and then heated (95–100°C, 5 min). Lysates were stored (−80°C) until analyzed.
Isolation of Single Muscle Fibers after Collagenase Treatment
GLUT4 protein abundance was determined for whole, individual myofibers isolated from the epitrochlearis of other rats that were either SED or 3.5hPEX using an exercise protocol identical to that described above. The muscles were isolated and incubated before whole myofibers were dissected out and processed to determine fiber type-selective glucose uptake. The fiber type-selective glucose uptake results from these rats have been previously published (7). In brief, isolated muscles were incubated for 30 min in solution 1 as described above, followed by incubation for 30 min in solution 1 supplemented with 2-[3H]deoxyglucose, and then underwent three 5-min washes in ice-cold wash media (Ca2+-free KHB with 0.1% BSA and 8 mM glucose) followed by a final incubation step in wash media supplemented with 1.5% type 2 collagenase and 8 mM glucose. Single fibers were then isolated using fine forceps under a dissecting microscope, and fibers were lysed. An aliquot of the lysate was used to determine MHC expression, and another portion was used to determine GLUT4 protein abundance in individual fiber lysates by immunoblotting. For each fiber type from each rat, four to six fibers were individually loaded into separate wells on the gel and subsequently used for immunoblotting.
MHC Isoform Identification
Aliquots from lysates of each freeze-dried fiber (6 μl) were used to determine MHC expression. MHC isoforms were separated and identified by SDS-PAGE (9) by comparing MHC protein band(s) migration to a MHC isoform standard (6 μg protein from 3:2 mixture of homogenized rat extensor digitorum longus and soleus) containing all four MHC isoforms: I, IIA, IIB, and IIX.
Pooled Freeze-Dried Fiber Preparation
The remainder of single freeze-dried fiber lysates (~6 μl/fiber) expressing the same fiber type from each muscle were pooled together. Pooled fibers were separated into fiber types: type I, IIA, IIB, IIBX, and IIX. For the IPEX experiment (1,827 fibers from 48 muscles were analyzed), the means ± SE for number of pooled fibers used for each muscle of the respective fiber types from SED/IPEX groups were as follows: type I (17 ± 2/13 ± 2), IIA (18 ± 3/15 ± 2), IIB (21 ± 2/21 ± 2), IIBX (15 ± 1/17 ± 2), and IIX (17 ± 2/17 ±2). For the 3.5hPEX experiment (2838 fibers from 38 muscles were analyzed), the means ± SE of pooled fibers used for each muscle from SED-basal/SED-insulin and 3.5hPEX-basal/3.5hPEX-insulin groups of the fiber types were as follows: type I (57 ± 4/50 ± 5 and 43 ± 13/54 ± 7), IIA (55 ± 6/58 ± 3 and 46 ± 6/40 ± 12), IIB (29 ± 1/27 ± 2 and 26 ± 2/28 ± 4), IIBX (23 ± 4/20 ± 1 and 22 ± 1/28 ± 3), and IIX (25 ± 3/26 ± 4 and 22 ± 3/26 ± 3). Type IIAX was the only other hybrid fiber type that was isolated from the muscles. The small number of IIAX fibers isolated (typically ~2–6 fibers/muscle) provided insufficient material for protein quantitation by immunoblotting.
Pooled Fiber Protein Concentration
Pooled freeze-dried fiber aliquots were separated by 7% SDS-PAGE gels. Each gel included a standard curve prepared using epitrochlearis homogenates with known total protein concentration. After electrophoresis, gels were stained [SimplyBlue, 1 h, room temperature (RT)] and destained (1–3 h, deionized water, RT). SimplyBlue-stained MHC band intensity was quantified by densitometry. Protein concentration was calculated using linear regression from the standard curve (R2 = 0.95–0.99).
Immunoblotting
An equal amount of pooled fiber total protein was heated (95–100°C, 5 min), subjected to SDS-PAGE, and transferred to polyvinylidene difluoride membranes. After electrotransfer, gels were stained (SimplyBlue SafeStain, 1 h, RT) and then destained (deionized water, 1–3 h). SimplyBlue-stained MHC bands quantified by densitometry served as loading controls. Membranes were blocked [3% BSA or nonfat milk in Tris-buffered saline, pH 7.5, 0.1% Tween-20 (TBST); 1 h, RT] and incubated with primary antibodies in TBST with 3% BSA or milk overnight (4°C). Membranes were washed three times for 5 min with TBST before incubation with secondary antibody (2 h, RT). Membranes were washed three times for 5 min with TBST and then washed (three times for 5 min with TBS). Proteins detected using SuperSignal West Femto Maximum Sensitivity Substrate or Clarity Max Western ECL Substrate were quantified by densitometry. Each sample value was expressed relative to the normalized average of all samples on the blot and then divided by the respective MHC loading control. Measurement of phosphorylated proteins and total proteins for each protein (i.e., AMPK, ACC, Akt, and AS160) was determined on separate immunoblots because we have found that stripping and reprobing the same membrane with a separate antibody can compromise data quality. Phosphorylated protein data are expressed as a ratio of phosphorylated:total protein.
Statistical Analysis
A Student’s t-test was used for comparisons between two groups. For immunoblotting of freeze-dried fibers (for all signaling proteins and hexokinase II analysis), multiple fibers (8–30 for IPEX and 14–68 for 3hPEX) of the same fiber type were pooled before immunoblotting. For GLUT4 abundance, four to six single fibers of each fiber type that were isolated from the muscle dissected from each rat were individually subjected to immunoblotting. The individual values determined for each fiber type from each rat were then used to calculate the mean value for the rat. This mean value was used for statistical analyses of GLUT4 (i.e., the n values represent the number of rats, not the number of individual fibers). Two-way ANOVA was used to determine main effects of insulin (with or without insulin) and exercise (SED or 3.5hPEX) and insulin × exercise interactions. Tukey’s test was used for post hoc analysis to identify the source of significant variance (SigmaPlot version 13.0; Systat Software, San Jose, CA). Data lacking normal distribution and/or equal variance were transformed to achieve normality and equal variance before ANOVA.
RESULTS
IPEX Signaling
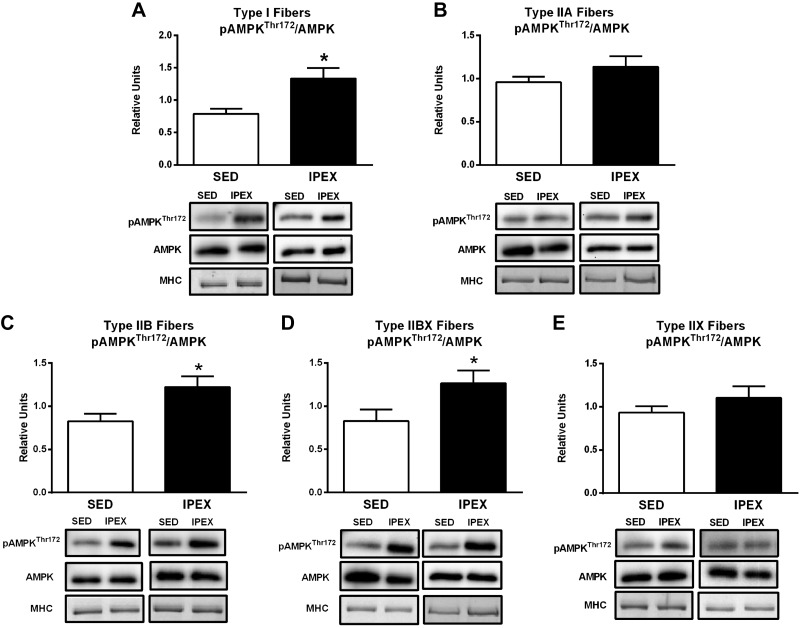
The pAMPKThr172/AMPK value was significantly greater for the IPEX group versus SED controls in type I, IIB, and IIBX fibers (P < 0.05; Fig. 1). There was no significant exercise effect on pAMPKThr172/AMPK in type IIA or type IIX fibers.
Fig. 1.
A–E: effects of exercise on pAMPKThr172/AMPK in each fiber type [I (A), IIA (B), IIB (C), IIBX (D), and IIX (E)] from immediately postexercise (IPEX) and time-matched sedentary (SED) rats. Open bar: SED group; filled bar: IPEX group. *P < 0.05 for each fiber type. Data were analyzed by Student's t-test. Values are means ± SE; n = 6–8 per group. Representative blots and loading controls [myosin heavy chain (MHC)] are included for each fiber type.
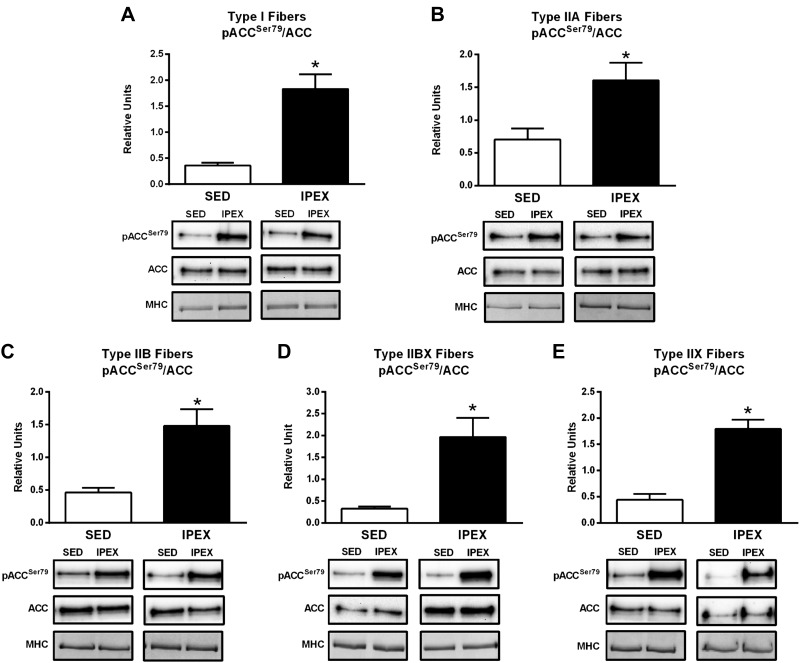
The pACCSer79/ACC value was significantly greater for the IPEX group compared with the SED controls in each fiber type (I, P < 0.01; IIA, P < 0.05; IIB, P < 0.01; IIBX, P < 0.05; IIX, P < 0.001; Fig. 2).
Fig. 2.
A–E: effects of exercise on pACCSer79/ACC in each fiber type [I (A), IIA (B), IIB (C), IIBX (D), and IIX (E)] from from immediately postexercise (IPEX) and time-matched sedentary (SED) rats. Open bar: SED group; filled bar: IPEX group. *IPEX versus SED: type I, P < 0.01; IIA, P < 0.05; IIB, P < 0.01, IIBX, P < 0.05; IIX, P < 0.001. Data were analyzed by Student's t-test. Values are means ± SE; n = 6–8 per group. Representative blots and loading controls [myosin heavy chain (MHC)] are included for each fiber type.
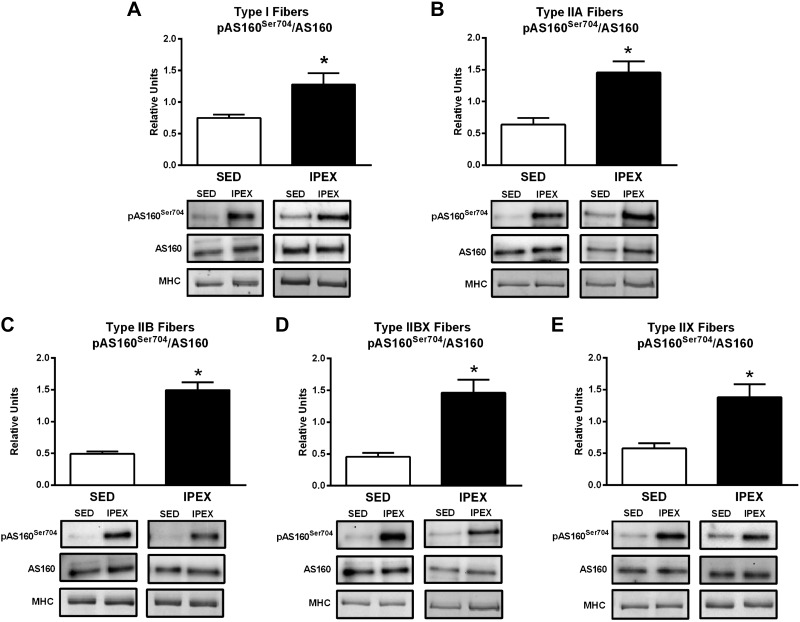
Values for pAS160Ser704/AS160 were significantly greater for the IPEX group versus SED controls in each fiber type (I, P < 0.05; IIA, P < 0.01; IIB, P < 0.001; IIBX, P < 0.001; IIX, P < 0.05; Fig. 3).
Fig. 3.
A–E: effects of exercise on pAS160Ser704/AS160 in each fiber type [I (A), IIA (B), IIB (C), IIBX (D), and IIX (E)] from from immediately postexercise (IPEX) and time-matched sedentary (SED) rats. Open bar: SED group; filled bar: IPEX group. *IPEX versus SED: type I, P < 0.05: IIA, P < 0.01; IIB, P < 0.001; IIBX, P < 0.001; IIX, P < 0.05. Data were analyzed by Student's t-test. Values are means ± SE; n = 6–8 per group. Representative blots and loading controls ([myosin heavy chain (MHC)] are included for each fiber type.
Table 1 summarizes the IPEX effects on fiber type-selective signaling. Although exercise-induced elevation in pAMPKThr172/AMPK differed among the fiber types (a significant increase was evident for type I, IIB, and IIBX but not for type IIA or IIX fibers), exercise consistently elevated phosphorylation on AMPK-phosphomotifs on both ACC and AS160 in every fiber type. Taken together, these results provide evidence that the exercise protocol led to both fiber recruitment and the activation of the AMPK signaling pathway in each of the fiber types.
Table 1.
pAMPKThr172, pACCSer79, and pAS160Ser704 in fibers immediately postexercise versus sedentary
| Fiber Type | pAMPKThr172/AMPK | pACCSer79/ACC | pAS160Ser704/AS160 |
|---|---|---|---|
| Type I | ↑ | ↑ | ↑ |
| Type IIA | ↔ | ↑ | ↑ |
| Type IIB | ↑ | ↑ | ↑ |
| Type IIBX | ↑ | ↑ | ↑ |
| Type IIX | ↔ | ↑ | ↑ |
↑Indicates that the immediately postexercise value was significantly greater than the sedentary value for the same fiber type. ↓Indicates that the immediately postexercise value was significantly lower than the sedentary value for the same fiber type. ↔Indicates that the immediately postexercise value was not significantly different from the sedentary value for the same fiber type.
3.5hPEX Signaling
Akt Phosphorylation.
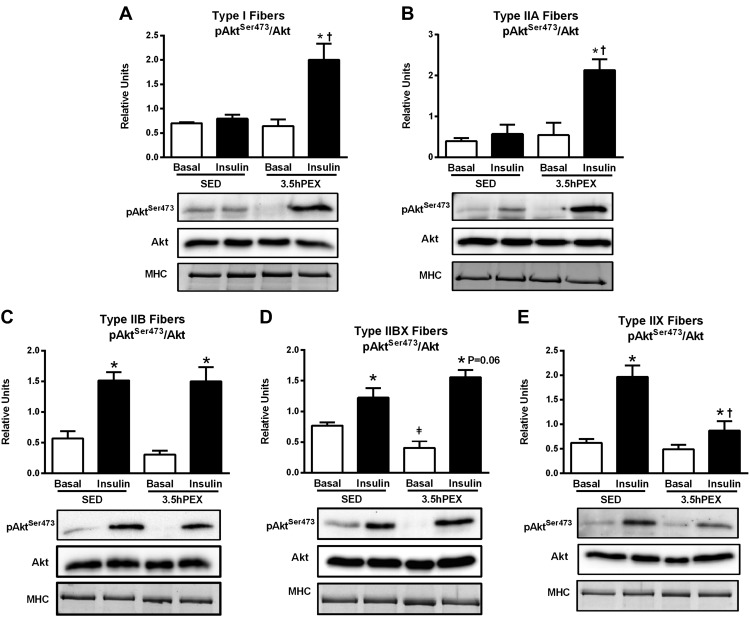
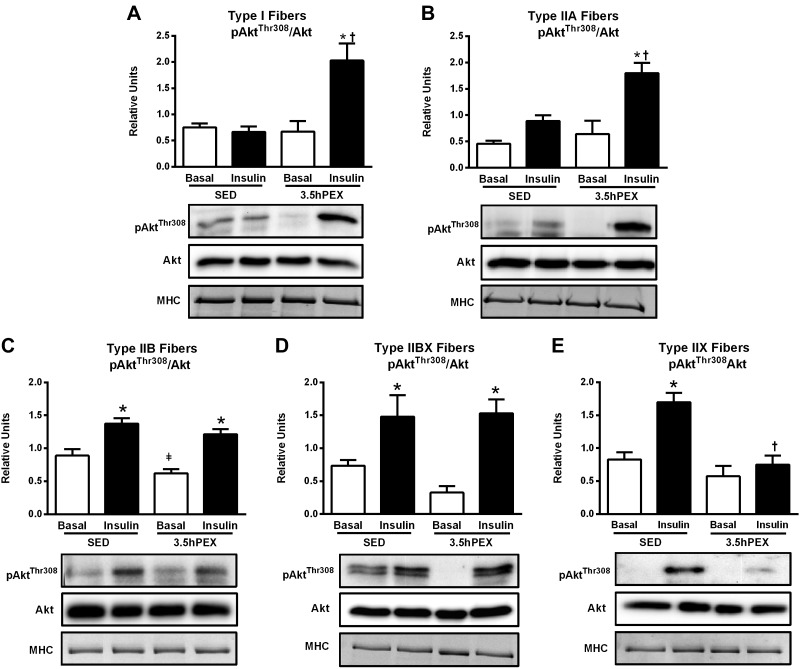
For type I fibers, there were significant insulin x exercise interactions for both pAktSer473 (P < 0.01; Fig. 4A) and pAktThr308 (P < 0.01; Fig. 5A). Post hoc analysis of insulin-stimulated type I fibers demonstrated that 3.5hPEX values significantly exceeded SED values for both pAktSer473 (P < 0.01) and pAktThr308 (P < 0.01).
Fig. 4.
A–E: effect of insulin and exercise on pAktSer473/Akt in each fiber type [I (A), IIA (B), IIB (C), IIBX (D), and IIX (E)] from 3.5 h postexercise (3.5hPEX) and time-matched sedentary (SED) rats, incubated without or with a submaximally effective insulin dose. Open bar: no insulin from SED or 3.5hPEX group; filled bar: with insulin from SED or 3.5hPEX group. *Insulin versus basal (no insulin): type IIB, P < 0.001; IIBX, P < 0.05; IIX, P < 0.001 (SED group); and type I, P < 0.05; IIA, P < 0.01; IIB, P < 0.001; IIBX, P < 0.001; IIX, P < 0.05 (3.5hPEX group). ‡3.5hPEX versus SED with basal (no insulin): P < 0.05 in IIBX fibers. †3.5hPEX versus SED with insulin: P < 0.01 in type I and IIA fibers, P < 0.01 in IIX fibers. Data were analyzed by two-way ANOVA, and Tukey post hoc analysis was performed to identify the source of significant variance. Values are means ± SE; n = 3–6 per group. Representative blots and loading controls [myosin heavy chain (MHC)] are included for each fiber type.
Fig. 5.
A–E: effects of insulin and exercise on pAktThr308/Akt in each fiber type [I (A), IIA (B), IIB (C), IIBX (D), and IIX (E)] from 3.5 h postexercise (3.5hPEX) and time-matched sedentary (SED) rats, incubated without or with a submaximally effective insulin dose. Open bar: no insulin from SED or 3.5hPEX group; filled bar: with insulin from SED or 3.5hPEX group. *Insulin versus basal (no insulin): type IIB, P < 0.001; IIBX, P < 0.05; IIX, P < 0.001 (SED group); and type I, P < 0.01; IIA, P < 0.01; IIB, P < 0.001; IIBX, P < 0.01; IIX, P < 0.001 (3.5hPEX group). ‡3.5hPEX versus SED with basal (no insulin): P < 0.05 in IIB fibers. †3.5hPEX versus SED with insulin: type I, P < 0.01; IIA fibers, P < 0.01; IIX, P < 0.001. Data were analyzed by two-way ANOVA, and Tukey post hoc analysis was performed to identify the source of significant variance. Values are means ± SE; n = 3–6 per group. Representative blots and loading controls [myosin heavy chain (MHC)] are included for each fiber type.
For type IIA fibers, there was a significant insulin × exercise interaction for pAktSer473 (P < 0.05; Fig. 4B) and a nonsignificant trend for an insulin × exercise interaction for pAktThr308 (P = 0.066; Fig. 5B). Post hoc analysis of insulin-stimulated type IIA fibers demonstrated that 3.5hPEX values significantly exceeded SED values for both pAktSer473 (P < 0.01) and pAktThr308 (P < 0.01).
For type IIB fibers, there were significant main effects of insulin (insulin > no insulin) for both pAktSer473 (P < 0.001; Fig. 4C) and pAktThr308 (P < 0.001; Fig. 5C). In contrast to type I and IIA fibers, there was no evidence in insulin-stimulated type IIB fibers of an exercise-induced increase in Akt phosphorylation on either phosphosite.
For type IIBX fibers, there were significant main effects of insulin (insulin > no insulin) for both pAktSer473 (P < 0.001; Fig. 4D) and pAktThr308 (P < 0.001; Fig. 5D). There was also a significant insulin × exercise interaction for pAktThr308 (P < 0.05) and a post hoc analysis detected a nonsignificant trend (P = 0.06) in insulin-stimulated type IIBX fibers for 3.5hPEX values to exceed SED values for pAktSer473.
For type IIX fibers, there were significant main effects of insulin (insulin > no insulin; P < 0.001) and exercise (SED > 3.5hPEX; P < 0.01) for pAktSer473 (Fig. 4E). There was a significant insulin × exercise interaction for pAktThr308 (P < 0.05) and a nonsignificant trend for an insulin × exercise interaction for pAktSer473 (P = 0.084). In contrast to all other fiber types, post hoc analysis of insulin-stimulated type IIX fibers indicated that the values for both pAktSer473 (P < 0.01) and pAktThr308 (P < 0.001) were significantly greater for SED versus 3.5hPEX rats (Fig. 5E).
AS160 Phosphorylation.
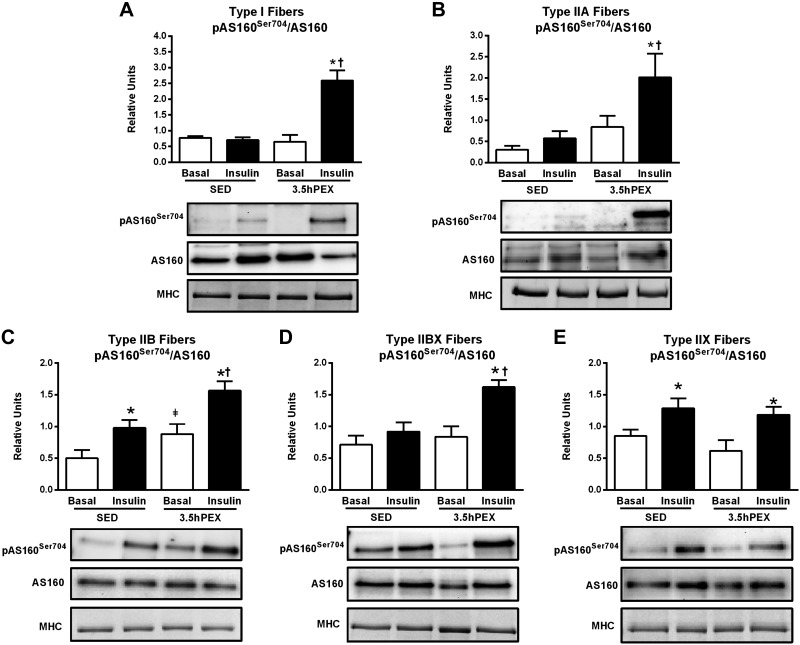
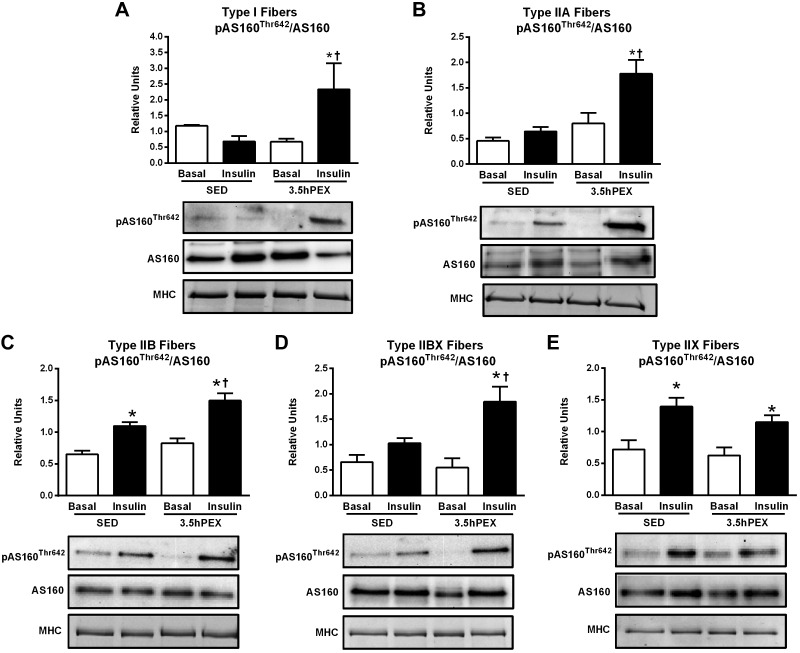
For type I fibers, there were significant insulin × exercise interactions for both pAS160Ser704 (P < 0.01; Fig. 6A) and pAS160Thr642 (P < 0.01; Fig. 8A). Post hoc analysis of insulin-stimulated type I fibers revealed significantly greater values for the 3.5hPEX group versus SED group for both pAS160Ser704/AS160 (P < 0.001) and pAS160Thr642/AS160 (P < 0.01). The signal for pAS160Ser588 in type I fibers was insufficient to quantify (data not shown).
Fig. 6.
A–E: effects of insulin and exercise on pAS160Ser704/AS160 in each fiber type [I (A), IIA (B), IIB (C), IIBX (D), and IIX (E)] from 3.5 h postexercise (3.5hPEX) and time-matched sedentary (SED) rats, incubated without or with a submaximally effective insulin dose. Open bar: no insulin from SED or 3.5hPEX group; filled bar: with insulin from SED or 3.5hPEX group. *Insulin versus basal (no insulin): type IIB, P < 0.05; IIX, P < 0.05 (SED group); and type I, P < 0.001; IIA, P < 0.05; IIB, P < 0.01; IIBX, P < 0.01; IIX, P < 0.05 (3.5hPEX group). ‡3.5hPEX versus SED with basal (no insulin); P < 0.05 in IIB fibers. †3.5hPEX versus SED with insulin: type I, P < 0.001; IIA fibers, P < 0.05; IIB, P < 0.05; IIBX, P < 0.01. Data were analyzed by two-way ANOVA, and Tukey post hoc analysis was performed to identify the source of significant variance. Values are means ± SE; n = 3–6 per group. Representative blots and loading controls [myosin heavy chain (MHC)] are included for each fiber type.
Fig. 8.
A–E: effects of insulin and exercise on pAS160Thr642/AS160 in each fiber type [I (A), IIA (B), IIB (C), IIBX (D), and IIX (E)] from 3.5 h postexercise (3.5hPEX) and time-matched sedentary (SED) rats, incubated without or with a submaximally effective insulin dose. Open bar: no insulin from SED or 3.5hPEX group, filled bar: with insulin from SED or 3.5hPEX group. *Insulin versus basal (no insulin): type IIB, P < 0.001; IIX, P < 0.05 (SED group); and type I, P < 0.01; IIA, P < 0.01; IIB, P < 0.001; IIBX, P < 0.001; IIX, P < 0.01 (3.5hPEX group). †3.5hPEX versus SED with insulin: type I, P < 0.01; IIA fibers, P < 0.01; IIB, P < 0.01; IIBX, P < 0.05. Data were analyzed by two-way ANOVA, and Tukey post hoc analysis was performed to identify the source of significant variance. Values are means ± SE; n = 3–6 per group. Representative blots and loading controls [myosin heavy chain (MHC)] are included for each fiber type.
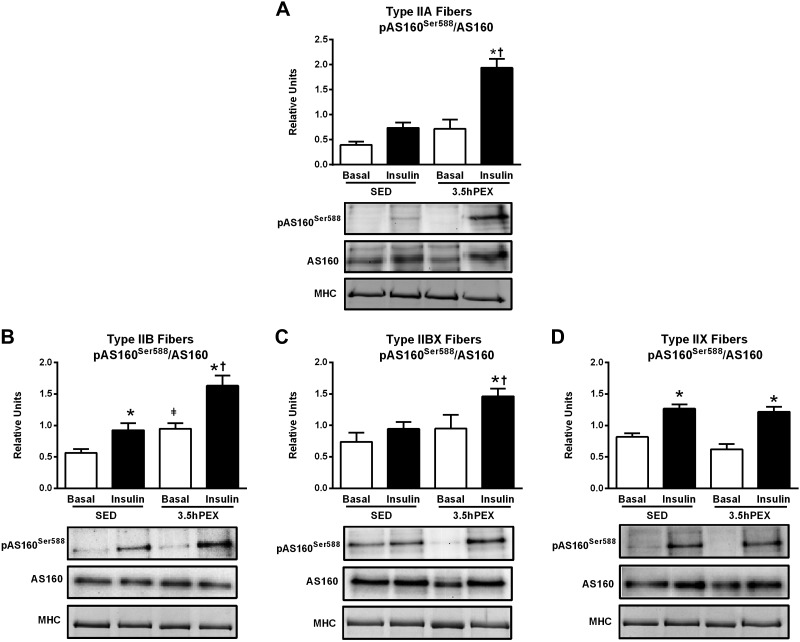
For type IIA fibers, there were significant main effects of exercise (3.5hPEX > SED) for both pAS160Ser704 (P < 0.05; Fig. 6B) and pAS160Thr642 (P < 0.01; Fig. 8B). In addition, there was a significant insulin × exercise interaction for pAS160Ser588 (P < 0.05; Fig. 7A) and a nonsignificant trend (P = 0.06) for an insulin × exercise interaction in pAS160Thr642. Post hoc analysis for insulin-stimulated type IIA fibers indicated the 3.5hPEX values exceeded SED values for pAS160Ser704/AS160 (P < 0.05), pAS160Ser588/AS160 (P < 0.001), and pAS160Thr642/AS160 (P < 0.01).
Fig. 7.
A–D: effects of insulin and exercise on pAS160Ser588/AS160 in IIA (A), IIB (B), IIBX (C), and IIX (D) fibers from 3.5 h postexercise (3.5hPEX) and time-matched sedentary (SED) rats, incubated without or with a submaximally effective insulin dose. Open bar: no insulin from SED or 3.5hPEX group; filled bar: with insulin from SED or 3.5hPEX group. There was insufficient signal to quantify pAS160Ser588/AS160 in type I fibers (not shown). *Insulin versus basal (no insulin): P < 0.001 in type IIB and IIX fibers (SED group); and type IIA, P < 0.001; IIB, P < 0.001; IIBX, P < 0.05; IIX, P < 0.001 (3.5hPEX group). ‡3.5hPEX versus SED with basal (no insulin): P < 0.05 in IIB fibers. †3.5hPEX versus SED with insulin: type IIA fibers, P < 0.001; IIB, P < 0.05; IIBX, P < 0.05. Data were analyzed by two-way ANOVA, and Tukey post hoc analysis was performed to identify the source of significant variance. Values are means ± SE; n = 3–6 per group. Representative blots and loading controls [myosin heavy chain (MHC)]) are included for each fiber type.
For type IIB fibers, there were significant main effects of both insulin (insulin > no insulin; P < 0.001;) and exercise (3.5hPEX > SED; P < 0.01 for pAS160Ser704 and Thr642; P < 0.001 for pAS160Ser588) for each of the pAS160 sites (Figs. 6C, 7B, and 8C). Post hoc analysis of insulin-stimulated type IIB fibers demonstrated that 3.5hPEX values were greater than SED values for pAS160Ser704/AS160 (P < 0.05), pAS160Ser588/AS160 (P < 0.05), and pAS160Thr642/AS160 (P < 0.01).
For type IIBX fibers, there were significant main effects of insulin (insulin > no insulin; P < 0.01 for pAS160Ser704; P < 0.05 for pAS160ser588) and exercise (3.5hPEX > SED; P < 0.05) on pAS160Ser704 (Fig. 6D) and pAS160Ser588 (Fig. 7C). In addition, there was a significant insulin × exercise interaction for pAS160Thr642 (P < 0.05; Fig. 8D). Post hoc analysis of insulin-stimulated type IIBX fibers revealed greater 3.5hPEX values versus SED controls for pAS160Ser704/AS160 (P < 0.01), pAS160Ser588/AS160 (P < 0.05), and pAS160Thr642/AS160 (P < 0.05).
For type IIX fibers, there were significant main effects of insulin (insulin > no insulin) for pAS160Ser704/AS160 (P < 0.01; Fig. 6E), pAS160Ser588/AS160 (P < 0.001; Fig. 7D), and pAS160Thr642/AS160 (P < 0.001; Fig. 8E). However, in marked contrast to the each of the other fiber types, there were no significant main effects of either exercise or significant insulin × exercise interactions for any of the AS160 phosphosites studied.
Table 2 summarizes the insulin and exercise effects on fiber type-selective insulin signaling at 3.5hPEX. The data revealed diverse effects of prior exercise on insulin-stimulated Akt phosphorylation among the different fiber types, including increased (for I and IIA on both phosphosites), unchanged (for IIB and IIBX on both phosphosites), and decreased (for IIX on both phosphosites). The results also uncovered a striking fiber type-selective effect of prior exercise on insulin-stimulated muscle in which AS160 phosphorylation was elevated for all fiber types except for IIX fibers.
Table 2.
Akt and AS160 phosphorylation in insulin-stimulated fibers at 3.5 h postexercise versus sedentary
| Fiber Type | pAktSer473/Akt | pAktThr308/Akt | pAS160Thr704/AS160 | pAS160Ser588/AS160 | pAS160Thr642/AS160 |
|---|---|---|---|---|---|
| Type I | ↑ | ↑ | ↑ | Insufficient Signal | ↑ |
| Type IIA | ↑ | ↑ | ↑ | ↑ | ↑ |
| Type IIB | ↔ | ↔ | ↑ | ↑ | ↑ |
| Type IIBX | ↔ | ↔ | ↑ | ↑ | ↑ |
| Type IIX | ↓ | ↓ | ↔ | ↔ | ↔ |
↑Indicates that the 3.5 h postexercise value was significantly greater than the sedentary value for the same fiber type. ↓Indicates that the 3.5 h postexercise value was significantly lower than the sedentary value for the same fiber type. ↔Indicates that 3.5 h postexercise value was not significantly different from the sedentary value for the same fiber type.
3.5hPEX Hexokinase II and GLUT4 Protein Abundance
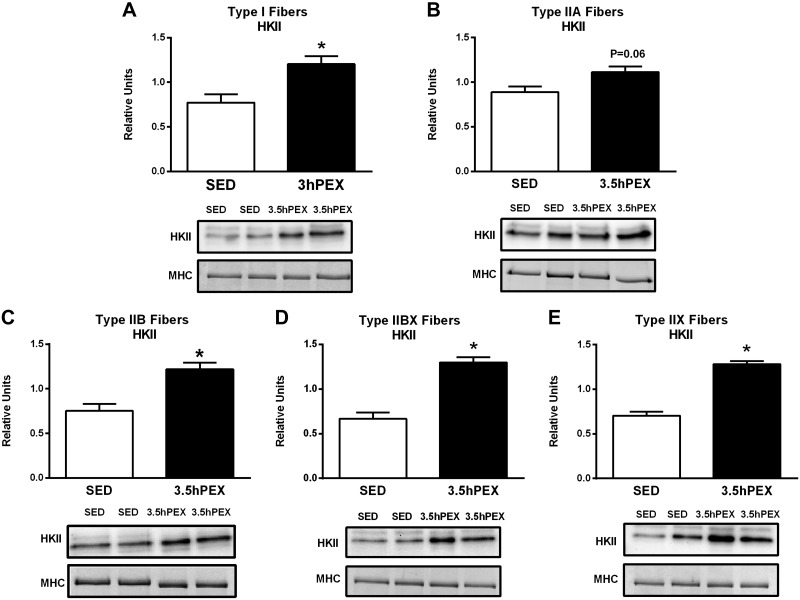
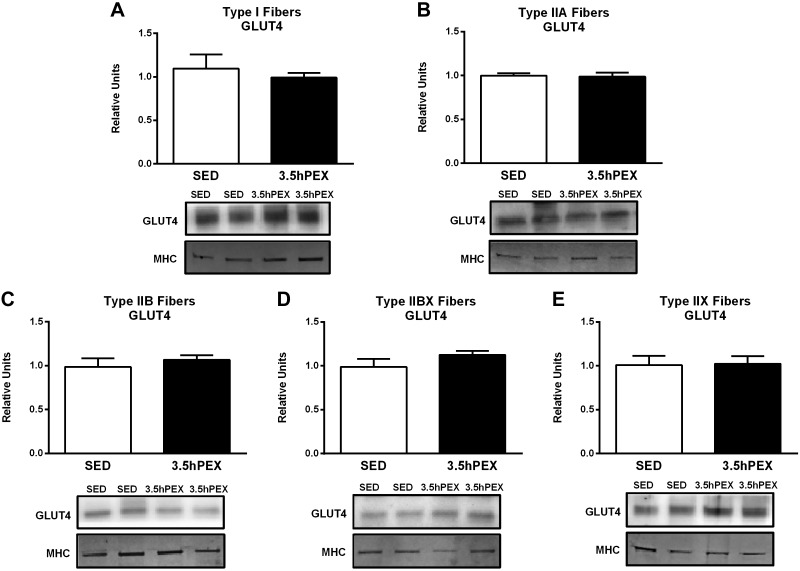
Hexokinase II abundance was significantly greater for 3.5hPEX versus SED controls in type I (P < 0.05), IIB (P < 0.01), IIBX (P < 0.001), and IIX (P < 0.001) fibers (Fig. 9). Hexokinase II levels also tended to be greater (P = 0.06) for 3.5hPEX compared with SED values in type IIA fibers. In contrast to hexokinase II, there was no evidence for GLUT4 protein abundance to be altered at 3.5hPEX in any fiber type studied (Fig. 10).
Fig. 9.
A–E: effects of exercise on hexokinase II (HKII) protein abundance in each fiber type [I (A), IIA (B), IIB (C), IIBX (D), and IIX (E)] from 3.5 h postexercise (3.5hPEX) and time-matched sedentary (SED) rats, incubated without or with a submaximally effective insulin dose. Open bar: = SED group; filled bar: 3.5hPEX group. *3.5hPEX versus SED: type I (P < 0.05), IIB (P < 0.01), IIBX (P < 0.001), and IIX (P < 0.001) fibers. Data were analyzed by Student's t-test. Values are means ± SE; n = 3–6 per group. Representative blots and loading controls [myosin heavy chain (MHC)] are included for each fiber type.
Fig. 10.
A–E: effect of exercise on GLUT4 protein abundance in each fiber type [I (A), IIA (B), IIB (C), IIBX (D), and IIX (E)] from 3.5 h postexercise (3.5hPEX) and time-matched sedentary (SED), incubated without or with a submaximally effective insulin dose. Open bar: SED group; filled bar: 3.5hPEX group. Data were analyzed by Student's t-test. Values are means ± SE; n = 4–6 per group. Representative blots and loading controls [myosin heavy chain (MHC)] are included for each fiber type.
DISCUSSION
Improved insulin-stimulated glucose uptake by skeletal muscle is a major health-related benefit of exercise (5).The specific molecular and cellular processes that underlie this crucial outcome remain incompletely understood, but increased AS160 phosphorylation on several key regulatory sites has emerged as an attractive candidate mechanism. Our recent discovery that prior exercise induced fiber type-selective effects on insulin-stimulated glucose uptake by rat epitrochlearis muscle (7) taken together with the current assessment of fiber type-selective signaling in rat epitrochlearis muscle enabled a unique opportunity to test the putative relationship between AS160 phosphorylation and improved insulin sensitivity at the molecular and fiber type-specific levels.
The results provide compelling new evidence linking greater AS160 phosphorylation to enhanced glucose uptake in insulin-stimulated muscle after acute exercise at the myocellular and fiber type-specific level. Values for insulin-stimulated pAS160Thr642 and pAS160Ser704 were substantially enhanced 3.5hPEX in each of the fiber types (I, IIA, IIB, and IIBX) that we previously demonstrated had increased insulin-stimulated glucose uptake after the same exercise protocol (7). Insulin-stimulated pAS160Ser588 was also increased in type IIA, IIB, and IIBX, but in type I fibers the signal was insufficient for quantification. These results for single fibers correspond to our recent results for enhanced pAS160 on each of these three sites in whole epitrochlearis muscle after an identical exercise protocol (54). In sharp contrast to the results with these fiber types, in type IIX fibers there was no evidence for postexercise increases in either insulin-stimulated AS160 phosphorylation (on Ser588, Thr642, and Ser704) in the current study or insulin-stimulated glucose uptake in our earlier study using the identical exercise protocol (7). The idea that elevated AS160 phosphorylation may play a role in enhanced insulin-stimulated glucose uptake is supported by the strong evidence linking AS160s phosphorylation on Thr642 and Ser588 to insulin-stimulated GLUT4 exocytosis and glucose uptake (6, 12, 46). In addition, greater insulin-stimulated glucose uptake by whole epitrochlearis muscles from rats after acute exercise has been closely associated with altered pAS160Thr642 under multiple conditions. In an experiment using the same exercise protocol as the current study, both pAS160Thr642 and glucose uptake in insulin-stimulated epitrochlearis were evident 27 h after exercise by rats that were not refed postexercise (18). In the same study, we found that rats eating high-carbohydrate chow reversed these effects ~3 h postexercise (18). Acute one-legged exercise by humans resulted in subsequently elevated insulin-stimulated pAS160Thr642, pAS160Ser588, and glucose uptake in skeletal muscle (42). Increased pAS160Thr642 and AS160Ser704 several hours after muscle contraction in mice was accompanied by enhanced insulin-stimulated glucose uptake by skeletal muscle (31). The same exercise protocol as used in the current study also resulted in increased pAS160Thr642, pAS160Ser588, pAS160Ser704, and glucose uptake in insulin-stimulated rat epitrochlearis (54). The consistent correspondence between enhanced insulin-stimulated pAS160 and glucose uptake postexercise under various conditions, especially the current novel observation at the fiber type-selective level, strongly suggests a consequential linkage between these processes.
Increased insulin-independent glucose uptake immediately after contraction or exercise is a hallmark of muscle recruitment (9, 14, 44), and the exercise protocol used in the current study was found to increase insulin-independent glucose uptake in every fiber type studied (7). Furthermore, the current study demonstrated a robust elevation in pACCSer79, an AMPK substrate and widely used surrogate for enhanced AMPK activation (19, 25, 50), in each fiber type. In addition, every fiber type was characterized by a substantial increase in pAS160Ser704, a consensus AMPK phosphosite (52). These data, along with the exercise-induced increase in hexokinase II protein expression in IIX fibers, convincingly indicate that the lack of exercise effects on pAS160 or glucose uptake in insulin-stimulated IIX fibers was not attributable to an absence of IIX fiber recruitment.
What might account for enhanced pAS160Ser704 in IIX fibers IPEX but not 3.5hPEX? The active AMPK enzyme is a heterotrimeric complex, and the particular heterotrimer activation profile is important: Kjøbsted et al. (31, 32) recently provided evidence that contraction, exercise, or AICAR that activates γ3-containing AMPK heterotrimers results in enhanced pAS160Ser704, which may favor subsequently greater insulin-stimulation of pAS160Thr642, thereby resulting in increased insulin-stimulated glucose uptake. We recently reported that in whole epitrochlearis muscles, both γ3-AMPK activity and pAS160Ser704 are increased immediately and 3 h after cessation of exercise (54). It seems possible that γ3-AMPK activity was elevated in all fiber types IPEX (when pAS160Ser704 was increased for all fiber types), but that exercise-induced increases in γ3-AMPK activity were sustained at 3.5hPEX in type I, IIA, IIB, and IIBX fibers but not IIX fibers.
Although all fiber types had elevated pACCSer79 and pAS160Ser704 IPEX, we found that type I, IIB, and IIBX but not type IIA or IIX fibers had greater pAMPKThr172 IPEX versus unexercised controls. What might account for the uncoupling of IPEX effects on pAMPKThr172 compared with AMPK substrates pACCSer79 and pAS160Ser704 in IIA and IIX fibers? In addition to covalent activation by phosphorylation on Thr172, AMPK activity can be allosterically activated by elevated AMP concentration (26), so AMPK activity in IIA and IIX fibers might have been allosterically activated without altered pAMPKThr172. It is also possible that exercise resulted in greater pAMPKThr172 only in a particular subcellular location(s) that was not detectable using whole cell pAMPKThr172 analysis. In addition, it is conceivable that prior exercise induced a transient increase in pAMPKThr172 that had reversed when muscles were sampled IPEX.
Several earlier studies using skeletal muscle tissue rather than fiber type-selective analysis found that acute exercise can lead to increased insulin-stimulated glucose uptake without amplifying the levels of pAktThr308 or pAktSer473 (10, 23, 54). The current study revealed remarkable fiber type-related heterogeneity with regard to the effects of prior exercise on pAktThr308 or pAktSer473 in insulin-stimulated muscles 3.5hPEX. Prior exercise resulted in lower (IIX), unaltered (IIB and IIBX), or greater (I and IIA) insulin-stimulated pAktThr308 and pAktSer473 depending on fiber type. These widely variable fiber type-selective responses were undetectable with earlier whole tissue analysis. The underlying mechanism accounting for this variability is uncertain, but it is notable that prior exercise led to increased insulin-stimulated pAS160 and glucose uptake in type IIB and IIBX fibers in which there was no exercise effect on pAkt. The current results demonstrated that exercise-induced elevation in pAkt above SED control values is not essential for the postexercise improvement in insulin sensitivity, at least in these fiber types.
There is evidence that increased hexokinase II expression can result in greater insulin-stimulated glucose uptake by skeletal muscle (16). Earlier research has also demonstrated that hexokinase II mRNA expression and enzyme activity (41) of skeletal muscle tissue can be increased several hours after acute exercise. However, the effect of acute exercise on fiber type-selective hexokinase II abundance had not been previously reported. The results of the current study revealed significantly greater hexokinase II protein abundance in type I, IIB, IIBX, and IIX fibers and a strong trend for an increase (P = 0.06) in type IIA fibers. Because the relative magnitude of the increase in hexokinase II abundance was as great in type IIX fibers as in any other fiber type, the current data taken together with the earlier demonstration of increased insulin-stimulated glucose uptake in all fiber types except IIX fibers (7) suggest that increased hexokinase II abundance may play a necessary role, but it is not sufficient for increased insulin-stimulated glucose uptake in all fiber types after acute exercise.
Many studies have found that acute exercise of ~2-h duration can increase subsequent insulin-stimulated glucose uptake by skeletal muscle tissue from rats without altering total GLUT4 abundance determined from ~3 to 27 h postexercise (8, 10, 18, 24, 58), including two studies that used the same exercise protocol that was used in the current study (10, 18). However, several other studies reported an exercise-induced increase in muscle GLUT4 abundance when rats performed a longer duration of acute exercise (6 h) and muscles were analyzed 16hPEX (13, 36, 43). In addition, muscle GLUT4 protein abundance was elevated 3hPEX in humans who performed acute exercise of a 1-h duration (35). Therefore, it seemed possible GLUT4 abundance might be elevated in some, but not all, fiber types at 3.5hPEX. However, in the current study, there was no evidence for exercise-induced elevation in GLUT4 abundance in any of the fiber types demonstrating that increased GLUT4 expression was not part of the mechanism for elevated insulin-stimulated glucose uptake previously reported in type I, IIA, IIB, and IIBX fibers (7).
In conclusion, the regulation of glucose uptake is by definition a cellular process, and profound heterogeneity has long been recognized with regard to the metabolic properties of different muscle fiber types. Therefore, fully understanding the regulation of skeletal muscle signaling and glucose uptake will require innovative methods that reveal muscle characteristics at myocellular and fiber type-specific levels. In this context, the current study offered a unique perspective on the processes that are responsible for improved insulin sensitivity after acute exercise. The results provide strong and unique support for the hypothesized relationship between greater pAS160 and improved insulin-stimulated glucose uptake and exposed heterogeneity that could not have been discerned using conventional tissue analysis. The results also revealed further new insights into the mechanism for fiber type-selective increases in insulin-stimulated glucose uptake after acute exercise: 1) although most fiber types had a significant increase in hexokinase II abundance at 3.5hPEX, the robust increase in the hexokinase II abundance of IIX fibers indicates that this increase was insufficient to increase insulin-stimulated glucose uptake; and 2) the results clearly documented that increased GLUT4 protein abundance did not play a role in increased glucose uptake at 3.5hPEX in any fiber type studied. Although the current data substantially advanced the understanding about the mechanisms for greater insulin-stimulated glucose uptake, going forward, additional mechanistic approaches will be invaluable to directly test if the striking association between pAS160 and insulin-stimulated glucose uptake postexercise reflects a causal relationship.
GRANTS
This research was supported by National Institute of Diabetes and Digestive and Kidney Diseases Grant R01-DK-071771.
DISCLOSURES
No conflicts of interest, financial or otherwise, are declared by the authors.
AUTHOR CONTRIBUTIONS
H.W. and G.D.C. conceived and designed research; H.W., E.B.A., K.O., M.W.P., and J.A.A. performed experiments; H.W. analyzed data; H.W. and G.D.C. interpreted results of experiments; H.W. prepared figures; H.W. and G.D.C. drafted manuscript; H.W., E.B.A., K.O., M.W.P., J.A.A., and G.D.C. edited and revised manuscript; H.W., E.B.A., K.O., M.W.P., J.A.A., and G.D.C. approved final version of manuscript.
ACKNOWLEDGMENTS
We thank Manak Singh and Arhum Mahmood for technical assistance. We are grateful to Laurie Goodyear for providing the antibody against phospho-AS160 Ser704. We appreciate the helpful advice provided by JØrgen F.P. Wojtaszewski and Dorte E. Steenberg regarding the procedures for isolating freeze-dried myofibers.
REFERENCES
- 1.Albers PH, Pedersen AJ, Birk JB, Kristensen DE, Vind BF, Baba O, Nøhr J, Højlund K, Wojtaszewski JF. Human muscle fiber type-specific insulin signaling: impact of obesity and type 2 diabetes. Diabetes 64: 485–497, 2015. doi: 10.2337/db14-0590. [DOI] [PubMed] [Google Scholar]
- 2.Arias EB, Kim J, Funai K, Cartee GD. Prior exercise increases phosphorylation of Akt substrate of 160 kDa (AS160) in rat skeletal muscle. Am J Physiol Endocrinol Metab 292: E1191–E1200, 2007. doi: 10.1152/ajpendo.00602.2006. [DOI] [PubMed] [Google Scholar]
- 3.Arias EB, Wang H, Cartee GD. Akt substrate of 160 kDa dephosphorylation rate is reduced in insulin-stimulated rat skeletal muscle after acute exercise. Physiol Res 67: 143–147, 2018. [DOI] [PMC free article] [PubMed] [Google Scholar]
- 4.Bonen A, Tan MH, Watson-Wright WM. Effects of exercise on insulin binding and glucose metabolism in muscle. Can J Physiol Pharmacol 62: 1500–1504, 1984. doi: 10.1139/y84-248. [DOI] [PubMed] [Google Scholar]
- 5.Cartee GD. Mechanisms for greater insulin-stimulated glucose uptake in normal and insulin-resistant skeletal muscle after acute exercise. Am J Physiol Endocrinol Metab 309: E949–E959, 2015. doi: 10.1152/ajpendo.00416.2015. [DOI] [PMC free article] [PubMed] [Google Scholar]
- 6.Cartee GD. Roles of TBC1D1 and TBC1D4 in insulin- and exercise-stimulated glucose transport of skeletal muscle. Diabetologia 58: 19–30, 2015. doi: 10.1007/s00125-014-3395-5. [DOI] [PMC free article] [PubMed] [Google Scholar]
- 7.Cartee GD, Arias EB, Yu CS, Pataky MW. Novel single skeletal muscle fiber analysis reveals a fiber type-selective effect of acute exercise on glucose uptake. Am J Physiol Endocrinol Metab 311: E818–E824, 2016. doi: 10.1152/ajpendo.00289.2016. [DOI] [PMC free article] [PubMed] [Google Scholar]
- 8.Cartee GD, Briggs-Tung C, Kietzke EW. Persistent effects of exercise on skeletal muscle glucose transport across the life-span of rats. J Appl Physiol (1985) 75: 972–978, 1993. doi: 10.1152/jappl.1993.75.2.972. [DOI] [PubMed] [Google Scholar]
- 9.Castorena CM, Arias EB, Sharma N, Bogan JS, Cartee GD. Fiber type effects on contraction-stimulated glucose uptake and GLUT4 abundance in single fibers from rat skeletal muscle. Am J Physiol Endocrinol Metab 308: E223–E230, 2015. doi: 10.1152/ajpendo.00466.2014. [DOI] [PMC free article] [PubMed] [Google Scholar]
- 10.Castorena CM, Arias EB, Sharma N, Cartee GD. Postexercise improvement in insulin-stimulated glucose uptake occurs concomitant with greater AS160 phosphorylation in muscle from normal and insulin-resistant rats. Diabetes 63: 2297–2308, 2014. doi: 10.2337/db13-1686. [DOI] [PMC free article] [PubMed] [Google Scholar]
- 11.Castorena CM, Mackrell JG, Bogan JS, Kanzaki M, Cartee GD. Clustering of GLUT4, TUG, and RUVBL2 protein levels correlate with myosin heavy chain isoform pattern in skeletal muscles, but AS160 and TBC1D1 levels do not. J Appl Physiol (1985) 111: 1106–1117, 2011. doi: 10.1152/japplphysiol.00631.2011. [DOI] [PMC free article] [PubMed] [Google Scholar]
- 12.Chen S, Wasserman DH, MacKintosh C, Sakamoto K. Mice with AS160/TBC1D4-Thr649Ala knockin mutation are glucose intolerant with reduced insulin sensitivity and altered GLUT4 trafficking. Cell Metab 13: 68–79, 2011. doi: 10.1016/j.cmet.2010.12.005. [DOI] [PMC free article] [PubMed] [Google Scholar]
- 13.Chibalin AV, Yu M, Ryder JW, Song XM, Galuska D, Krook A, Wallberg-Henriksson H, Zierath JR. Exercise-induced changes in expression and activity of proteins involved in insulin signal transduction in skeletal muscle: differential effects on insulin-receptor substrates 1 and 2. Proc Natl Acad Sci USA 97: 38–43, 2000. doi: 10.1073/pnas.97.1.38. [DOI] [PMC free article] [PubMed] [Google Scholar]
- 14.Constable SH, Favier RJ, Cartee GD, Young DA, Holloszy JO. Muscle glucose transport: interactions of in vitro contractions, insulin, and exercise. J Appl Physiol (1985) 64: 2329–2332, 1988. doi: 10.1152/jappl.1988.64.6.2329. [DOI] [PubMed] [Google Scholar]
- 15.DeFronzo RA, Jacot E, Jequier E, Maeder E, Wahren J, Felber JP. The effect of insulin on the disposal of intravenous glucose. Results from indirect calorimetry and hepatic and femoral venous catheterization. Diabetes 30: 1000–1007, 1981. doi: 10.2337/diab.30.12.1000. [DOI] [PubMed] [Google Scholar]
- 16.Fueger PT, Hess HS, Posey KA, Bracy DP, Pencek RR, Charron MJ, Wasserman DH. Control of exercise-stimulated muscle glucose uptake by GLUT4 is dependent on glucose phosphorylation capacity in the conscious mouse. J Biol Chem 279: 50956–50961, 2004. doi: 10.1074/jbc.M408312200. [DOI] [PubMed] [Google Scholar]
- 17.Funai K, Schweitzer GG, Castorena CM, Kanzaki M, Cartee GD. In vivo exercise followed by in vitro contraction additively elevates subsequent insulin-stimulated glucose transport by rat skeletal muscle. Am J Physiol Endocrinol Metab 298: E999–E1010, 2010. doi: 10.1152/ajpendo.00758.2009. [DOI] [PMC free article] [PubMed] [Google Scholar]
- 18.Funai K, Schweitzer GG, Sharma N, Kanzaki M, Cartee GD. Increased AS160 phosphorylation, but not TBC1D1 phosphorylation, with increased postexercise insulin sensitivity in rat skeletal muscle. Am J Physiol Endocrinol Metab 297: E242–E251, 2009. doi: 10.1152/ajpendo.00194.2009. [DOI] [PMC free article] [PubMed] [Google Scholar]
- 19.Galic S, Loh K, Murray-Segal L, Steinberg GR, Andrews ZB, Kemp BE. AMPK signaling to acetyl-CoA carboxylase is required for fasting- and cold-induced appetite but not thermogenesis. eLife 7: e32656, 2018. doi: 10.7554/eLife.32656. [DOI] [PMC free article] [PubMed] [Google Scholar]
- 20.Geiger PC, Han DH, Wright DC, Holloszy JO. How muscle insulin sensitivity is regulated: testing of a hypothesis. Am J Physiol Endocrinol Metab 291: E1258–E1263, 2006. doi: 10.1152/ajpendo.00273.2006. [DOI] [PubMed] [Google Scholar]
- 21.Gonzalez E, McGraw TE. Insulin signaling diverges into Akt-dependent and -independent signals to regulate the recruitment/docking and the fusion of GLUT4 vesicles to the plasma membrane. Mol Biol Cell 17: 4484–4493, 2006. doi: 10.1091/mbc.e06-07-0585. [DOI] [PMC free article] [PubMed] [Google Scholar]
- 22.Gouspillou G, Sgarioto N, Norris B, Barbat-Artigas S, Aubertin-Leheudre M, Morais JA, Burelle Y, Taivassalo T, Hepple RT. The relationship between muscle fiber type-specific PGC-1α content and mitochondrial content varies between rodent models and humans. PLoS One 9: e103044, 2014. doi: 10.1371/journal.pone.0103044. [DOI] [PMC free article] [PubMed] [Google Scholar]
- 23.Hamada T, Arias EB, Cartee GD. Increased submaximal insulin-stimulated glucose uptake in mouse skeletal muscle after treadmill exercise. J Appl Physiol (1985) 101: 1368–1376, 2006. doi: 10.1152/japplphysiol.00416.2006. [DOI] [PubMed] [Google Scholar]
- 24.Hansen PA, Nolte LA, Chen MM, Holloszy JO. Increased GLUT-4 translocation mediates enhanced insulin sensitivity of muscle glucose transport after exercise. J Appl Physiol (1985) 85: 1218–1222, 1998. doi: 10.1152/jappl.1998.85.4.1218. [DOI] [PubMed] [Google Scholar]
- 25.Hardie DG. Regulation of fatty acid and cholesterol metabolism by the AMP-activated protein kinase. Biochim Biophys Acta 1123: 231–238, 1992. doi: 10.1016/0005-2760(92)90001-C. [DOI] [PubMed] [Google Scholar]
- 26.Hardie DG, Ashford ML. AMPK: regulating energy balance at the cellular and whole body levels. Physiology (Bethesda) 29: 99–107, 2014. doi: 10.1152/physiol.00050.2013. [DOI] [PMC free article] [PubMed] [Google Scholar]
- 27.Henriksen EJ, Bourey RE, Rodnick KJ, Koranyi L, Permutt MA, Holloszy JO. Glucose transporter protein content and glucose transport capacity in rat skeletal muscles. Am J Physiol 259: E593–E598, 1990. doi: 10.1152/ajpendo.1990.259.4.E593. [DOI] [PubMed] [Google Scholar]
- 28.Iwabe M, Kawamoto E, Koshinaka K, Kawanaka K. Increased postexercise insulin sensitivity is accompanied by increased AS160 phosphorylation in slow-twitch soleus muscle. Physiol Rep 2: e12162, 2014. doi: 10.14814/phy2.12162. [DOI] [PMC free article] [PubMed] [Google Scholar]
- 29.Karlsson HK, Zierath JR. Insulin signaling and glucose transport in insulin resistant human skeletal muscle. Cell Biochem Biophys 48: 103–113, 2007. doi: 10.1007/s12013-007-0030-9. [DOI] [PubMed] [Google Scholar]
- 30.Kjøbsted R, Hingst JR, Fentz J, Foretz M, Sanz MN, Pehmøller C, Shum M, Marette A, Mounier R, Treebak JT, Wojtaszewski JF, Viollet B, Lantier L. AMPK in skeletal muscle function and metabolism. FASEB J 32: 1741–1777, 2018. doi: 10.1096/fj.201700442R. [DOI] [PMC free article] [PubMed] [Google Scholar]
- 31.Kjøbsted R, Munk-Hansen N, Birk JB, Foretz M, Viollet B, Björnholm M, Zierath JR, Treebak JT, Wojtaszewski JF. Enhanced muscle insulin sensitivity after contraction/exercise is mediated by AMPK. Diabetes 66: 598–612, 2017. doi: 10.2337/db16-0530. [DOI] [PubMed] [Google Scholar]
- 32.Kjøbsted R, Treebak JT, Fentz J, Lantier L, Viollet B, Birk JB, Schjerling P, Björnholm M, Zierath JR, Wojtaszewski JF. Prior AICAR stimulation increases insulin sensitivity in mouse skeletal muscle in an AMPK-dependent manner. Diabetes 64: 2042–2055, 2015. doi: 10.2337/db14-1402. [DOI] [PubMed] [Google Scholar]
- 33.Kjøbsted R, Wojtaszewski JF, Treebak JT. Role of AMP-activated protein kinase for regulating post-exercise insulin sensitivity. Exp Suppl 107, Suppl: 81–126, 2016. doi: 10.1007/978-3-319-43589-3_5. [DOI] [PubMed] [Google Scholar]
- 34.Kong X, Manchester J, Salmons S, Lawrence JC Jr. Glucose transporters in single skeletal muscle fibers. Relationship to hexokinase and regulation by contractile activity. J Biol Chem 269: 12963–12967, 1994. [PubMed] [Google Scholar]
- 35.Kraniou GN, Cameron-Smith D, Hargreaves M. Acute exercise and GLUT4 expression in human skeletal muscle: influence of exercise intensity. J Appl Physiol (1985) 101: 934–937, 2006. doi: 10.1152/japplphysiol.01489.2005. [DOI] [PubMed] [Google Scholar]
- 36.Kuo CH, Hunt DG, Ding Z, Ivy JL. Effect of carbohydrate supplementation on postexercise GLUT-4 protein expression in skeletal muscle. J Appl Physiol (1985) 87: 2290–2295, 1999. doi: 10.1152/jappl.1999.87.6.2290. [DOI] [PubMed] [Google Scholar]
- 37.Leto D, Saltiel AR. Regulation of glucose transport by insulin: traffic control of GLUT4. Nat Rev Mol Cell Biol 13: 383–396, 2012. doi: 10.1038/nrm3351. [DOI] [PubMed] [Google Scholar]
- 38.MacKrell JG, Arias EB, Cartee GD. Fiber type-specific differences in glucose uptake by single fibers from skeletal muscles of 9- and 25-month-old rats. J Gerontol A Biol Sci Med Sci 67: 1286–1294, 2012. doi: 10.1093/gerona/gls194. [DOI] [PMC free article] [PubMed] [Google Scholar]
- 39.Mackrell JG, Cartee GD. A novel method to measure glucose uptake and myosin heavy chain isoform expression of single fibers from rat skeletal muscle. Diabetes 61: 995–1003, 2012. doi: 10.2337/db11-1299. [DOI] [PMC free article] [PubMed] [Google Scholar]
- 40.Megeney LA, Neufer PD, Dohm GL, Tan MH, Blewett CA, Elder GC, Bonen A. Effects of muscle activity and fiber composition on glucose transport and GLUT-4. Am J Physiol Endocrinol Metab 264: E583–E593, 1993. doi: 10.1152/ajpendo.1993.264.4.E583. [DOI] [PubMed] [Google Scholar]
- 41.O’Doherty RM, Bracy DP, Granner DK, Wasserman DH. Transcription of the rat skeletal muscle hexokinase II gene is increased by acute exercise. J Appl Physiol (1985) 81: 789–793, 1996. doi: 10.1152/jappl.1996.81.2.789. [DOI] [PubMed] [Google Scholar]
- 42.Pehmøller C, Brandt N, Birk JB, Høeg LD, Sjøberg KA, Goodyear LJ, Kiens B, Richter EA, Wojtaszewski JF. Exercise alleviates lipid-induced insulin resistance in human skeletal muscle-signaling interaction at the level of TBC1 domain family member 4. Diabetes 61: 2743–2752, 2012. doi: 10.2337/db11-1572. [DOI] [PMC free article] [PubMed] [Google Scholar]
- 43.Ren JM, Semenkovich CF, Gulve EA, Gao J, Holloszy JO. Exercise induces rapid increases in GLUT4 expression, glucose transport capacity, and insulin-stimulated glycogen storage in muscle. J Biol Chem 269: 14396–14401, 1994. [PubMed] [Google Scholar]
- 44.Richter EA, Hargreaves M. Exercise, GLUT4, and skeletal muscle glucose uptake. Physiol Rev 93: 993–1017, 2013. doi: 10.1152/physrev.00038.2012. [DOI] [PubMed] [Google Scholar]
- 45.Samuel VT, Petersen KF, Shulman GI. Lipid-induced insulin resistance: unravelling the mechanism. Lancet 375: 2267–2277, 2010. doi: 10.1016/S0140-6736(10)60408-4. [DOI] [PMC free article] [PubMed] [Google Scholar]
- 46.Sano H, Kane S, Sano E, Mîinea CP, Asara JM, Lane WS, Garner CW, Lienhard GE. Insulin-stimulated phosphorylation of a Rab GTPase-activating protein regulates GLUT4 translocation. J Biol Chem 278: 14599–14602, 2003. doi: 10.1074/jbc.C300063200. [DOI] [PubMed] [Google Scholar]
- 47.Schiaffino S, Reggiani C. Fiber types in mammalian skeletal muscles. Physiol Rev 91: 1447–1531, 2011. doi: 10.1152/physrev.00031.2010. [DOI] [PubMed] [Google Scholar]
- 48.Schweitzer GG, Arias EB, Cartee GD. Sustained postexercise increases in AS160 Thr642 and Ser588 phosphorylation in skeletal muscle without sustained increases in kinase phosphorylation. J Appl Physiol (1985) 113: 1852–1861, 2012. doi: 10.1152/japplphysiol.00619.2012. [DOI] [PMC free article] [PubMed] [Google Scholar]
- 49.Schweitzer GG, Cartee GD. Postexercise skeletal muscle glucose transport is normal in kininogen-deficient rats. Med Sci Sports Exerc 43: 1148–1153, 2011. doi: 10.1249/MSS.0b013e31820a7f65. [DOI] [PMC free article] [PubMed] [Google Scholar]
- 50.Scott JW, Norman DG, Hawley SA, Kontogiannis L, Hardie DG. Protein kinase substrate recognition studied using the recombinant catalytic domain of AMP-activated protein kinase and a model substrate. J Mol Biol 317: 309–323, 2002. doi: 10.1006/jmbi.2001.5316. [DOI] [PubMed] [Google Scholar]
- 51.Talmadge RJ, Roy RR. Electrophoretic separation of rat skeletal muscle myosin heavy-chain isoforms. J Appl Physiol (1985) 75: 2337–2340, 1993. doi: 10.1152/jappl.1993.75.5.2337. [DOI] [PubMed] [Google Scholar]
- 52.Treebak JT, Taylor EB, Witczak CA, An D, Toyoda T, Koh HJ, Xie J, Feener EP, Wojtaszewski JF, Hirshman MF, Goodyear LJ. Identification of a novel phosphorylation site on TBC1D4 regulated by AMP-activated protein kinase in skeletal muscle. Am J Physiol Cell Physiol 298: C377–C385, 2010. doi: 10.1152/ajpcell.00297.2009. [DOI] [PMC free article] [PubMed] [Google Scholar]
- 53.Wallberg-Henriksson H, Constable SH, Young DA, Holloszy JO. Glucose transport into rat skeletal muscle: interaction between exercise and insulin. J Appl Physiol (1985) 65: 909–913, 1988. doi: 10.1152/jappl.1988.65.2.909. [DOI] [PubMed] [Google Scholar]
- 54.Wang H, Arias EB, Pataky MW, Goodyear LJ, Cartee GD. Postexercise improvement in glucose uptake occurs concomitant with greater γ3-AMPK activation and AS160 phosphorylation in rat skeletal muscle. Am J Physiol Endocrinol Metab 315: E859–E871, 2018. doi: 10.1152/ajpendo.00020.2018. [DOI] [PMC free article] [PubMed] [Google Scholar]
- 55.Wang H, Arias EB, Yu CS, Verkerke AR, Cartee GD. Effects of calorie restriction and fiber type on glucose uptake and abundance of electron transport chain and oxidative phosphorylation proteins in single fibers from old rats. J Gerontol A Biol Sci Med Sci 72: 1638–1646, 2017. doi: 10.1093/gerona/glx099. [DOI] [PMC free article] [PubMed] [Google Scholar]
- 56.Wojtaszewski JF, Hansen BF, Gade J, Kiens B, Markuns JF, Goodyear LJ, Richter EA. Insulin signaling and insulin sensitivity after exercise in human skeletal muscle. Diabetes 49: 325–331, 2000. doi: 10.2337/diabetes.49.3.325. [DOI] [PubMed] [Google Scholar]
- 57.Wojtaszewski JF, Hansen BF, Kiens B, Richter EA. Insulin signaling in human skeletal muscle: time course and effect of exercise. Diabetes 46: 1775–1781, 1997. doi: 10.2337/diab.46.11.1775. [DOI] [PubMed] [Google Scholar]
- 58.Xiao Y, Sharma N, Arias EB, Castorena CM, Cartee GD. A persistent increase in insulin-stimulated glucose uptake by both fast-twitch and slow-twitch skeletal muscles after a single exercise session by old rats. Age (Dordr) 35: 573–582, 2013. doi: 10.1007/s11357-012-9383-0. [DOI] [PMC free article] [PubMed] [Google Scholar]


