Abstract
We investigated the migration of intestinal immune cells to the liver and their contribution to alcoholic liver disease. In mice fed ethanol, we found that an increased number of invariant natural killer T (iNKT) cells, which respond to the antigen presented by CD1d, migrated from mesenteric lymph nodes to the liver. iNKT cells react to lipid antigens, so we studied their activities in mice with intestinal epithelial cell-specific deletion of Pparg (PpargΔIEC) as a model for altering intestinal lipidomic profiles. Levels of CD1d increased in intestines of ethanol-fed PpargΔIEC mice, and in cell-tracking experiments, more iNKT cells migrated to the liver, compared with mice without disruption of Pparg. Livers of PpargΔIEC mice had increased markers of apoptosis and liver injury after ethanol feeding. iNKT cells isolated from livers of ethanol-fed PpargΔIEC mice induced apoptosis of cultured hepatocytes. An inhibitor of iNKT cells reduced ethanol-induced liver injury in PpargΔIEC mice. Duodenal tissues from patients with alcohol-use disorder have been found to have increased levels of CD1d compared with tissues from patients without alcohol overuse. Ethanol use, therefore, activates iNKT cells in the intestine to migrate to liver, where they—along with the resident hepatic iNKT cells—contribute to hepatocyte death and injury.
NEW & NOTEWORTHY In this article, we studied migration of intestinal immune cells into the liver in response to ethanol-induced liver disease. We found that chronic ethanol feeding induces expression of CD1d by enterocytes, which activate invariant natural killer T (iNKT) cells in mesenteric lymph nodes; activation is further increased with loss of peroxisome proliferator-activated receptor gamma gene and altered lipid profiles. The activated iNKT cells migrate into the liver, where they promote hepatocyte apoptosis. Patients with alcohol use disorder have increased expression of CD1d in the small intestine. Strategies to block these processes might be developed to treat alcoholic liver disease.
Keywords: ALD model, immune regulation, invariant natural killer T, Kaede transgenic mice, liver damage
INTRODUCTION
Intestinal immune cells help maintain liver homeostasis (17), but their contribution to liver disease is poorly understood. Alcohol abuse is a leading cause of advanced liver disease in the West (23). Chronic alcohol consumption promotes hepatocyte cell death and liver fibrosis, which increases risk for hepatocellular carcinoma (4, 15). The pathogenesis of alcoholic liver disease is complex and involves interactions between gut and the liver. For example, chronic alcohol consumption causes enteric dysbiosis and gut barrier dysfunction, resulting in translocation of bacteria and bacterial products to the liver, where they are toxic (7, 9, 25).
Type I or invariant natural killer T (iNKT) cells express markers of NK cells and a semi-invariant T-cell receptor (TCR) (20). iNKT cells are activated by lipid antigens presented by CD1d molecules on antigen-presenting cells. CD1d is the only member of the group 2 CD1 family of class I, MHC-like lipid antigen-presenting molecules and is expressed in a variety of cells, including epithelial cells in the liver and intestine. Upon activation, iNKT cells can migrate through the circulatory system and induce apoptosis to promote organ injury (11). iNKT cells are common in the intestine. Lipids derived from the intestinal epithelium might contribute to activation of iNKT cells in the intestine, leading to cell death and organ damage (3).
There is an association between hepatic iNKT cells and alcoholic liver disease. iNKT-cell-induced inflammation and neutrophil recruitment mediate hepatocyte death after chronic alcohol feeding (10, 20). However, the source of these iNKT cells and their mechanisms of activation are unclear. We discovered a new mechanism by which intestinal iNKT cells become activated and move to the liver, where they contribute to liver disease.
MATERIALS AND METHODS
Mice.
Kaede-Tg mice on a C57BL/6 genetic background were obtained from Riken (26). Mice with loxP sites inserted in the peroxisome proliferator-activated receptor gamma gene (Ppargfl/fl) were obtained from Jackson Laboratory and crossed with villin-Cre transgenic mice to create mice with a disruption in Pparg specifically in intestinal epithelial cells (PpargΔIEC). Villin-Cre negative littermates were used as controls. PpargΔIEC mice were crossed with Kaede-Tg mice (PpargΔIEC/Kaede-Tg). Male mice (aged 8–12 wk old) were fed the Lieber-DeCarli diet for 8 wk (28). The caloric intake from ethanol was 0 on day 1, 10% of total calories on days 2–4, 20% on days 5–7, 30% from day 8 until the end of 6 wk, and then 36% for the last 2 wk. The Lieber-DeCarli diet comprises Micro Stabilized Rod Liq AC IRR (LD101A; TestDiet, St. Louis, MO) and maltodextrin IRR (9598; TestDiet) and 200-proof ethanol (Gold Shield, Hayward, CA). Control mice were fed an isocaloric amount of iso-maltose instead of ethanol. A subset of mice was given antibiotics daily by gavage. The composition of the antibiotic mixture was polymyxin B (150 mg·kg body wt−1·day−1) and neomycin (200 mg·kg body wt−1·day−1) (9). Mice were given intraperitoneal injections of tazarotene (0.3 mg/mouse) biweekly (20). All protocols on animals were approved by the Institutional Animal Care and Use Committee of the University of California, San Diego.
Photoconversion of Kaede-Tg mice.
For in vivo tracing of intestinal immune cells, photoconversion was performed, as described, with minor modifications (22). After anesthesia, laparotomy was performed, and each mesenteric lymph node was exposed to violet light (405 nm; peak power <5 mW; sustained power: 0.5–4.9 mW) for a period of 3.5 min (direct exposure) using a hand-held laser (Electra Pro Series Violet Handheld Laser; Laserglow Technologies, Toronto, ON, Canada). Intestine and mesentery were rinsed with 0.9% normal saline and repositioned into the peritoneal cavity, the abdominal wall was closed with nylon sutures, and neomycin (0.5%) cream was applied topically to the sutures. Livers and mesenteric lymph nodes (MLN) from mice were harvested 48 h after the surgery, and isolated cells were analyzed by flow cytometry.
Isolation of mononuclear cells from mesenteric lymph nodes and liver.
Tissue was cut into small pieces and incubated for 30 min in RPMI1640 medium, then minced through a 70-μm cell strainer. Cells were washed once with RPMI 1640 medium, centrifuged at 800 g for 5 min, and fractions were loaded onto a 33% (vol/vol) Percoll solution (15 ml), followed by centrifugation at 800 g for 30 min at room temperature with no brake. After supernatants were aspirated, the cells were resuspended in a 3-ml red blood cell lysing buffer (Sigma, St. Louis, MO) for 5 min, diluted with 9 ml of RPMI1640 medium, and centrifuged at 800 g for 5 min at 4°C; the supernatant was discarded. After cells were washed twice with 10 ml RPMI 1640 medium and centrifuged at 800 g for 5 min at 4°C, they were resuspended in fluorescence-activated cell sorting (FACS) buffer, and live cells were counted. The normo-osmotic Percoll solution was prepared by mixing 92.5 ml of Percoll plus (GE Healthcare) with 7.2 ml of 10 HBSS (Gibco, Gaithersburg, MD) and 1.2 ml of 7.5% (wt/vol) sodium bicarbonate solution (Gibco).
Isolation of peripheral blood mononuclear cells (PBMC) from portal vein.
After transfer of portal blood (300–400 μl) into a plastic tube with heparin 1,000 U/ml, whole blood was diluted with two volumes of PBS. After 3 ml of Ficoll-Paque plus (GE Healthcare, New York, NY) were placed in a 15-ml Falcon tube, the peripheral blood/PBS solution was carefully layered onto Ficoll-Paque plus and centrifuged at 800 g for 30 min at room temperature (RT) with no brake. After the upper PBS layer was removed, PBMCs were harvested at the interface, washed twice with 10 ml of PBS by centrifugation at 800 g for 5 min at RT, and resuspended with 3 ml of red blood cell lysing solution (Sigma) for 3 min at RT. After centrifugation at 800 g for 5 min at RT, PBMCs were washed twice with RPMI 1640 medium by centrifugation at 800 g for 5 min at RT. Finally, PBMCs were resuspended with 10 ml of RPMI 1640 culture medium, and live cell numbers were counted.
Isolation and culture of primary mouse cells.
Primary mouse hepatocytes were isolated from wild-type (WT) mice, as described previously (28). After isolation, primary hepatocytes were seeded into 24-well plates with a density of 5 × 10⁴ cells per well until cocultured with iNKT cells.
For isolation of hepatic iNKT cells, mice were fed with control or ethanol-containing liquid diet for 4 wk. The caloric intake from ethanol was 0 on day 1, 10% of total calories on days 2 and 3, 20% on days 4 and 5, 30% on days 6 and 7, and 36% from day 8 until the end of the experiment (day 28). Isolated mononuclear cells were incubated with Fc block (1 µg/106 cells, 10 min at 4°C) and then APC-conjugated αGalCer/mCD1d tetramers (2 µg/106 cells, 30 min at 4°C). After washing was completed, 20 μl APC-microbeads (Miltenyi Biotec, Gladbach, Germany) with 80 μl MACS buffer were added per 107 cells and incubated for 15 min at 4°C. Cells were eluted through MACS-LS column and counted for coculture studies. The APC-conjugated αGalCer/mCD1d tetramer was produced in-house from High Five insect cells (BTI-TN-5B1–4) using the Baculovirus Expression Vector System (Thermo Fisher Scientific, Waltham, MA). Synthetic αGalCer was provided by Kirin Brewery (Tokyo, Japan), dissolved in vehicle (0.5% Tween 20 and 0.9% NaCl solution), and further diluted in PBS.
Primary mouse hepatocytes (5 × 10⁴/well in a 24-well plate) were directly cocultured with vehicle (50 μl RPMI-1640) or with 5 × 10³ isolated hepatic iNKT cells. To further determine whether hepatocyte apoptosis is mediated by FASL of iNKT, FASL-neutralizing antibody (clone MFL4, Table 1) or an isotype control antibody (Table 1) was added to iNKT cell suspension at a concentration of 10 μg/ml for 10 min at 37°C before coculture. Sixteen hours after coculture, apoptotic hepatocytes were identified on the basis of expression of Annexin V (BV421; Biolegend, San Diego, CA) for 15 min at RT. Primary mouse intestinal epithelial cells were isolated as described previously (9).
Table 1.
Antibodies
| Antibody | Source | Antibody Name | Antibody Number |
|---|---|---|---|
| iNKT FACS in PpargΔIEC mice | |||
| CD45 | Biolegend | APC-CY7 | 103116 |
| αGalCer/CD1d | In house | PE | |
| TCRβ | Biolegend | FITC | 109206 |
| iNKT FACS in PpargΔIEC/Kaede-Tg or Kaede-Tg mice | |||
| TCRβ | Biolegend | PerCP-cy5.5 | 109228 |
| αGalCer/CD1d | In house | APC | |
| CD45 | Biolegend | APC-CY7 | 103116 |
| Immunoblotting of mouse liver | |||
| β-Actin | Sigma | A5441 | |
| Cyp2e1 | Millipore | AB1252 | |
| Immunohistochemistry of human samples | |||
| CD1d | Abcam | ab 151768 | |
| Coculture of hepatocytes and iNKT | |||
| IgG3 | BD PharMingen | 551386 | |
| MFL4 | BD PharMingen | 555022 | |
Cyp2e1, cytochrome P-450 family 2 subfamily E member 1; iNKT, invariant natural killer T; TCRβ, T-cell receptor-β. CD, cluster of differentiation; α-GalCer, α-galactosylceramide; MFL4, anti-Fas Ligand antibody.
Lipidomic analysis.
The extraction of lipids from isolated intestinal epithelial cells was conducted, as described previously (24). Samples were ground and homogenized on ice before vortexing. For lipid extraction, 50 mg of tissue was mixed with 900 μl of extraction buffer (100% isopropanol, IPA). The sample was then incubated on ice for 10 min before it was centrifuged again at 14,000 rpm at 4°C for 10 min. Supernatant was transferred to a fresh glass vial for ultraperformance liquid chromatography-quadrupole time-of-flight mass spectrometry (UPLC QTOF-MS) analysis. Quality control (QC) samples were prepared by pooling aliquots of all samples that were representative of the enterocyte samples. Blank samples (100% IPA) and QC samples were injected every five samples during acquisition. The extracted samples were rerandomized for liquid chromatography (LC)–MS analysis, such that the injection order was independent from the order of sample preparation to minimize systematic bias. The UPLC-QTOF/MS analyses were performed using a UPLC system (ACQUITY UPLC I-Class, Waters, Manchester, UK) coupled to an electrospray ionization quadruple time-of-flight mass spectrometer (Xevo G2-S Q-TOF, Waters). Waters ACQUITY UPLC CSH column (1.7 μm; 100 mm × 2.1 mm) was used for the LC separation and the column was kept as 55°C. The flow rate was 0.4 ml/min, and the sample injection was 2 μl. The mobile phase A was 0.1% formic acid/10 mM ammonium formate in acetonitrile/water 6:4 vol/vol, and mobile phase B was 0.1% formic acid/10 mM ammonium formate in IPA/acetonitrile (9:1 vol/vol). The linear gradient was the following: initial: 40% B, 0–2 min: 40% B to 43% B, 2–2.1 min: 43% B to 50% B, 2.1–12 min: 50% B to 54% B, 12–12.1 min: 54% B to 70% B, 12.1–18 min: 70% B to 99% B, 18–18.1 min: 99% B to 40% B, and 18.1–20 min: 40% B. High-accuracy MS data were recorded by MassLynx 4.1 software (Waters, Manchester, UK). Capillary voltage was 3 kV for both positive and negative mode, whereas cone voltage was 25 V for both modes. Source was set at 120°C with a cone gas flow of 50 l/h, and desolvation temperature was set at 400°C with desolvation gas flow of 800 l /h. Leucine–enkephalin (Waters) was used as the lock mass generating a reference ion at m/z 556.2771 in positive mode and m/z 554.2615 in negative mode, which was introduced by a lock spray at 5 μl/min for data calibration. The MSE data were acquired in continuum mode using ramp collision energy in two-scan functions. For low-energy mode, scan range 50–2,000 Da, scan time 0.2 s, and collision energy 6 V were set; for high-energy mode, scan range 50–2,000 Da, scan time 0.2 s, and a collision energy ramp 15–60 V were set.
FACS.
Mouse-specific antibodies are shown in Table 1. Mouse Fc block was used to block binding of aggregated immunoglobulins to the FcγIi receptors (eBioscience, San Diego, CA). Flow cytometry was performed on a FACSCanto II cytometer (BD Biosciences, San Jose, CA).
PCR.
RNA was extracted from mouse liver using the TRIzol reagent (Invitrogen, Carlsbad, CA). After DNase treatment with the DNA-free Kit (Thermo Fisher Scientific), RNA was reverse transcribed using the high-capacity cDNA reverse transcription kit (Applied Biosystems, Carlsbad, CA). Primer sequences were obtained from the National Institutes of Health qPrimerDepot. Real-time quantitative (q)PCR was performed with the iTaq universal SYBR Green supermix (Bio-Rad, Hercules, CA) using the StepOnePlus real-time PCR system (Applied Biosystems). The qPCR value was normalized to mouse 18S (9).
We used nested PCR analysis to detect hepatic Va14-Ja18 mRNA. In brief, first-round PCR was performed with the following primers: 5′-ATGAAAAAGCGCCTGAGTGCC-3′ and 5′-CAGGAGGATTCGGAGTCCCA-3′ using the following cycle conditions: 40 cycles of 94°C for 1 min, 53°C for 1 min, and 72°C for 2 min. Five microliters of first-round PCR product were used to run in the nested PCR with the following primers 5′-TAAGCACAGCACGTGCACAT-3′ and 5′-CAATCAGCTGAGTCCCAGCT-3′ using the following cycle conditions: 40 cycles of 94°C for 1 min, 52°C for 1 min, and 72°C for 2 min. Products were visualized and quantified on a 3% agarose gel.
Bacterial DNA was isolated from mouse feces, as previously described (16). The primer sequence for microbial 16S rRNA gene has been published (19). To quantify the total bacterial load present in feces, the qPCR value for each sample was multiplied by the total amount of DNA (μg)/mg of feces.
Biochemical assays.
Plasma levels of alanine aminotransferase (ALT) were determined using the Infinity ALT kit (Thermo Fisher Scientific). Hepatic levels of triglyceride were measured using the triglyceride liquid reagents kit (Pointe Scientific, Canton, MI). Plasma levels of ethanol were measured using the ethanol assay kit (BioVision, Milpitas, CA). Plasma levels of LPS in the portal vein were determined using the ELISA kit (Cloud-Clone, Katy, TX). The terminal deoxynucleotide transferase-mediated dUTP nick-end labeling (TUNEL) assay was performed using an in situ cell death detection kit (Roche Diagnostics, Mannheim, Germany). We randomly selected 6–8 high-power fields for counting TUNEL-positive cells and normalized numbers to total cells. Mouse feces were homogenized in PBS containing cOmplete mini protease inhibitor cocktail (Roche, Indianapolis, IN) with 1-mm glass beads. After centrifugation, supernatant was used for albumin ELISA (Bethyl Laboratories, Montgomery, TX).
Immunoblotting.
Blots were incubated with antibodies against Cyp2e1 (Millipore, Billerica, MA) and β-actin (Abcam, Cambridge, MA). The densities of immunoblots were analyzed by NIH ImageJ.
Human samples.
Patients who have alcohol use disorder and with active alcohol consumption were compared with nonalcoholic individuals (controls). We obtained duodenal biopsies from patients and controls with endoscopically normal duodenum that were fixed in formalin. Written informed consent was obtained from all patients and controls. Patients did not take antibiotics or immunosuppressive medication during the 2 mo before study enrollment. Other exclusion criteria were diabetes, inflammatory bowel disease, known liver disease of any other etiology, and clinically significant cardiovascular, pulmonary, or renal comorbidities. The study protocol was approved by the Ethics Committee of the Université Catholique de Louvain, in Brussels, Belgium, by the Human Research Protections Program of the University of California, San Diego, and of the Veterans Affairs San Diego Healthcare System. Immunohistochemistry for CD1d was performed using an antibody against CD1d (Abcam). Antibodies are shown in Table 1.
Statistical analysis.
Results are represented as means ± SEM. For lipidomic analysis, screened data were taken into account after correcting for individual bias using QC and blank data. EZinfo 3.0 controlled by Progenesis QI was used to perform principal component analysis, orthogonal partial least squares (OPLS) discriminant analysis, variable importance in projection (VIP), and coefficients versus VIP spots. Other statistical analyses were conducted using R software version 2.9.1. The OPLS score plots and t-test and VIP statistics were used to select significant variables leading to group separation. A supervised OPLS analysis was applied in our study to identify potential lipids that were used to classify the samples and remove noncorrelated variables. The differences between the two groups were compared by Student’s t-test when the data followed a normal distribution or by Wilcoxon rank-sum test when data were otherwise. In this study, the identified lipids were preselected as potential biomarkers when the VIP value was larger than 1.0. All other data were analyzed with GraphPad Prism 4 (GraphPad Software, San Diego, CA). Significant differences were analyzed using the Mann-Whitney U-test. A P value less than 0.05 was considered to be statistically significant.
RESULTS
Intestinal iNKT cells migrate to the liver during chronic ethanol feeding.
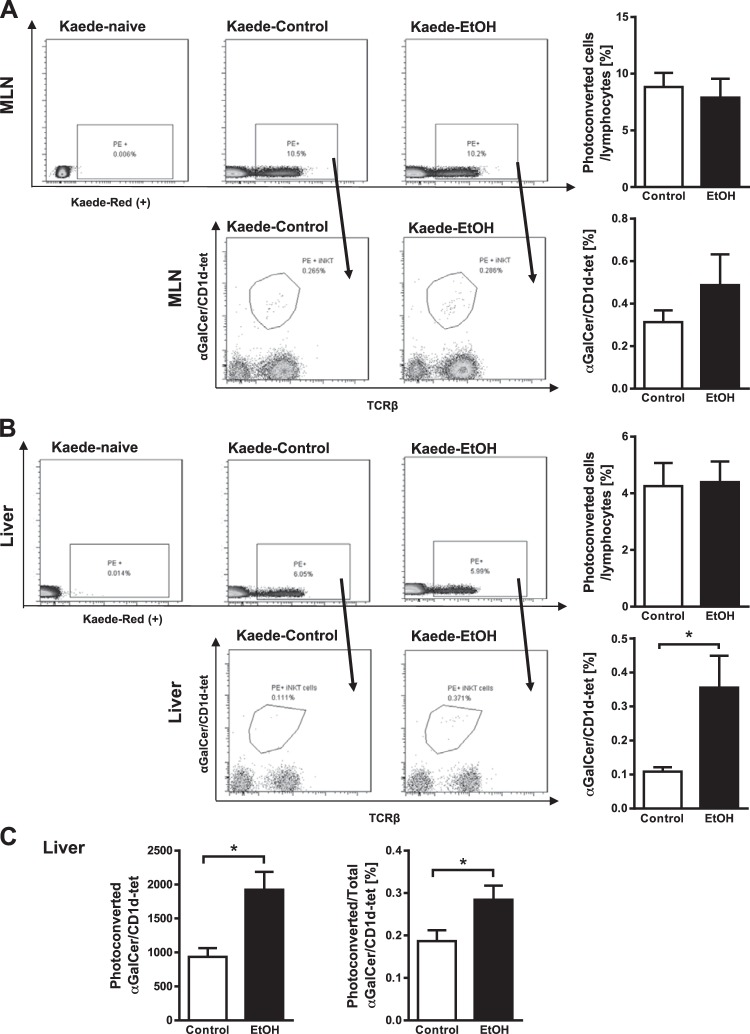
Kaede is a photoconvertible fluorescent protein that changes from green to red upon exposure to violet light (26). We monitored migration of immune cells from the intestine to the liver in mice that express the Kaede transgene (Kaede-Tg mice), which were placed on the Lieber-DeCarli ethanol diet to induce liver damage, and mice fed isocaloric diet (controls). After the mice were fed ethanol for 8 wk, we photoconverted cells in mesenteric lymph nodes and monitored their migration to liver. In flow cytometry analyses, we found no difference in the percentage of photoconverted CD45+ cells or photoconverted intestinal iNKT cells (α-galactosyl ceramide (α-GalCer)/CD1d-tetramer+ cells) in mesenteric lymph nodes of control versus ethanol-fed mice (Fig. 1A). The percentage of photoconverted CD45+ cells that migrated from mesenteric lymph nodes to liver did not differ significantly between control and ethanol-fed mice (Fig. 1B).
Fig. 1.
Tracking immune cell migration from mesenteric lymph nodes to the liver in Kaede-transgenic (Tg) mice after chronic ethanol feeding. Kaede-Tg mice were fed an oral control diet (n = 8) or ethanol (EtOH) diet (n = 8) for 8 wk following the chronic Lieber-DeCarli diet model. Photoconversion was performed in mesenteric lymph nodes (MLN), and livers and MLN were harvested after 48 h. Kaede-Tg naïve denotes Kaede-Tg mice that underwent surgery but did not undergo photoconversion. A: flow cytometry data of photoconverted CD45+ cells (top, gated from forward and sidescatter, as well as CD45+, then phycoerythrin+ (PE+), and photoconverted invariant natural killer T (iNKT) cells (based on αGalCer/CD1d-tet) in mesenteric lymph nodes (bottom, gated from all photoconverted CD45+ cells). Graphs on the right show the ratio of total photoconverted cells to CD45+ (top) and total photoconverted iNKT cells to total photoconverted cells (bottom). B: flow cytometry data of photoconverted CD45+ cells (top, gated from CD45+, then PE+) and photoconverted iNKT cells in livers (bottom, gated from all photoconverted CD45+ cells). Graphs on the right show the ratio of total photoconverted cells to CD45+ (top) and total photoconverted iNKT cells to total photoconverted cells (bottom). C: absolute numbers of photoconverted iNKT cells migrated to the livers (left) and percentages of migrated photoconverted iNKT to total hepatic iNKT cells (right). *P < 0.05.
However, an increased number of photoconverted CD1d-restricted iNKT cells migrated from mesenteric lymph nodes to livers of ethanol-fed mice compared with controls (Fig. 1B). Numbers of nonphotoconverted iNKT cells increased slightly in mesenteric lymph nodes but not in livers of ethanol-fed mice (data not shown). The absolute number of iNKT cells migrated to the liver was 1,924 ± 264 after chronic ethanol feeding and 935.3 ± 127.6 in isocaloric diet-fed mice. The proportion of photoconverted intestinal iNKT that have migrated to the liver was 0.28 ± 0.03 % of total liver iNKT cells in ethanol-fed mice (Fig. 1C).
Nonphotoconverted CD4+ T cells increased in livers, whereas CD8+ T cells decreased in mesenteric lymph nodes of ethanol-fed mice (data not shown). There was no difference in cell migration of CD4+ or CD8+ T cells (data not shown). iNKT cells, therefore, appear to be activated in the intestine during chronic ethanol administration and migrate to the liver.
Ethanol feeding alters lipidomic profiles and upregulates CD1d in intestinal enterocytes.
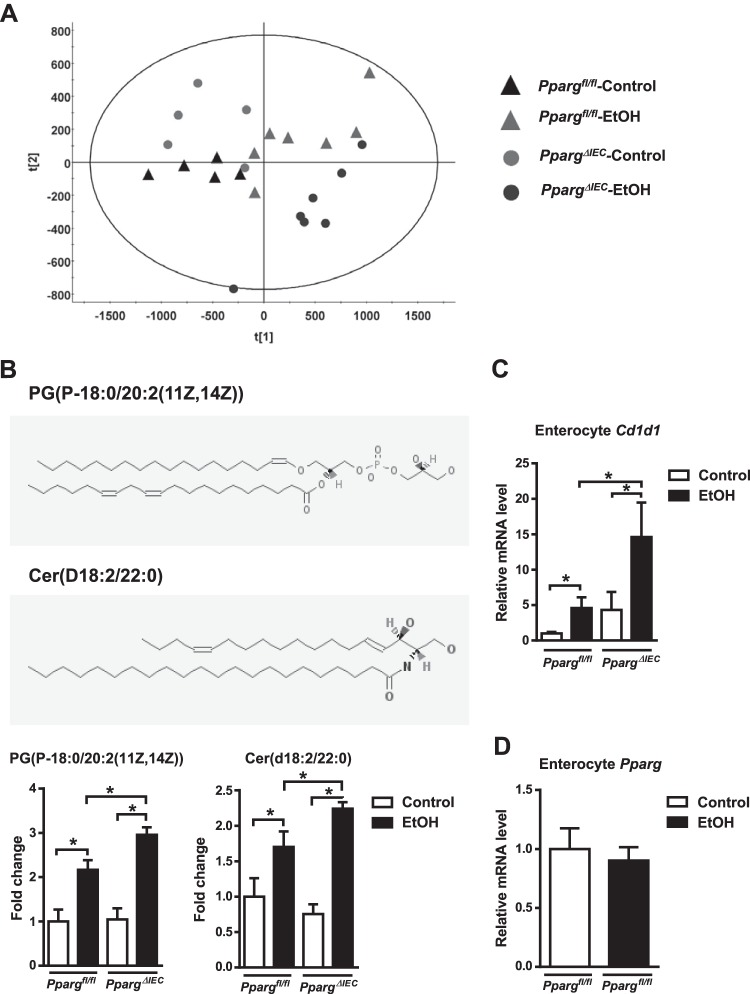
iNKT cells are stimulated by lipid antigens presented by CD1d molecules. We analyzed intestinal lipid profiles of mice with intestinal epithelial cell-specific disruption of peroxisome proliferator-activated receptor gamma gene (PpargΔIEC) versus mice without deletions in the gene Ppargfl/fl as a model for changing intestinal lipidomic profiles. PPARG regulates fatty acid metabolism, affects intracellular lipids, and modulates immune cells (2, 18). A principal component analysis of lipid profiles of isolated enterocytes was performed. The larger the distance between different groups, the more distinct lipidomic profiles are. Indeed, isolated enterocytes of control or ethanol-fed PpargΔIEC mice had altered lipidomic profiles compared with Ppargfl/fl mice (Fig. 2A). Notably, the levels of two lipid compounds, PG(P-18:0/20:2(11Z,14Z)) and Cer(d18:2/22:0) (Fig. 2B), were significantly higher in enterocytes of ethanol-fed Ppargfl/fl mice than in control-fed mice, and even higher in ethanol-fed PpargΔIEC mice (Fig. 2B).
Fig. 2.
Ethanol feeding changes lipidomic profiles and induces CD1d expression in intestinal enterocytes. Ppargfl/fl and PpargΔIEC mice were fed an oral control diet (n = 5) or ethanol diet (n = 7) for 8 wk. A: principal component analysis of lipid profiles of isolated enterocytes. B, top: structures of PG (P-18:0/20:2(11Z,14Z)) denotes 1-(1Z-octadecenyl)-2-(11Z,14Z-eicosadienoyl)-glycero-3-phospho-(1′-sn-glycerol). B, bottom: Cer (d18:2/22:0) denotes N-(docosanoyl)-4E,14Z-sphingadienine. Source: PubChem Substance and Compound databases. In addition, fold change in lipid compounds PG(P-18:0/20:2(11Z,14Z)) and Cer(d18:2/22:0) in enterocytes from different mice. C: small intestine expression of Cd1d mRNA. *P < 0.05. D: expression of Pparg mRNA in enterocytes upon alcohol feeding in Ppargfl/fl mice.
Levels of Cd1d mRNA, which encodes a protein that presents lipid molecules to iNKT cells, were increased in enterocytes from ethanol-fed Ppargfl/fl mice, compared with control-fed mice, and increased to a greater extent in ethanol-fed PpargΔIEC mice (Fig. 2C). Ethanol feeding had no effect on expression of Pparg mRNA in enterocytes of Ppargfl/fl mice (Fig. 2D). Ethanol, therefore, alters lipid metabolism and increases expression of CD1d in enterocytes, which may induce activation of iNKT cells in the gut and mesenteric lymph nodes. Using an intestinal epithelial cell-specific deletion of Pparg in mice, we have established an experimental model of enhanced iNKT cell activation in the intestine, mimicking changes that occur with chronic ethanol administration. This allows us now to study migration of activated iNKT cells and their contribution to ethanol-induced liver disease.
iNKT cells increase in mesenteric lymph nodes after chronic ethanol feeding.
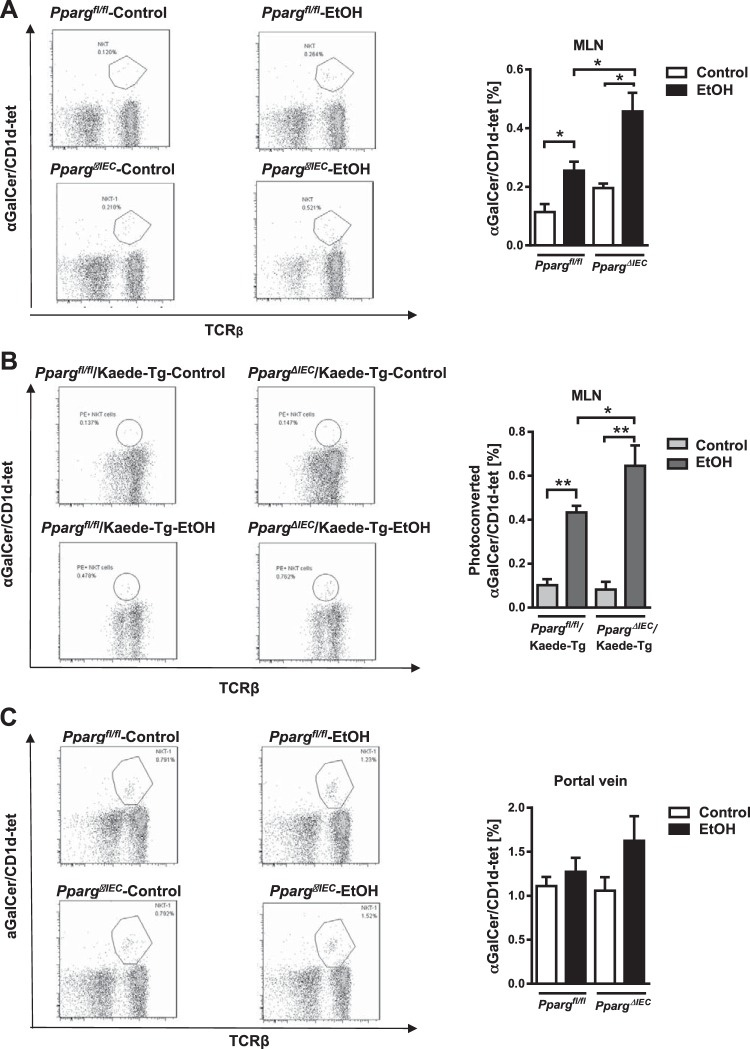
Ethanol feeding resulted in increased frequency of iNKT cells in mesenteric lymph nodes of Ppargfl/fl mice and to a greater extent in PpargΔIEC mice (Fig. 3A). Ethanol-fed PpargΔIEC/Kaede-Tg mice had an increased number of photoconverted iNKT cells in mesenteric lymph nodes compared with ethanol-fed Ppargfl/fl/Kaede-Tg mice (Fig. 3B), and an increased number of iNKT cells in the portal vein (Fig. 3C).
Fig. 3.
Increased invariant natural killer T (iNKT) cells in mesenteric lymph nodes (MLN) following ethanol feeding. A: Ppargfl/fl and PpargΔIEC mice were fed an oral control diet (n = 5 or 6) or ethanol diet (n = 5) for 8 wk. Flow cytometry of iNKT cells (based on αGalCer/CD1d-tet) in MLN. B: PpargΔIEC/Kaede transgenic and Ppargfl/fl/Kaede transgenic mice were fed an oral control diet (n = 5) or ethanol diet (n = 8) for 8 wk. Photoconversion was performed in MLN, and MLN were harvested after 48 h. Flow cytometry of photoconverted iNKT cells in MLN (left). *P < 0.05. **P < 0.01. C: Ppargfl/fl and PpargΔIEC mice were fed an oral control diet (n = 5 or 6) or ethanol diet (n = 5) for 8 wk. iNKT cells in portal vein, based on flow cytometry.
Hepatic iNKT cells from ethanol-fed mice are chronically activated, downmodulate TCRs, undergo apoptosis, and express higher levels of Fas ligand.
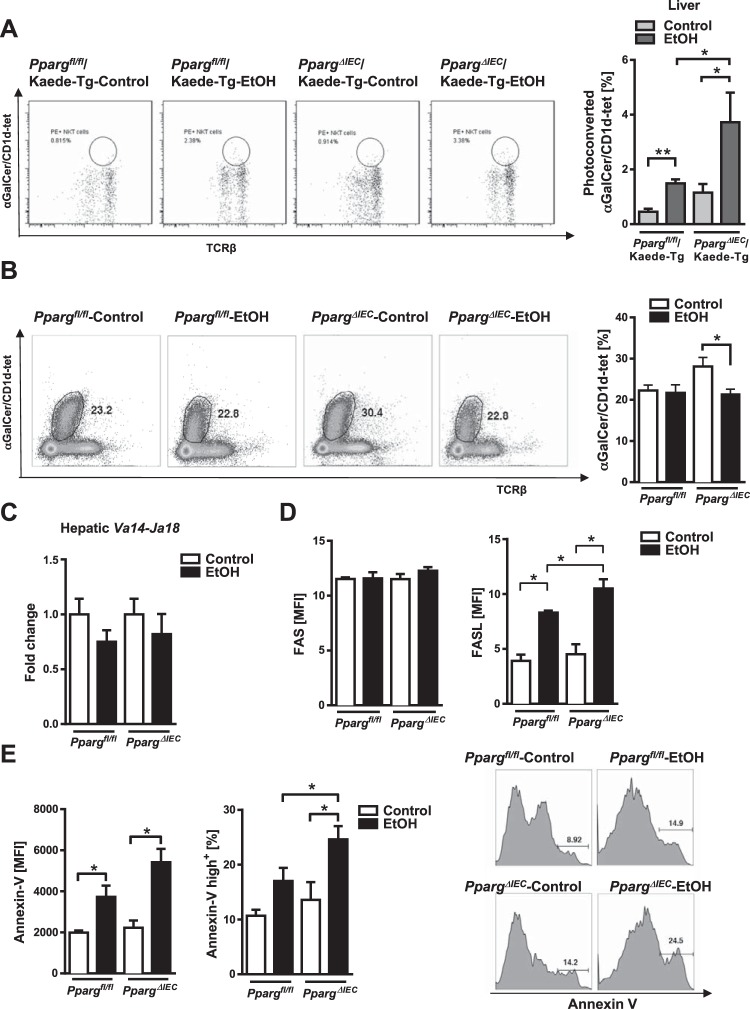
A significantly larger number of photoconverted and activated iNKT cells migrated from mesenteric lymph nodes to livers of PpargΔIEC/Kaede-Tg mice than Ppargfl/fl/Kaede-Tg mice following chronic ethanol administration (Fig. 4A). A similar increase in photoconverted iNKT cells was found in control-fed PpargΔIEC mice compared with control-fed Ppargfl/fl mice. However, the number of total iNKT cells as determined using aGalCer/CD1d-tetramer staining was significantly lower in livers of ethanol-fed PpargΔIEC mice than control-fed PpargΔIEC mice (Fig. 4B).
Fig. 4.
Increased activation, TCR-downmodulation, and apoptosis of hepatic invariant natural killer T (iNKT) cells in PpargΔIEC mice following chronic ethanol feeding. A: PpargΔIEC/Kaede-Tg and Ppargfl/fl/Kaede-Tg mice were fed an oral control diet (n = 5) or ethanol diet (n = 8) for 8 wk. Photoconversion was performed in mesenteric lymph nodes, and livers were harvested after 48 h. Numbers of photoconverted iNKT cells (based on αGalCer/CD1d-tet, measured by flow cytometry) in liver. B–E: Ppargfl/fl and PpargΔIEC mice were fed an oral control diet (n = 5) or ethanol diet (n = 7 or 8) for 8 wk. B: numbers of iNKT cells in liver, measured by flow cytometry. C: hepatic levels of Va14-Ja18 mRNA, detected by nested qPCR. D–E: FASL, Fas, and Annexin V expression in hepatic iNKT cells, measured by flow cytometry. MFI, mean fluorescent intensity. *P < 0.05.
Since iNKT cells downregulate their TCR surface expression after chronic activation, identification of iNKT cells using αGalCer/CD1d-tetramers may not accurately reveal their actual frequency since tetramer staining is dependent on TCR surface expression. Therefore, we used RT-PCR to determine the level of expression of Vα14–Jα18 mRNA, which is expressed only in iNKT cells and is independent of TCR protein downmodulation. We found that Vα14-Jα18 mRNA expression decreased but not to the same extent as tetramer staining in livers of PpargΔIEC mice compared with Ppargfl/fl mice (Fig. 4C). These data indicate that a decrease in tetramer+ cells show chronic activation of iNKT cells followed by TCR downmodulation, as well as apoptosis (see the below paragraph) in alcohol-fed mice.
Long-term activation of iNKT cells can also lead to expression of Fas ligand (FASL) and their apoptosis. Levels of FASL and Annexin V (Annexin A5 or ANXA5) were higher in hepatic iNKT cells of ethanol-fed Ppargfl/fl mice compared with livers of control-fed mice, and to a significantly greater extent in PpargΔIEC mice, but levels of FAS did not differ in iNKT cells from these mice (Fig. 4, D and E). So, chronic ethanol feeding appears to activate iNKT cells in the intestine, which migrate to the liver, where they are chronically activated, express FASL, and undergo apoptosis.
PpargΔIEC mice have increased hepatocyte apoptosis and liver injury in mice after chronic ethanol administration.
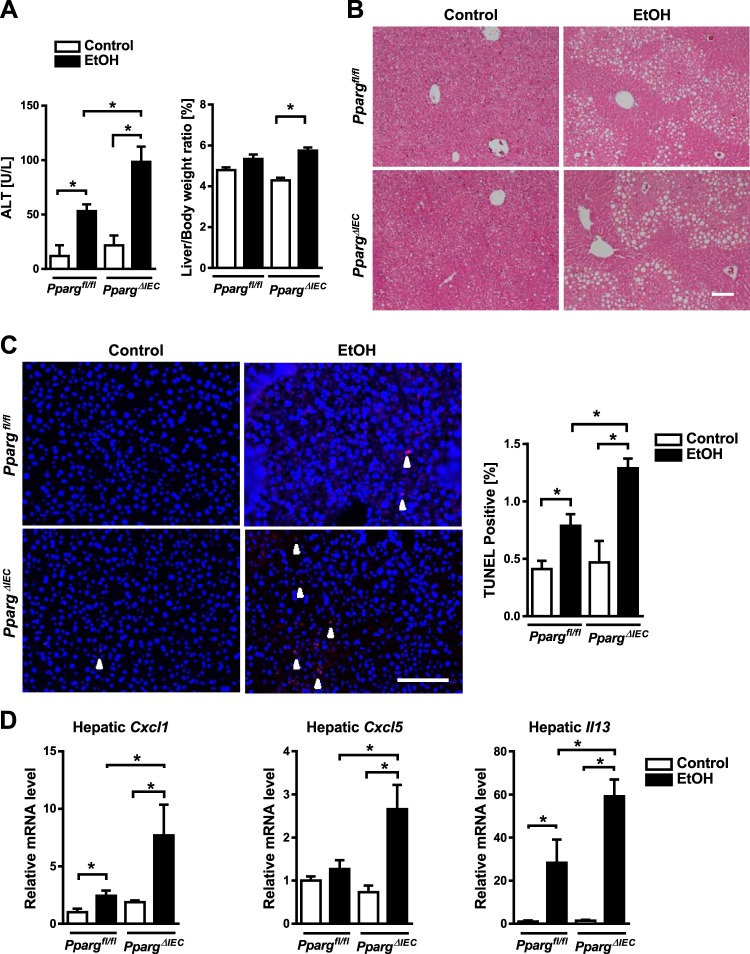
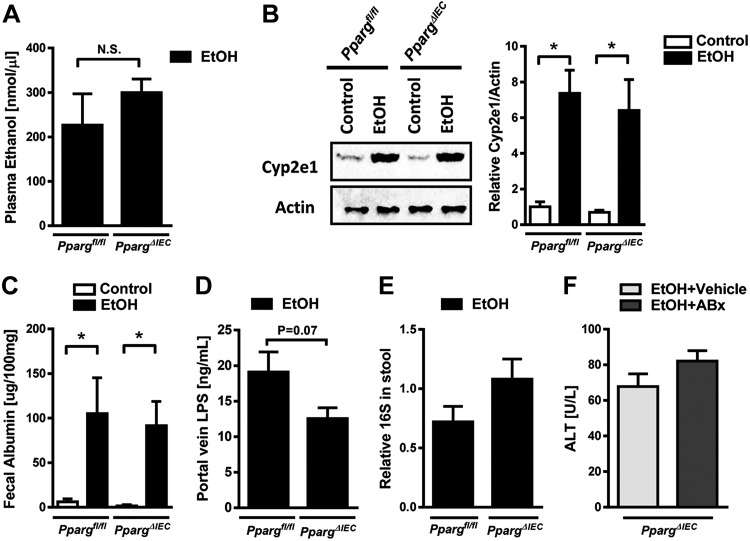
We investigated whether the increased activation and migration of intestinal iNKT cells in response to ethanol feeding associates with increased liver injury. Ethanol-fed Ppargfl/fl mice had a significant increased liver injury, as evidenced by higher plasma level of ALT, compared with control-fed mice, and ethanol-fed PpargΔIEC mice had an even greater increase (Fig. 5A). Hepatic steatosis increased in ethanol-fed mice compared with mice on control diets but did not differ between PpargΔIEC and Ppargfl/fl mice (Fig. 5B). Using the terminal deoxynucleotide transferase mediated dUTP nick-end labeling (TUNEL) assay, we observed an increased number of apoptotic and dead cells in the liver of PpargΔIEC mice compared with Ppargfl/fl mice (Fig. 5C). Levels of (C-X-C motif) ligand (Cxcl)5, Cxcl1, and Il13 mRNAs, which encode inflammatory chemokines and cytokines, increased in livers of Ppargfl/fl mice following ethanol feeding, but increased to a significantly greater extent in PpargΔIEC mice than Ppargfl/fl mice (Fig. 5D). PpargΔIEC mice did not differ from Ppargfl/fl mice in plasma levels of ethanol (Fig. 6A) or hepatic levels of ethanol-metabolizing cytochrome P-450 family 2 subfamily E member 1 (Cyp2e1) protein (Fig. 6B).
Fig. 5.
Increased hepatocyte apoptosis, liver injury, and inflammation in PpargΔIEC mice following chronic ethanol feeding. Ppargfl/fl and PpargΔIEC mice were fed an oral control diet (n = 5) or ethanol diet (n = 8 or 9) for 8 wk. A: plasma levels of alanine aminotransferase (ALT) and ratio of liver to body weight. B: representative sections of liver following hematoxylin-eosin staining. C: representative sections of liver with terminal deoxynucleotide transferase mediated dUTP nick-end labeling (TUNEL) staining and quantification. White arrowheads indicate apoptotic cells. D: hepatic expression of C-X-C motif chemokine ligand 1 (Cxcl1) mRNA, Cxcl5 mRNA, and II13 mRNA. Scale bars: 100 μm. *P < 0.05.
Fig. 6.
Ethanol metabolism, intestinal permeability and bacteria in PpargΔIEC mice following chronic ethanol feeding. Ppargfl/fl and PpargΔIEC mice were fed an oral control diet (n = 5) or ethanol diet (n = 8 or 9) for 8 wk. A: plasma levels of ethanol. B: hepatic levels of Cyp2e1 and β-actin. C: paracellular intestinal permeability was determined based on fecal albumin content. D: plasma levels of LPS in portal vein. E: total bacteria in feces as assessed by qPCR for 16S rRNA genes. F: PpargΔIEC mice fed the ethanol diet for 8 wk and were gavaged daily with vehicle (n = 3) or antibiotics (n = 6). Plasma levels of alanine aminotransferase (ALT). *P < 0.05.
Intestinal PPARG regulates the intestinal microbiota and maintains intestinal homeostasis (6). Alcoholic liver disease is accompanied by increased intestinal permeability and changes in the intestinal microbiota (17). Ethanol feeding increased fecal levels of albumin to the same extent in Ppargfl/fl versus PpargΔIEC mice (Fig. 6C) and did not increase LPS levels in portal vein in PpargΔIEC mice (Fig. 6D), indicating that loss of PPARG does not disrupt intestinal barrier dysfunction and does not increase intestinal permeability, or alter the total number of fecal bacteria (Fig. 6E). Eradication of intestinal bacteria with nonabsorbable antibiotics reduces ethanol-induced liver disease (9). Nonabsorbable antibiotics did not alter ethanol-induced liver injury in PpargΔIEC versus Ppargfl/fl mice (Fig. 6F). So, the increased susceptibility of PpargΔIEC mice to ethanol-induced liver injury appears to be independent from the intestinal microbiota.
iNKT cells from ethanol-fed mice induce hepatocyte apoptosis.
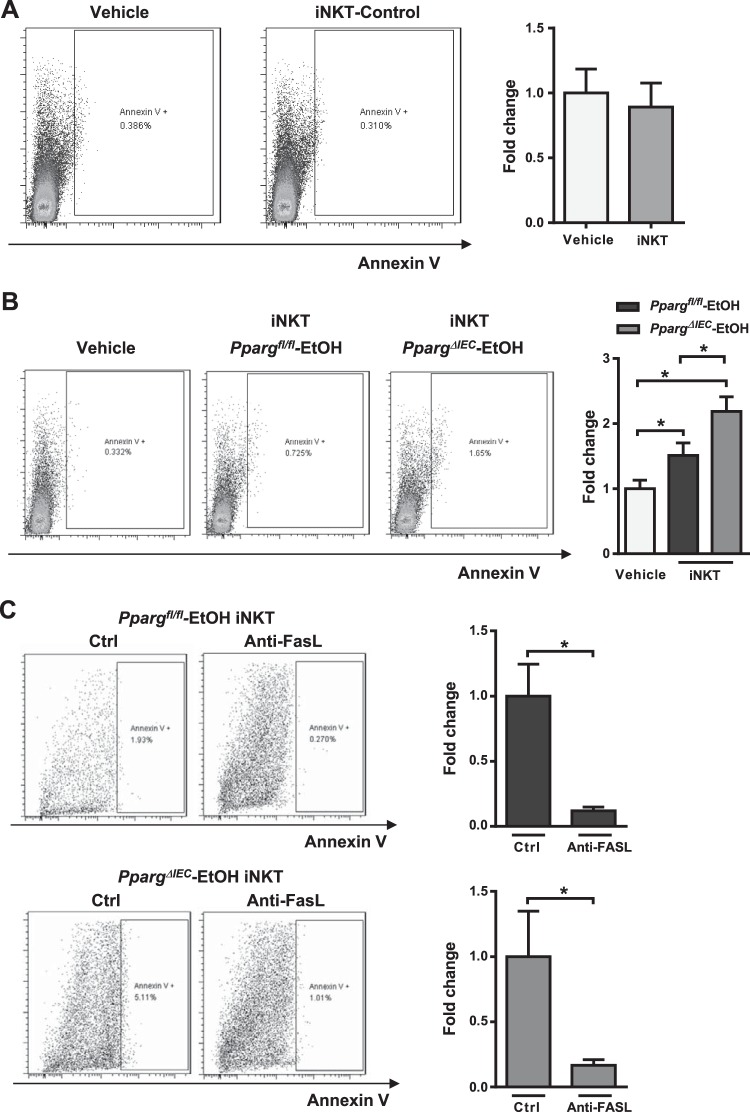
We investigated whether hyperactive iNKT cells somehow induce hepatocyte apoptosis. iNKT cells from livers of control-fed mice did not induce apoptosis of cultured hepatocytes, based on Annexin V levels (Fig. 7A). However, iNKT cells isolated from livers of ethanol-fed Ppargfl/fl mice induced apoptosis of cultured hepatocytes, and iNKT cells isolated from livers of ethanol-fed PpargΔIEC mice induced hepatocyte apoptosis to a significantly greater extent (Fig. 7B). Anti-FASL-neutralizing antibodies attenuated hepatocyte apoptosis induced by iNKT cells from ethanol-fed mice (Fig. 7C).
Fig. 7.
Invariant natural killer T (iNKT) cells from ethanol-fed mice induce hepatocyte apoptosis. A: primary mouse hepatocytes were cocultured with iNKT cells isolated from control mice. Expression of Annexin V by hepatocytes was measured by flow cytometry (n = 6). The hepatocytes were gated from forward and side scatter, as well as negative allophycocyanine (APC). B: primary mouse hepatocytes were cocultured with iNKT cells isolated from ethanol-fed Ppargfl/fl and PpargΔIEC mice. Expression of Annexin V by hepatocytes was measured by flow cytometry (n = 9–12). *P < 0.05. C: primary mouse hepatocytes were cocultured with iNKT cells isolated from ethanol-fed Ppargfl/fl (n = 8) and PpargΔIEC (n = 7) mice with IgG3, κ isotype (Ctrl) or the MFL4 antibody generated against FASL (Anti-FASL). *P < 0.05.
These experiments provide the first direct evidence that iNKT cells can directly kill hepatocytes during liver disease, which is enhanced when iNKT cells are activated in the intestine and migrate to the liver.
Inhibition of iNKT cells reduces ethanol-induced liver injury in PpargΔIEC mice.
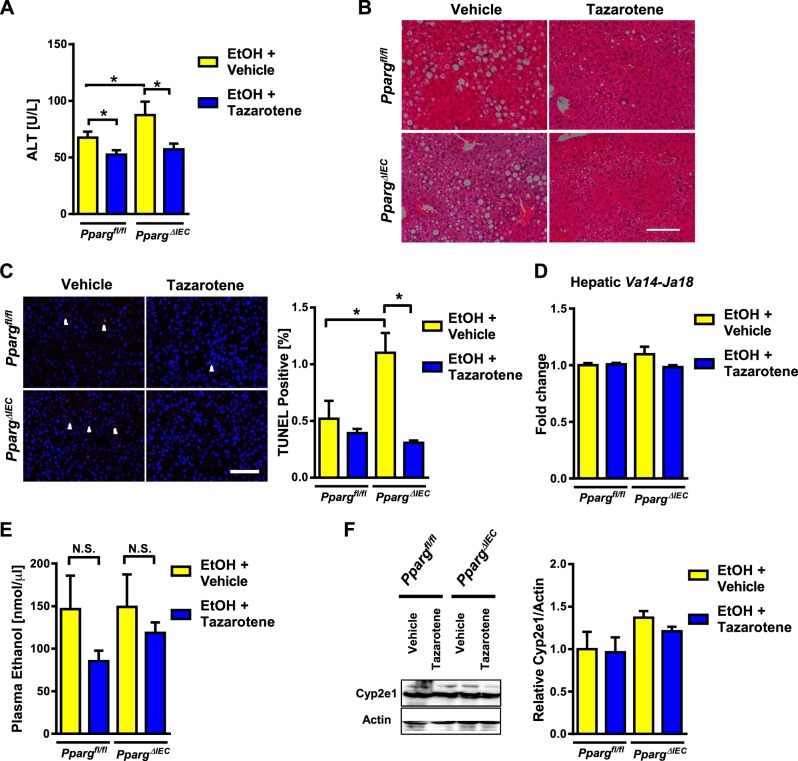
To determine whether the increased susceptibility of PpargΔIEC mice to ethanol-induced liver injury requires activated iNKT cells, we studied the effects of tazarotene, an agonist of the retinoic acid receptor-γ that inhibits iNKT cell activation (20). Tazarotene reduced plasma levels of ALT, hepatic steatosis, and hepatocyte apoptosis following chronic ethanol feeding of Ppargfl/fl mice, consistent with our previous report (20) (Fig. 8, A–C). Tazarotene reduced liver injury and hepatic cell death to a significantly greater extent in ethanol-fed PpargΔIEC than Ppargfl/fl mice (Fig. 8, A–C). There was no significant difference in levels of Va14-Ja18 mRNA in livers of mice (Fig. 8D). Tazarotene did not significantly affect plasma levels of ethanol or hepatic levels of Cyp2e1 (Fig. 8, E and F). These results indicate that inhibition of iNKT cells can improve enhanced ethanol-induced liver injury in PpargΔIEC mice.
Fig. 8.
Tazarotene reduces ethanol-induced liver injury in PpargΔIEC mice. Ppargfl/fl and PpargΔIEC mice were fed an ethanol diet for 8 wk and given intraperitoneal injections of vehicle (DMSO; n = 8 or 9) or tazarotene (0.3 mg/mouse, twice per week; n = 8–12). A: plasma levels of alanine aminotransferase (ALT). B: representative sections of liver following hematoxylin and eosin staining. C: representative sections of liver with TUNEL staining and quantification. White arrowheads indicate apoptotic cells. D: hepatic expression of Va14-Ja18 mRNA, detected by nested qPCR. E: plasma level of ethanol. F: hepatic levels of Cyp2e1 and β-actin. Scale bars: 100 μm. NS, nonsignificant. *P < 0.05.
Alcohol abuse increases intestinal levels of CD1d in humans.
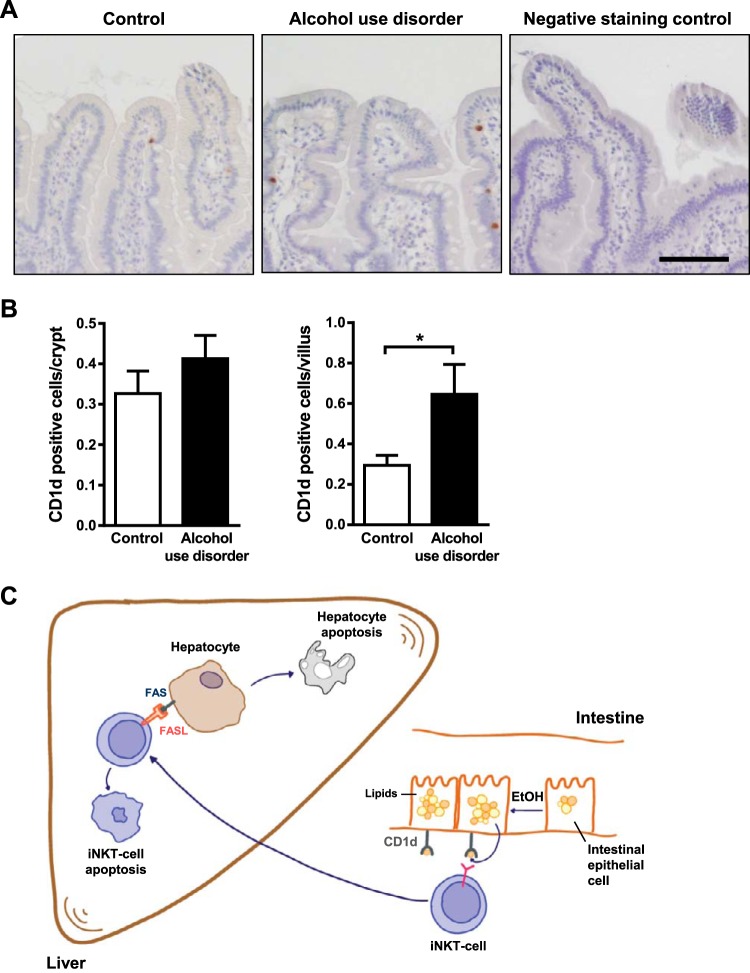
We compared levels of CD1d in duodenal biopsies from patients with alcohol use disorder and nonalcoholic individuals (controls) using immunohistochemistry. CD1d was significantly increased in villi, but not crypts, of duodenal tissues from patients with alcohol use disorder compared with controls (Fig. 9, A and B).
Fig. 9.
Alcohol abuse increases CD1d expression in human duodenum. A: immunohistochemical analysis of CD1d in duodenal biopsies from patients without alcohol dependency (controls; n = 15) and patients with alcohol use disorders (n = 10); representative images are shown. B: CD1d-positive enterocytes were counted in villi and crypts. C: in our model, chronic ethanol consumption alters the lipid profile of intestinal enterocytes and increases their expression of CD1d. This activates intestinal invariant natural killer T (iNKT) cells to migrate to the liver, where they promote hepatocyte apoptosis and exacerbate alcoholic liver disease. Scale bars: 50 μm. *P < 0.05.
DISCUSSION
We studied migration of intestinal immune cells into the liver in response to ethanol-induced liver disease. We found that chronic ethanol feeding induces expression of CD1d by enterocytes, which activate iNKT cells in mesenteric lymph nodes; activation is further increased with loss of PPARG and altered lipid profiles. The activated iNKT cells migrate into the liver, where they promote hepatocyte apoptosis (Fig. 9C). Patients with alcohol use disorder have increased expression of CD1d in the small intestine. Strategies to block these processes might be developed to treat alcoholic liver disease.
We found that ~0.3% of migrated intestinal iNKT cells contribute to the hepatic iNKT cell population. Although this percentage appears to be low, considering that photoconversion and migration studies were done at one time point, while alcoholic liver disease is a chronic disease process, and, thus, likely involves a continuous migration of intestinal iNKT cells into the liver. Thus, activation of migrated intestinal, as well as resident hepatic iNKT cells, contribute to the progression of alcoholic liver disease.
Self- and bacterial lipid antigens can be recognized by iNKT cells (13). Chronic ethanol administration increases gut barrier dysfunction and induces intestinal bacterial overgrowth (8). Increased activation of intestinal iNKT cells did not enhance intestinal permeability or dysbiosis, so increased activation of intestinal NKT cells must exacerbate alcoholic liver disease by a different mechanism. In addition, intestinal eradication of bacteria using nonabsorbable antibiotics decreases ethanol-induced liver disease in mice (9) but does not reduce ethanol-induced liver injury in PpargΔIEC mice. The increased iNKT cells found in mesenteric lymph nodes of ethanol-fed PpargΔIEC mice cannot, therefore, be attributed to translocated bacterial lipid antigens and is independent of intestinal dysbiosis.
Lipid droplets in enterocytes provide a source of lipid antigens that are presented to intestinal iNKT (5, 21). Long-term administration of ethanol alters lipid metabolism and content in enterocytes and increased their expression of CD1d in mice and humans. Expression of CD1d on enterocytes increases further in the absence of PPARG in intestinal epithelial cells. Enterocytes might present their self-lipid antigens to iNKT cells via CD1d—this would induce iNKT cell proliferation in mesenteric lymph nodes. On the other hand, it is possible that lipid droplets secreted from enterocytes reach mesenteric lymph nodes (1) and locally interact with iNKT cells, which could activate them. We cannot conclusively determine which lipid antigens activated the intestinal iNKT cells in our study. Several lipid compounds were altered, but these did not include the antigenic self-lipids presented by CD1d, such as isoglobotrihexosylceramide, β-glucosylceramide, β-galactosylceramide, lysophosphatidylcholine, ether-bonded lysophosphatidylethanolamine, or lysophosphatidic acid (12). We noted that the concentration of PG(P-18:0/20:2(11Z,14Z)) and Cer(d18:2/22:0) in enterocytes correlated with expression of CD1d. It will be interesting to synthesize these pure lipid compounds and test their effects on iNKT cells.
Although an increased number of iNKT cells migrated from the gut to the liver, they became hyperactivated, expressed increased FasL, downregulated their TCRs, and induced hepatocyte apoptosis in livers of ethanol-fed mice; these effects were greater in ethanol-fed PpargΔIEC mice. Migrated iNKT cells can be activated by additional lipid antigens after ethanol injury to the liver, and binding of their FASL to the Fas on hepatocytes can induce cell death of hepatocytes and liver inflammation (14). Our in vitro coculture experiments demonstrated that hepatic iNKT cells, activated by ethanol feeding of mice, induced apoptosis of hepatocytes; this was not found by coculture with hepatic iNKT cells from control-fed mice. Our findings indicate that migrated iNKT cells to liver induce apoptosis of hepatocytes; this results in more liver inflammation in ethanol-fed mice, and to a greater extent in PpargΔIEC mice.
Ethanol-fed Ppargfl/fl mice given tazarotene had less liver inflammation and hepatocyte apoptosis than mice given vehicle (20), indicating that iNKT inhibitors might be used to treat patients with alcoholic liver injury. PpargΔIEC mice given tazarotene had the same level of liver injury and hepatocyte apoptosis as Ppargfl/fl mice after chronic ethanol administration, so the increased liver injury observed in PpargΔIEC mice might be reduced by blocking iNKT cells. Interestingly, we also observed a decrease in hepatic steatosis in ethanol-fed PpargΔIEC mice after tazarotene administration. This is likely not mediated by intestinal iNKT cells, but rather the result of global inhibition of iNKT cells, as iNKT cells have been shown to directly cause hepatic steatosis (27). Future studies are required to test tissue-specific inhibition of iNKT cells and their contribution to ethanol-induced liver disease. This could be achieved by genetic deletion of CD1d specifically in intestinal epithelial cells.
We have found new effects of intestinal PPARG deletion, in regulation of mucosal lipid homeostasis. Our findings indicate the importance of iNKT cells in interactions between intestinal and liver cells, and in development of alcoholic liver injury.
GRANTS
K. C. Lee was supported by V107C-126, Taipei Veterans General Hospital and Taipei Veterans General Hospital-National Yang-Ming University Excellent Physician Scientists Cultivation Program Scholarship. P. Chen received funding from Natural Science Funds for Distinguished Young Scholar of Guangdong province (2016A030306043) and the award of Young Pearl Scholars of Guangdong province. This study was also supported, in part, by National Institutes of Health Grants R01 AA020703, U01 AA021856, U01 AA24726 (to B. Schnabl), AA020864, CA100660 (to V. Kumar), by Award Number I01BX002213 from the Biomedical Laboratory Research & Development Service of the Veterans Affairs Office of Research and Development (to B. Schnabl).
DISCLOSURES
V.K. is a scientific cofounder and consultant for the GRI-Bio. B.S. is consulting for Ferring Research Institute.
AUTHOR CONTRIBUTIONS
K.-C.L., P.C., V.K., and B.S. conceived and designed research; K.-C.L., P.C., I.M., T.I., J.H., S.G., J.C.S., S.D., Y.-T.L., and P.S. performed experiments; K.-C.L., P.C., I.M., H.-C.L., Y.-T.L., R.L., V.K., and B.S. analyzed data; K.-C.L., P.C., I.M., H.-C.L., R.L., V.K., and B.S. interpreted results of experiments; K.-C.L., P.C., I.M., and B.S. prepared figures; K.-C.L., P.C., I.M., and B.S. drafted manuscript; K.-C.L., P.C., V.K., and B.S. edited and revised manuscript; B.S. approved final version of manuscript.
REFERENCES
- 1.Abumrad NA, Davidson NO. Role of the gut in lipid homeostasis. Physiol Rev 92: 1061–1085, 2012. doi: 10.1152/physrev.00019.2011. [DOI] [PMC free article] [PubMed] [Google Scholar]
- 2.Ahmadian M, Suh JM, Hah N, Liddle C, Atkins AR, Downes M, Evans RM. PPARγ signaling and metabolism: the good, the bad and the future. Nat Med 19: 557–566, 2013. doi: 10.1038/nm.3159. [DOI] [PMC free article] [PubMed] [Google Scholar]
- 3.An D, Oh SF, Olszak T, Neves JF, Avci FY, Erturk-Hasdemir D, Lu X, Zeissig S, Blumberg RS, Kasper DL. Sphingolipids from a symbiotic microbe regulate homeostasis of host intestinal natural killer T cells. Cell 156: 123–133, 2014. doi: 10.1016/j.cell.2013.11.042. [DOI] [PMC free article] [PubMed] [Google Scholar]
- 4.Bataller R, Gao B. Liver fibrosis in alcoholic liver disease. Semin Liver Dis 35: 146–156, 2015. doi: 10.1055/s-0035-1550054. [DOI] [PubMed] [Google Scholar]
- 5.Beilstein F, Carrière V, Leturque A, Demignot S. Characteristics and functions of lipid droplets and associated proteins in enterocytes. Exp Cell Res 340: 172–179, 2016. doi: 10.1016/j.yexcr.2015.09.018. [DOI] [PubMed] [Google Scholar]
- 6.Byndloss MX, Olsan EE, Rivera-Chávez F, Tiffany CR, Cevallos SA, Lokken KL, Torres TP, Byndloss AJ, Faber F, Gao Y, Litvak Y, Lopez CA, Xu G, Napoli E, Giulivi C, Tsolis RM, Revzin A, Lebrilla CB, Bäumler AJ. Microbiota-activated PPAR-γ signaling inhibits dysbiotic Enterobacteriaceae expansion. Science 357: 570–575, 2017. doi: 10.1126/science.aam9949. [DOI] [PMC free article] [PubMed] [Google Scholar]
- 7.Chen P, Miyamoto Y, Mazagova M, Lee KC, Eckmann L, Schnabl B. Microbiota protects mice against acute alcohol-induced liver injury. Alcohol Clin Exp Res 39: 2313–2323, 2015. doi: 10.1111/acer.12900. [DOI] [PMC free article] [PubMed] [Google Scholar]
- 8.Chen P, Schnabl B. Host-microbiome interactions in alcoholic liver disease. Gut Liver 8: 237–241, 2014. doi: 10.5009/gnl.2014.8.3.237. [DOI] [PMC free article] [PubMed] [Google Scholar]
- 9.Chen P, Stärkel P, Turner JR, Ho SB, Schnabl B. Dysbiosis-induced intestinal inflammation activates tumor necrosis factor receptor I and mediates alcoholic liver disease in mice. Hepatology 61: 883–894, 2015. doi: 10.1002/hep.27489. [DOI] [PMC free article] [PubMed] [Google Scholar]
- 10.Cui K, Yan G, Xu C, Chen Y, Wang J, Zhou R, Bai L, Lian Z, Wei H, Sun R, Tian Z. Invariant NKT cells promote alcohol-induced steatohepatitis through interleukin-1β in mice. J Hepatol 62: 1311–1318, 2015. doi: 10.1016/j.jhep.2014.12.027. [DOI] [PubMed] [Google Scholar]
- 11.Delovitch TL. Imaging of NKT cell recirculation and tissue migration during antimicrobial immunity. Front Immunol 6: 356, 2015. doi: 10.3389/fimmu.2015.00356. [DOI] [PMC free article] [PubMed] [Google Scholar]
- 12.Dowds CM, Kornell SC, Blumberg RS, Zeissig S. Lipid antigens in immunity. Biol Chem 395: 61–81, 2014. doi: 10.1515/hsz-2013-0220. [DOI] [PMC free article] [PubMed] [Google Scholar]
- 13.Girardi E, Zajonc DM. Molecular basis of lipid antigen presentation by CD1d and recognition by natural killer T cells. Immunol Rev 250: 167–179, 2012. doi: 10.1111/j.1600-065X.2012.01166.x. [DOI] [PMC free article] [PubMed] [Google Scholar]
- 14.Kumar V. NKT-cell subsets: promoters and protectors in inflammatory liver disease. J Hepatol 59: 618–620, 2013. doi: 10.1016/j.jhep.2013.02.032. [DOI] [PMC free article] [PubMed] [Google Scholar]
- 15.Kwon HJ, Won YS, Park O, Chang B, Duryee MJ, Thiele GE, Matsumoto A, Singh S, Abdelmegeed MA, Song BJ, Kawamoto T, Vasiliou V, Thiele GM, Gao B. Aldehyde dehydrogenase 2 deficiency ameliorates alcoholic fatty liver but worsens liver inflammation and fibrosis in mice. Hepatology 60: 146–157, 2014. doi: 10.1002/hep.27036. [DOI] [PMC free article] [PubMed] [Google Scholar]
- 16.Llorente C, Jepsen P, Inamine T, Wang L, Bluemel S, Wang HJ, Loomba R, Bajaj JS, Schubert ML, Sikaroodi M, Gillevet PM, Xu J, Kisseleva T, Ho SB, DePew J, Du X, Sørensen HT, Vilstrup H, Nelson KE, Brenner DA, Fouts DE, Schnabl B. Gastric acid suppression promotes alcoholic liver disease by inducing overgrowth of intestinal Enterococcus. Nat Commun 8: 837, 2017. [Erratum in Nat Commun 8: 2137, 2017] doi: 10.1038/s41467-017-00796-x. [DOI] [PMC free article] [PubMed] [Google Scholar]
- 17.Llorente C, Schnabl B. The gut microbiota and liver disease. Cell Mol Gastroenterol Hepatol 1: 275–284, 2015. doi: 10.1016/j.jcmgh.2015.04.003. [DOI] [PMC free article] [PubMed] [Google Scholar]
- 18.Luo W, Xu Q, Wang Q, Wu H, Hua J. Effect of modulation of PPAR-γ activity on Kupffer cells M1/M2 polarization in the development of non-alcoholic fatty liver disease. Sci Rep 7: 44612, 2017. doi: 10.1038/srep44612. [DOI] [PMC free article] [PubMed] [Google Scholar]
- 19.Maeda H, Fujimoto C, Haruki Y, Maeda T, Kokeguchi S, Petelin M, Arai H, Tanimoto I, Nishimura F, Takashiba S. Quantitative real-time PCR using TaqMan and SYBR Green for Actinobacillus actinomycetemcomitans, Porphyromonas gingivalis, Prevotella intermedia, tetQ gene and total bacteria. FEMS Immunol Med Microbiol 39: 81–86, 2003. doi: 10.1016/S0928-8244(03)00224-4. [DOI] [PubMed] [Google Scholar]
- 20.Maricic I, Sheng H, Marrero I, Seki E, Kisseleva T, Chaturvedi S, Molle N, Mathews SA, Gao B, Kumar V. Inhibition of type I natural killer T cells by retinoids or following sulfatide-mediated activation of type II natural killer T cells attenuates alcoholic liver disease in mice. Hepatology 61: 1357–1369, 2015. doi: 10.1002/hep.27632. [DOI] [PMC free article] [PubMed] [Google Scholar]
- 21.Middendorp S, Nieuwenhuis EE. NKT cells in mucosal immunity. Mucosal Immunol 2: 393–402, 2009. doi: 10.1038/mi.2009.99. [DOI] [PubMed] [Google Scholar]
- 22.Morton AM, Sefik E, Upadhyay R, Weissleder R, Benoist C, Mathis D. Endoscopic photoconversion reveals unexpectedly broad leukocyte trafficking to and from the gut. Proc Natl Acad Sci USA 111: 6696–6701, 2014. doi: 10.1073/pnas.1405634111. [DOI] [PMC free article] [PubMed] [Google Scholar]
- 23.Rehm J, Samokhvalov AV, Shield KD. Global burden of alcoholic liver diseases. J Hepatol 59: 160–168, 2013. doi: 10.1016/j.jhep.2013.03.007. [DOI] [PubMed] [Google Scholar]
- 24.Sarafian MH, Gaudin M, Lewis MR, Martin FP, Holmes E, Nicholson JK, Dumas ME. Objective set of criteria for optimization of sample preparation procedures for ultra-high throughput untargeted blood plasma lipid profiling by ultra performance liquid chromatography-mass spectrometry. Anal Chem 86: 5766–5774, 2014. doi: 10.1021/ac500317c. [DOI] [PubMed] [Google Scholar]
- 25.Szabo G, Bala S. Alcoholic liver disease and the gut-liver axis. World J Gastroenterol 16: 1321–1329, 2010. doi: 10.3748/wjg.v16.i11.1321. [DOI] [PMC free article] [PubMed] [Google Scholar]
- 26.Tomura M, Yoshida N, Tanaka J, Karasawa S, Miwa Y, Miyawaki A, Kanagawa O. Monitoring cellular movement in vivo with photoconvertible fluorescence protein “Kaede” transgenic mice. Proc Natl Acad Sci USA 105: 10871–10876, 2008. doi: 10.1073/pnas.0802278105. [DOI] [PMC free article] [PubMed] [Google Scholar]
- 27.Wolf MJ, Adili A, Piotrowitz K, Abdullah Z, Boege Y, Stemmer K, Ringelhan M, Simonavicius N, Egger M, Wohlleber D, Lorentzen A, Einer C, Schulz S, Clavel T, Protzer U, Thiele C, Zischka H, Moch H, Tschöp M, Tumanov AV, Haller D, Unger K, Karin M, Kopf M, Knolle P, Weber A, Heikenwalder M. Metabolic activation of intrahepatic CD8+ T cells and NKT cells causes nonalcoholic steatohepatitis and liver cancer via cross-talk with hepatocytes. Cancer Cell 26: 549–564, 2014. doi: 10.1016/j.ccell.2014.09.003. [DOI] [PubMed] [Google Scholar]
- 28.Yang A-M, Inamine T, Hochrath K, Chen P, Wang L, Llorente C, Bluemel S, Hartmann P, Xu J, Koyama Y, Kisseleva T, Torralba MG, Moncera K, Beeri K, Chen C-S, Freese K, Hellerbrand C, Lee SML, Hoffman HM, Mehal WZ, Garcia-Tsao G, Mutlu EA, Keshavarzian A, Brown GD, Ho SB, Bataller R, Stärkel P, Fouts DE, Schnabl B. Intestinal fungi contribute to development of alcoholic liver disease. J Clin Invest 127: 2829–2841, 2017. doi: 10.1172/JCI90562. [DOI] [PMC free article] [PubMed] [Google Scholar]


