Abstract
Flow cytometry studies on injured kidney tubules are complicated by the low yield of nucleated single cells. Furthermore, cell-specific responses such as cell cycle dynamics in vivo have conventionally relied on indirect immunohistochemistry and proximal tubule markers that may be downregulated in injury. Here, we report a new tissue dissociation protocol for the kidney with an early fixation step that greatly enhances the yield of single cells. Genetic labeling of the proximal tubule with either mT/mG “tomato” or R26Fucci2aR (Fucci) cell cycle reporter mice allows us to follow proximal tubule-specific changes in cell cycle after renal injury. Image-based flow cytometry (FlowSight) enables gating of the cell cycle and concurrent visualization of the cells with bright field and fluorescence. We used the Fucci mouse in conjunction with FlowSight to identify a discrete polyploid population in proximal tubules after aristolochic acid injury. The tissue dissociation protocol in conjunction with genetic labeling and image-based flow cytometry is a tool that can improve our understanding of any discrete cell population after injury.
Keywords: epithelial injury, image-based flow cytometry
INTRODUCTION
The response to renal injury involves many different cell types (tubular epithelia, endothelial cells, pericytes, fibroblasts, and inflammatory cells), and understanding these cell-specific responses is important but challenging. Injuries often target epithelial cells, particularly the proximal tubule (PT), and the cell cycle responses of these injured tubules can impact whether repair or fibrosis occurs. Most tubule epithelial cells are not actively cycling in the healthy adult kidney. After injury, surviving tubular epithelial cells reenter the cell cycle, although some may become arrested at either G1 or G2 checkpoints. Inhibition of cell cycle progression at G1 was protective in two models of acute kidney injury (2, 16), but G2 arrest in tubule epithelia led to a profibrotic phenotype and progression to chronic kidney disease (23). There are many challenges to defining cell-specific changes to the cell cycle in vivo after injury. First, many approaches rely on immunohistochemistry techniques that are dependent on multiple different antibodies with varying affinities, and quantification of fluorescence may be complicated by kidney sectioning, exposure time, and quenching. Second, defining the cell cycle in a specific cell population (e.g., PT) requires staining of a lectin, located on the brush border, or specific protein that may be downregulated in the dedifferentiated tubule with loss of brush border after injury (1, 11, 22). Flow cytometry is often used to model cell cycle dynamics of cultured cells, but many commonly used dissociation techniques reduce the yield of intact cells in kidney tissue.
Here, we present a new protocol for preparing kidney tissue that involves fixation before dissociation to greatly improve the cellular yield (single cells as a percentage of total events). This new preparation together with genetic tools such as the cell cycle reporter R26Fucci2aR (Fucci) mouse (13) and image-based flow cytometry (FlowSight) facilitates improved direct modeling of the cell cycle of targeted cells after renal injury. We used these techniques to define PT cell cycle changes over time after injury by aristolochic acid. Furthermore, FlowSight confirmed definitive identification of a subset of polyploid PT cells (G0/G1 with twice the amount of normal DNA) after kidney injury. This early fixation protocol for kidney tissue and the use of image-based flow cytometry are important tools, not only for cell cycle analysis but also to broaden the use of flow cytometry in defining cell-specific responses after kidney injury.
METHODS
Animal experiments.
All procedures were approved by the Institutional Animal Care and Use Committee of Vanderbilt University and conducted according to the National Institutes of Health Guide for the Care and Use of Laboratory Animals. PT-specific labeling was achieved by crossing γ-glutamyltransferase 1 (γGT)-Cre mice (8) with either mT/mG reporter mice (14) (on N10 FVB background) or R26Fucci2aR (Fucci) mice from Ian Jackson (mixed background) (13). Male mice (8–12 wk old) were used for experiments because female mice have a significantly attenuated response to aristolochic acid (17). For FVB mice, we administered 4.5 mg/kg aristolochic acid I (A9451, Sigma) by intraperitoneal injection on Monday, Wednesday, and Friday for 2 wk and 6 mg/kg Monday through Friday for 1 wk for the mixed background mice. Mice were euthanized at 1 or 4 wk after the last injection.
Flow cytometry, cell sorting, and FlowSight.
Kidneys were harvested, grossly minced in a Petri dish on ice with 4% paraformaldehyde (early fixation protocol) containing 1:100 protease inhibitors (Calbiochem), and fixed for 30 min at room temperature with gentle agitation. Tissue was washed with PBS and resuspended in a detergent solution (0.1% Triton X-100 and 0.01% SDS in PBS) to permeabilize for 30 min at room temperature. After being washed with PBS, the sample was resuspended in dissociation solution [1 mM CaCl2 and 0.5 mM MgCl2 in PBS containing collagenase type I (Fisher) and dispase II (Life Technologies) at 1 mg/ml each] and incubated at 37°C for 1 h. Samples were placed on ice and passed through a 16.5-gauge needle ×10, a 20.5-gauge needle ×10, and finally through a 50-μm filter. Cells were centrifuged (5,000 g for 5 min at 4°C) and resuspended in 1.5 ml of 0.5% FBS/PBS. Samples for the late fixation protocol were prepared similarly with the following exceptions: kidneys were minced in the dissociation solution (no paraformaldehyde) and, after the enzymatic and mechanical dissociation, were fixed with paraformaldehyde for 15 min at room temperature followed by a washing step and permeabilization with above-mentioned detergent solution for 15 min at room temperature (see Fig. 1).
Fig. 1.
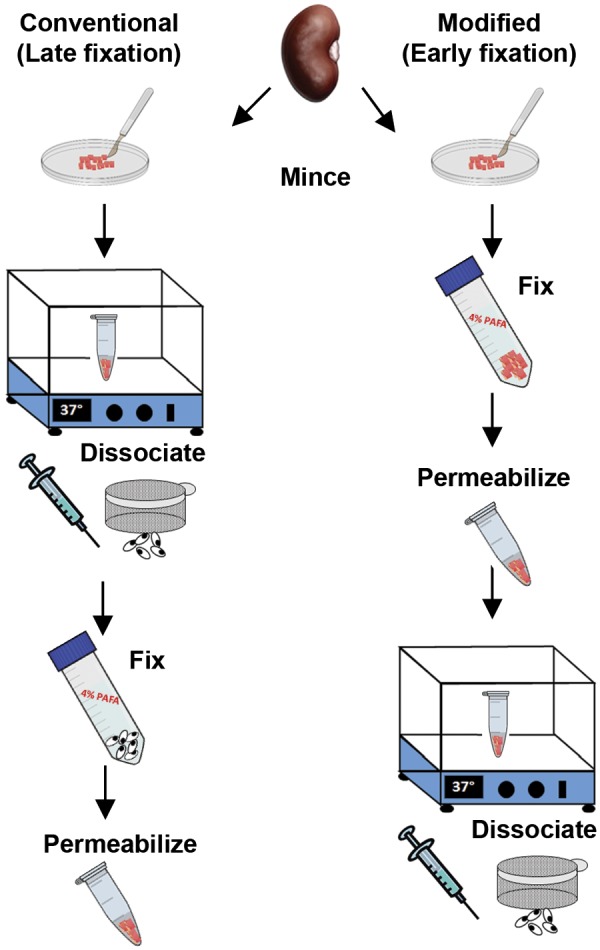
The conventional (late fixation) and modified (early fixation) protocols for kidney tissue dissociation into a single cell suspension for flow cytometry. In the conventional method, the kidney capsule is removed and tissue minced in dissociation solution (see methods) and then incubated at 37°C for 45 min. After centrifugation and shearing by a needle, the sample is filtered through a 50-μm sieve and fixed in 4% paraformaldehyde before permeabilizing in detergent buffer and washing. For the modified dissociation protocol, the tissue is minced in 4% paraformaldehyde with protease inhibitors and fixed for 30 min at room temperature, washed, incubated with the detergent solution, and then resuspended in the dissociation solution for 45 min. The tissue is passed through a 16.5-gauge needle followed by a 20-gauge needle as done in the conventional protocol and filtered through a 50-μm sieve. Please see methods for more details and listing of solutions.
To prepare for FACS, the cell number was adjusted to 106 cells/ml by counting with a hemocytometer. Samples were incubated with Fc blocking antibody (FCγ RIIb/CD16-2, Santa Cruz Biotechnology) for 10 min at room temperature followed by anti-green fluorescent protein (GFP) antibody (Novus Biologicals) at 2.5 μl/1 × 106 cells for 30 min at room temperature and anti-rabbit Alexa Fluor 488 (Cell Signaling) for 30 min at room temperature and resuspended in 1:1,000 DAPI (Cell Signaling). Flow cytometry data were acquired with a BD LSR Fortessa Analyzer at the Vanderbilt University Medical Center Flow Cytometry Shared Resource. Data were initially analyzed by FlowJo (Becton Dickinson), but the algorithm did not accurately fit uninjured kidney tissue. Therefore, we performed cell cycle analysis by gating a plot of side scatter (SSC-A) versus DAPI staining.
Cell sorting (for validation of GFP+ cells) was done on unfixed cells using the Flow Cytometry Core Laboratory at Nashville Veterans Affairs Medical Center with the FACS Aria II from BD Biosciences with tissue prepared as previously described (15). Briefly, cells were incubated with collagenase type I (Fisher) and DNase (Bio-Rad) at 37°C for 1 h, resuspended in red blood cell lysis buffer for 10 min at 37°C, resuspended in PBS with 0.5% FBS, filtered (70 μm), centrifuged at 5,000 g, passed through a 50-μm strainer, and immediately sorted for GFP+ cells.
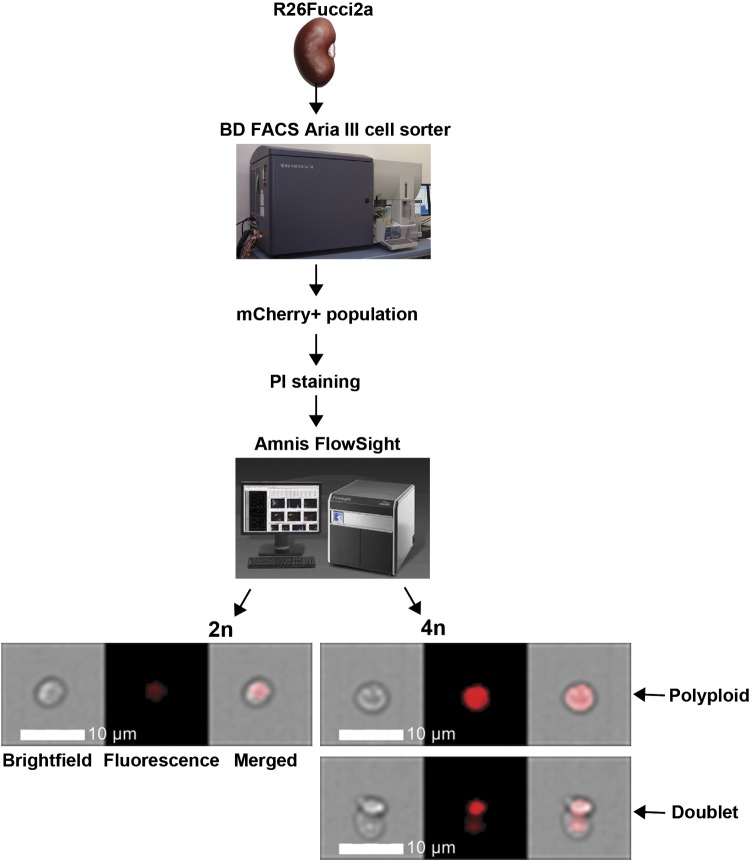
For FlowSight experiments, tissue was prepared using the early fixation protocol, and mCherry+ cells were stained with anti-red fluorescent protein (RFP) antibody (MBL Life Science) followed by rhodamine-conjugated anti-rabbit antibody (Jackson Immunoresearch) and DAPI (as mentioned above). mCherry+ cells were sorted using the BD FACS Aria III in the Vanderbilt University Medical Center Flow Cytometry Shared Resource and then stained with propidium iodide as DAPI is not detected by the FlowSight laser. The FlowSight imaging flow cytometer (EMD Millipore), equipped with a 488-nm laser and a QI upgrade, acquired ×20 images at low speed and the highest resolution of 1 μM/pixel using FlowSight software (EMD Millipore). Cells were gated from debris using a plot of channel 1 (bright-field) area versus the channel 1 aspect ratio, and RMS gradient high (channel 1) images were selected. Cell cycle analysis in channel 5 (used to detect propidium iodide staining) was performed by the Cell Cycle-Mitosis analysis application wizard in IDEAS software, and roughly 1,000 focused images of cells sorted for mCherry+ were collected.
Quantitative PCR.
RNA was extracted from GFP+ and GFP− sorted populations using the Qiagen RNeasy kit, and reverse transcription was performed with iScript cDNA synthesis kit (Bio-Rad). Quantitative PCR was performed using the Bio-Rad CFX96 Thermal Cycler with relative mRNA expressions determined by the ΔΔCT (where CT is threshold cycle) equation with Gapdh used as the reference gene. Primer sequences were as follows: Gapdh, 5′-AGGTCGGTGTGAACGGATTTG-3′ and 5′-TGTAGACCATGTAGTTGAGGTCA-3′; γGT (Ggt1), 5′-CCGCCTACTATGAGCCTGAA-3′ and 5′-GCGAGCTGAAGTCATCCATC-3′; claudin 2, 5′-CTGCCAGGATTCTCGAGCTA-3′ and 5′-AGGATGCCACCAAGGATGAA-3′; claudin 7, 5′-CGGGCGACAACATCATCACA-3′ and 5′-GTGGCGACAAACATGGCTAAGAA-3′; and aquaporin 2, 5′-CTTCCTTCGAGCTGCCTTC-3′ and 5′-CATTGTTGTGGAGAGCATTGAC-3′.
Immunohistochemistry.
Kidneys were fixed in 4% paraformaldehyde and paraffin embedded. After rehydration, antigen retrieval was performed by a pressure cooker (with 100 mM Tris, pH 10), and endogenous peroxidases were quenched with H2O2 for 20 min and blocked with 5% normal goat serum. Slides were incubated with anti-GFP antibody (1:1,000, Novus Biologicals) or anti-RFP antibody (1:300, MBL) and then biotinylated anti-rabbit antibody (Vector). Slides were then treated with an ABC Elite kit (Vector) and developed with diaminobenzidine (Sigma). Images were acquired with a Nikon Eclipse E600 microscope. GFP+ tubular cells were quantified from 10 nonoverlapping ×200 cortical fields. Images were acquired, and cells were counted in a blinded fashion.
Statistical analysis.
We used a paired t-test with unequal variance to compare two sets of data with P < 0.05 considered statistically significant. All experiments subject to analysis were performed at least three times.
RESULTS
Disaggregation protocol with an early fixation step enhances the cellular yield.
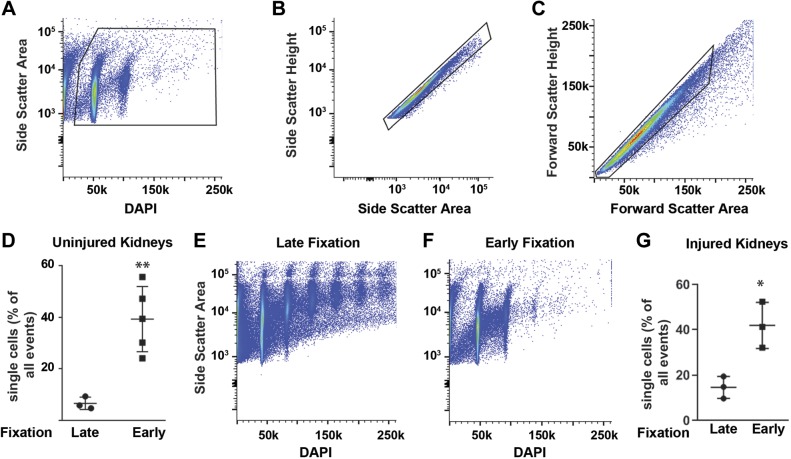
Conventional protocols call for tissue dissociation, typically with collagenases at 37°C, immediately upon harvesting. In contrast, our protocol includes an early fixation step (Fig. 1) that is critical for preserving cellular architecture and protein expression. After gating on single cells and excluding debris (Fig. 2, A–C), tissue prepared with early fixation had significantly more single cell events by flow cytometry (39% of events vs. 6.6%, respectively) and fewer aggregates than did tissues prepared with the conventional technique (Fig. 2, D–F). Aristolochic acid directly injures the PT and induces tubulointerstitial fibrosis and chronic kidney disease in both mice and humans (7, 21). This model induces an acute kidney injury that peaks 7 days after the last injection and then progresses to chronic kidney injury and tubulointerstitial fibrosis by day 20 after injury (3, 9). To assess whether our early fixation protocol augments single cell yield after kidney injury, we injured mice with aristolochic acid injections (see methods) and found that the increased yield with the early fixation protocol persists in injured tissue (Fig. 2G).
Fig. 2.
Gating strategy and the percentage of single cells obtained from an early fixation protocol for tissue dissociation. A: DAPI was used to gate out debris and identify nucleated cells. B and C: cell aggregates were excluded by pulse geometry exclusion with the forward and side scatter parameters shown. D–F: single cell yield (as a percentage of total events) was greatly improved and the number of cell aggregates was decreased (E and F) using an early fixation step as compared with a late fixation step (detailed in Fig. 1). The gating strategy and DAPI data are from one representative mouse, but the single cell yield for uninjured mice in D uses three mice for late fixation and five mice for early fixation. G: the single cell yield of early (n = 3) and late (n = 3) fixation was also performed on mouse tissue 7 days after aristolochic acid injections. Data are shown as means ± SD. **P < 0.01 and *P < 0.05.
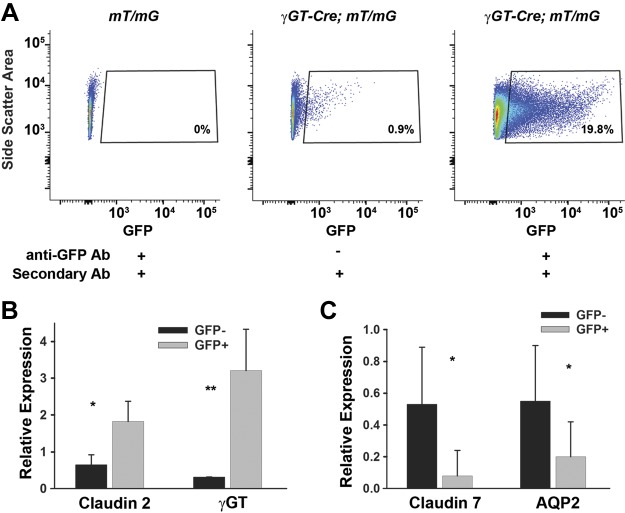
To facilitate improved analysis of the injured PT cell cycle, we crossed γGT-Cre, which targets the PT (8), with mT/mG “tomato” reporter mice (14). The resulting γGT-Cre;mT/mG mouse has membrane-bound GFP expressed on PT cells, and this distribution and recombination have been previously published by our group (6). The γGT promoter is expressed at postnatal day 10, and Cre-mediated recombination leads to permanent expression of GFP, persisting after injury. This is in contrast with other PT-specific proteins, which may be downregulated in the injured, dedifferentiated tubule (1, 11, 22). The detection of endogenous GFP fluorescence can be augmented over 20-fold using anti-GFP antibody (Fig. 3A). To validate this population, we sorted the GFP+ population and confirmed that there was increased transcription of claudin 2 and γGT, PT markers, and decreased claudin 7 and aquaporin 2, distal tubule markers, compared with GFP− cells (Fig. 3, B and C).
Fig. 3.
Antibody enhances green fluorescent protein (GFP) detection and validation of the GFP+ population. A: mice lacking γ-glutamyltransferase 1 (γGT)-Cre were used as negative controls. γGT-Cre;mT/mG mice without the GFP antibody had some positive cells, but this was greatly enhanced with the use of a GFP antibody. B: to validate that GFP+ cells are proximal tubule cells, we sorted out the GFP+ population, isolated mRNA, and performed quantitative PCR for proximal tubule-specific genes (claudin 2 and γGT) and for distal tubule genes [claudin 7 and aquaporin 2 (AQP2)]. Gapdh was used as a loading control. The value of GFP− was normalized to 1 in 1 mouse with other values relative to this mouse. Error bars represent SD for a total of 4 mice. *P < 0.05 and **P < 0.01, statistically significant differences in gene expression. The gating on GFP+ cell population in A is from 1 representative mouse.
Aristolochic acid induces sustained PT cell cycle changes.
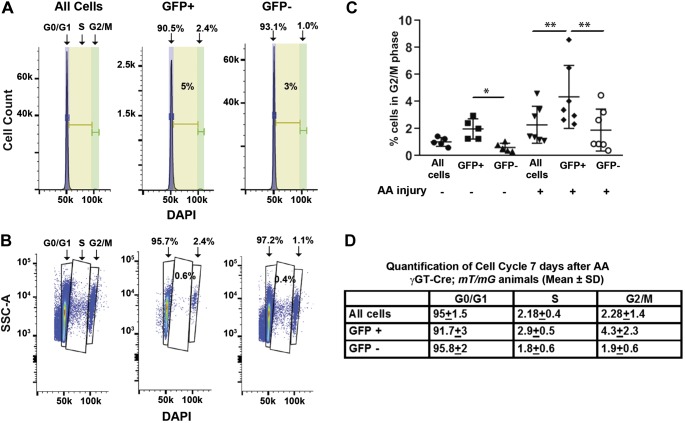
After injury, many different cells infiltrate the renal cortex, so we investigated whether gating specifically on PT cells (GFP+) within our cortical tissue preparation is important versus gating on all cortical cells. To model the cell cycle, we initially used FlowJo’s algorithm but noticed an unexpected large percentage of cells in the S phase that did not visually correlate with the histograms specifically in uninjured mice (Fig. 4A). Alternatively, we gated on SSC-A and DAPI to generate plots in which each dot represents an individual cell and revealed fewer cells in the S phase [0.6% (Fig. 4B) rather than 5% (Fig. 4A)]. In this latter method, there were two distinct DAPI peaks at 50 and 100 k, corresponding to G0/G1 and G2/M. The cells in between these peaks represent the S phase. The number of S phase cells calculated by the dot plot accurately reflected the small number seen between these peaks (Fig. 4B) and the small amount shown in the histogram (Fig. 4A) but not reflected by the FlowJo algorithm. Therefore, cell cycle data were analyzed for all injured and uninjured kidneys by plotting side scatter against DAPI (Fig. 4B).
Fig. 4.
Cell cycle changes are more pronounced in injured green fluorescent protein (GFP)+ cells compared with all cortical cells. A: histograms of an uninjured mouse kidney show cell cycle data analyzed by the FlowJo algorithm with purple representing G0/G1, yellow representing S, and green representing G2/M. B: cell cycle data were also generated on the same mouse by gating side scatter (SSC-A) against DAPI on the same mouse. This second approach was thought to more accurately analyze the cell cycle as the percentage of cells in the S phase (0.6%) more closely fit the number shown by the cells in between the DAPI peaks and represented by the histogram in A than that determined by the FlowJo algorithm (5%). C: percentage of cells in G2/M is shown for all cortical cells, GFP+ cells, and GFP− cells from kidneys that are both uninjured (n = 5) and 7 days after aristolochic acid (AA) injury (n = 7). *P < 0.05 and **P < 0.01. D: each cell cycle stage is shown for AA-injured cortical tissue comparing gating on GFP+ cells (i.e., proximal tubules), GFP− cells, and all cortical cells. Differences in all cell cycle stages (G0/G1, S, and G2/M) in the injured kidneys were statistically significant between GFP+ cells and all cortical cells as well as GFP+ and GFP− cells with P < 0.01.
There were no significant differences in cell cycle when gating on all cells versus the GFP+ population in the uninjured kidney, but there was a small but statistically significant difference in G2/M between GFP+ and GFP− populations (Fig. 4C). One week after aristolochic acid, there were statistically significant differences in all cell cycle phases (Fig. 4, C and D). To determine how aristolochic acid alters PT cell cycle over time, we compared cell cycle dynamics at 7 and 28 days after aristolochic acid, time points consistent with acute and chronic injury respectively, with uninjured controls (Fig. 5, A and B) (3, 9). The biggest differences were evident at 7 days after injury, but significant changes in both cell cycle S and G2/M phases between the uninjured and injured PT cells persisted at 28 days after injury (Fig. 5A).
Fig. 5.
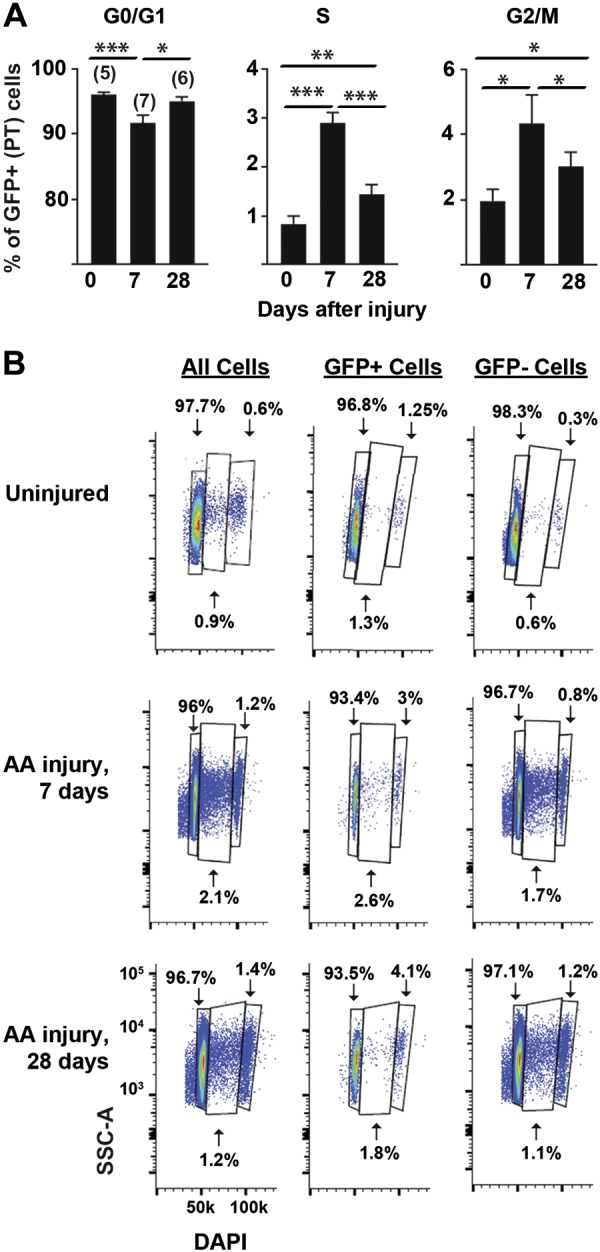
Aristolochic acid (AA) induces persistent proximal tubule (PT) cell cycle changes at 28 days after injury. A: the percentage of total proximal tubule cells that are in each cell cycle stage (G0/G1, S, and G2/M) is shown as a function of time (days after finishing aristolochic acid injury, with 0 indicating untreated control mice). The number of mice used per time point is shown in parentheses. B: representative cell cycle diagrams are shown for kidneys that were uninjured and injured by AA after 7 and 28 days with gating on all cells as well as GFP+ and GFP− cells (1 representative mouse/time point). Cell cycle data were obtained by plotting side scatter (SSC-A) versus DAPI, and the units as shown for the bottom left plot apply to all plots.
Defining polyploidy using the Fucci mouse and FlowSight.
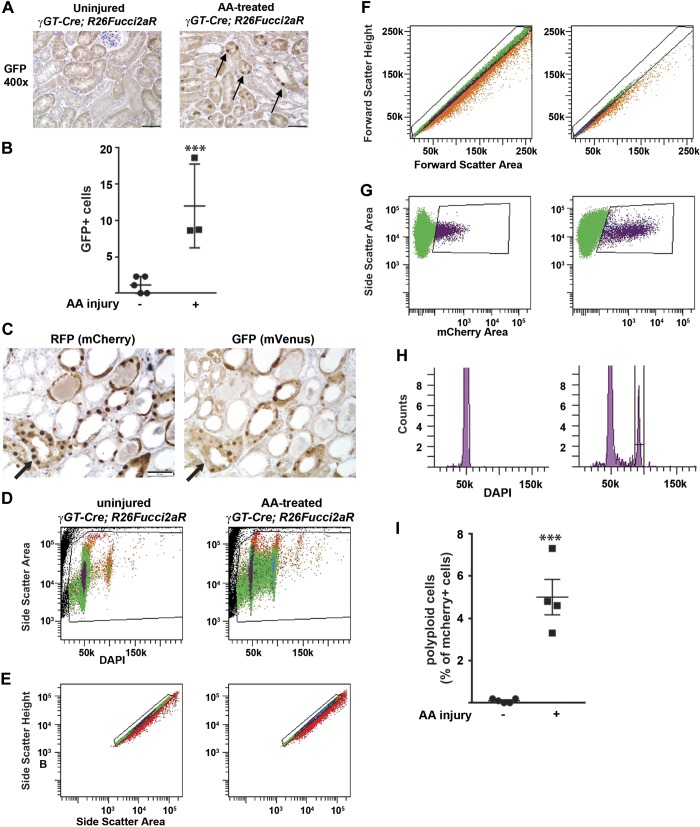
To further characterize PT cell cycle changes after injury, we used the Fucci mouse, which differentiates between cells in G1 and S/G2/M in a cell-specific manner (13). When crossed with the γGT-Cre mouse, the Fucci mouse expresses mCherry specifically in PT cells that are in G0/G1. Once cells progress from the G1 to S phase, mCherry is degraded, whereas mVenus accumulates and persists through G2/M (13). We injured the γGT-Cre;Fucci mice with aristolochic acid; consistent with our flow cytometry data, there were significantly more mVenus+ cells (detected by GFP+ staining, which shares the same epitope as mVenus) compared with uninjured mice (Fig. 6, A and B). We stained serial sections of aristolochic acid-injured kidney tissue and observed that most cells expressed either mCherry or mVenus but not both in the same cell (Fig. 6C).
Fig. 6.
The Fucci mouse confirms increased cycling after injury and allows for analysis of polyploidy. A: uninjured and injured γ-glutamyltransferase 1 (γGT)-Cre;R26Fucci2aR mice were stained with an antibody to green fluorescent protein (GFP; cross reacts with mVenus, which indicates cells are in S/G2/M), and a representative picture is shown with a scale bar = 50 μM. Arrows point to the increased GFP+ nuclear staining in cortical tubules 7 days after aristolochic acid (AA) injury. B: GFP+ cells were counted in a blinded fashion using 10 fields (×200) per mouse (5 uninjured mice and 3 mice injured by AA 7 days prior). ***P < 0.005. C: serial sections of kidney tissue 1 wk after AA injury were stained for either red fluorescent protein (RFP; detects mCherry) or GFP (mVenus) to ensure that expression of these cell cycle reporters was mutually exclusive. Arrows point to the same tubule in serial sections with tubules that have either RFP or GFP staining but not both in the same cell. D–I: cell cycle analysis of mCherry+ (i.e., G1/G0 proximal tubules) cells from γGT-Cre;R26Fucci2aR mice was performed 1 wk after AA injury. D: the granularity channel (SSC) and nuclear stain DAPI were used to gate on nucleated cells. E and F: doublet discrimination was performed by gating on side scatter-height versus side scatter-area plot (E) as well as on forward scatter height versus forward scatter area plot (F). G: mCherry+ cells from the γGT-Cre;R26Fucci2a (γGT-Cre;Fucci) mice represent proximal tubule cells in the G1/G0 phase and can be gated on the side scatter-area versus mCherry area plot. H: representative cell cycle profiles of mCherry+ cells from uninjured and injured γGT-Cre;Fucci mice are shown. I: polyploid cells (mCherry-positive cells with 4n nuclear content) are shown in uninjured and injured mice as a percentage of mCherry+ cells.
Recently, it has been shown that PTs injured by ischemia-reperfusion undergo aberrant cell cycle progression whereby cells replicate their DNA but go from the S to G1 phase without undergoing mitosis (12). This process, known as polyploidy or endocycle, has been described in other epithelial cells such as hepatocytes and enterocytes but is not well described in renal tubules (10). To determine if aristolochic acid induces polyploidy in PT cells, we injured Fucci mice and gated on the mCherry+ (i.e., G0/G1) population (Fig. 6, D–H) to assess for cells with double the DNA content (i.e., 4n), indicating polyploidy. Uninjured Fucci mice had virtually no polyploidy in their PTs, but 5.6% of PT cells in G0/G1 were polyploid at 7 days after injury (Fig. 6I). Although we used stringent gating criteria to exclude aggregate cells (Fig. 6, D–H), we wanted to further confirm the presence of polyploid cells. We sorted out mCherry+ cells and modeled the cell cycle with FlowSight, which, concurrent with cell cycle modeling, takes bright-field and fluorescent images of cells as they pass through the laser (Fig. 7). Some of the cells with 4n DNA were doublets, but others were clearly single cells, thus confirming the existence of a polyploid subpopulation of PT cells 7 days after injury (Fig. 7). For FlowSight, roughly 4.6% were 4n in this sample, with 18.5% of these being obvious aggregates. It is important to note that this 18.5% aggregates does not apply to the results shown in Fig. 6H, in which gating was done with BD FACS Aria III rather than FlowSight.
Fig. 7.
FlowSight confirms polyploid proximal tubule population after injury. A week after aristolochic acid treatment, mCherry+ cells were sorted from a γ-glutamyltransferase 1 (γGT)-Cre;R26Fucci2aR kidney (see methods). Cells were stained with propidium iodine (PI), and roughly 1,000 cells were analyzed and imaged by the Amnis FlowSight flow cytometer. Representative images of 2n and 4n cells are shown in bright-field, fluorescence, and merged images. Scale bars = 10 μM for ×20 magnification; 1 pixel = 1 μM.
DISCUSSION
We show here that direct modeling of the PT cell cycle after renal injury is greatly enhanced using an early fixation tissue dissociation protocol and genetic models combined with image-based flow cytometry. Using these tools, we show that murine PTs have significant changes in all phases of the cell cycle at both 7 and 28 days after aristolochic acid injury with a significant and persistent increase in cells in G2/M at 28 days. Our tissue preparation method significantly enhanced single cell yield for flow cytometry compared with conventional protocols. This protocol was modified slightly from one that has been shown to preserve intestinal epithelial signaling for flow cytometry (18), suggesting that this protocol may be applicable for detecting intracellular signaling pathways in renal tubule epithelia. One obvious limitation of our tissue preparation protocol is that the early fixation, while ideal for defining cell cycle, does not allow sorting for viable cells. Performing RNA sequencing on fixed cells used to be problematic, but protocols are now available describing successful single cell transcriptomic analyses of formalin-fixed cells (20).
Our data show the importance of defining the cell cycle in a cell-specific manner as gating on all cortical cells yielded different results than focusing on PT cells. There are well-characterized proteins that differentiate specific tubular segments, but the expression of these proteins is often reduced in the injured, dedifferentiated tubule. Many of these proteins (e.g., lectins and megalin) are expressed on the brush border, which may be lost in injury, although we did not directly test the utility of using an antibody to a PT-specific protein in injury (1). Using a genetic technique to irreversibly label a certain cell type and its progeny as done here circumvents this problem. A drawback to this approach is the time and money required to cross Cre-containing mice onto reporter mice.
The Fucci mouse is another tool which defines cell cycle in a cell-specific manner, and it also enables detection of polyploidy (i.e., G0/G1 cell cycle with 4n DNA). Although we used a conservative gating strategy to avoid doublets, we wanted to confirm this population using FlowSight to visualize the cells as cell cycle modeling occurs. The Fucci mouse plus FlowSight definitively shows a discrete polyploid population of PTs 7 days after injury. Polyploidy is common in the liver and can occur as either binuclear polyploidy (in normal development and the adult liver) or as mononuclear polyploidy (liver regeneration and disease states such as nonalcoholic steatohepatitis) (4, 5). FlowSight can confirm the presence of polyploid cells but cannot reliably distinguish between single cells that are binuclear versus those that are mononuclear. It is not entirely clear if polyploidy in the kidney is an adaptive response to stress or a pathogenic mechanism that promotes fibrosis. Future studies can address whether the polyploid state affects PT production of profibrotic and inflammatory cytokines, as has been shown with G2/M arrest (23). Another group has described the presence of polyploid cells after renal injury, but their percentage of injured PT polyploid cells was much higher than our study (12). These differences may be explained by the following: different injury models (aristolochic acid vs. ischemia-reperfusion), different time points (7 vs. 30 days), and different targeted populations (γGT-Cre primarily targets S3 in the PT vs. S1-S2 cells had more polyploid cells in their model). To our knowledge, this is the first report confirming polyploid cells in the kidney with image-based flow cytometry. As different laboratories and institutions use different gating strategies, this technique provides an important confirmatory step in the identification of polyploid cells.
In summary, we used an improved tissue dissociation protocol to enhance the yield of single cells from kidney tissue (uninjured and injured) for flow cytometry. We coupled this with genetic tools, both to stably label tubular segments that can be isolated after injury and to fluorescently mark specific cells (e.g., PTs) at different cell stages. These techniques then allowed cell cycle analysis, and the identity of a polyploid population was confirmed by image-based flow cytometry. However, it is important to note that these tools can be applied to other cell types and for uses other than cell cycle measurement. It may be ideal for identifying and isolating very small cell populations after injury (e.g., renin-producing juxtaglomerular cells) if there is a promoter specific for that population. An investigator need only cross the appropriate promoter-driven Cre with a reporter mouse like mT/mG and use this early fixation protocol to enhance the yield of cells. Furthermore, the use of image-based flow cytometry can provide valuable information about cell signaling, protein localization within specific cells, cell size, and actin cytoskeleton. Collectively, these tools not only improve the detection of PT cell cycle changes after renal injury but can also be used to investigate any cell-specific changes in protein expression, single pathways, transcriptomics, or cell shape/size after injury (19, 20).
GRANTS
This work was supported by National Institutes of Health (NIH) Grant R01-DK-108968-01 (to L. S. Gewin), Department of Veterans Affairs, Veterans Health Administration Grant 1I01BX003425-01A1 (to L. S. Gewin), Vanderbilt O’Brien Kidney Center NIH Grants 1-P30-DK-114809-01 (to L. S. Gewin) and R01-DK-103831 and P50-CA-095103 (to K. S. Lau and A. J. Simmons), NIH Training Grant T32-DK-007569 (to M. Manolopoulou), and an American Heart Association Postdoctoral Fellowship award (to S. Nlandu-Khodo). The Vanderbilt University Medical Center Flow Cytometry Shared Resource is supported by the Vanderbilt Ingram Cancer Center NIH Grant P30-CA-68485 and Vanderbilt Digestive Disease Research Center NIH Grant DK-058404.
DISCLOSURES
No conflicts of interest, financial or otherwise, are declared by the authors.
AUTHOR CONTRIBUTIONS
M.M., B.K.M., S.N.K., M.P.-M., A.I., C.E.A., D.K.F., and L.S.G. performed experiments; B.K.M. led flow cytometry and FlowSight studies; M.M., B.K.M., S.N.K., K.S.L., A.I., C.E.A., D.K.F., and L.S.G. analyzed data; M.M., B.K.M., S.N.K., K.S.L., A.I., C.E.A., D.K.F., and L.S.G. interpreted results of experiments; M.M., B.K.M., S.N.K., A.J.S., A.I., D.K.F., and L.S.G. prepared figures; M.M., D.K.F., and L.S.G. drafted manuscript; M.M., B.K.M., S.N.K., A.J.S., K.S.L., M.P.-M., A.I., C.E.A., D.K.F., and L.S.G. edited and revised manuscript; M.M., B.K.M., S.N.K., C.E.A., D.K.F., and L.S.G. approved final version of manuscript; M.M., B.K.M., D.K.F., and L.S.G. conceived and designed research.
REFERENCES
- 1.Chihanga T, Ma Q, Nicholson JD, Ruby HN, Edelmann RE, Devarajan P, Kennedy MA. NMR spectroscopy and electron microscopy identification of metabolic and ultrastructural changes to the kidney following ischemia-reperfusion injury. Am J Physiol Renal Physiol 314: F154–F166, 2018. doi: 10.1152/ajprenal.00363.2017. [DOI] [PMC free article] [PubMed] [Google Scholar]
- 2.DiRocco DP, Bisi J, Roberts P, Strum J, Wong KK, Sharpless N, Humphreys BD. CDK4/6 inhibition induces epithelial cell cycle arrest and ameliorates acute kidney injury. Am J Physiol Renal Physiol 306: F379–F388, 2014. doi: 10.1152/ajprenal.00475.2013. [DOI] [PMC free article] [PubMed] [Google Scholar]
- 3.Fu Y, Tang C, Cai J, Chen G, Zhang D, Dong Z. Rodent models of AKI-CKD transition. Am J Physiol Renal Physiol 315: F1098–F1106, 2018. doi: 10.1152/ajprenal.00199.2018. [DOI] [PMC free article] [PubMed] [Google Scholar]
- 4.Gentric G, Desdouets C. Polyploidization in liver tissue. Am J Pathol 184: 322–331, 2014. doi: 10.1016/j.ajpath.2013.06.035. [DOI] [PubMed] [Google Scholar]
- 5.Gentric G, Maillet V, Paradis V, Couton D, L’Hermitte A, Panasyuk G, Fromenty B, Celton-Morizur S, Desdouets C. Oxidative stress promotes pathologic polyploidization in nonalcoholic fatty liver disease. J Clin Invest 125: 981–992, 2015. doi: 10.1172/JCI73957. [DOI] [PMC free article] [PubMed] [Google Scholar]
- 6.Gewin L, Vadivelu S, Neelisetty S, Srichai MB, Paueksakon P, Pozzi A, Harris RC, Zent R. Deleting the TGF-β receptor attenuates acute proximal tubule injury. J Am Soc Nephrol 23: 2001–2011, 2012. doi: 10.1681/ASN.2012020139. [DOI] [PMC free article] [PubMed] [Google Scholar]
- 7.Huang L, Scarpellini A, Funck M, Verderio EA, Johnson TS. Development of a chronic kidney disease model in C57BL/6 mice with relevance to human pathology. Nephron Extra 3: 12–29, 2013. doi: 10.1159/000346180. [DOI] [PMC free article] [PubMed] [Google Scholar]
- 8.Iwano M, Plieth D, Danoff TM, Xue C, Okada H, Neilson EG. Evidence that fibroblasts derive from epithelium during tissue fibrosis. J Clin Invest 110: 341–350, 2002. doi: 10.1172/JCI0215518. [DOI] [PMC free article] [PubMed] [Google Scholar]
- 9.Jadot I, Colombaro V, Martin B, Habsch I, Botton O, Nortier J, Declèves AE, Caron N. Restored nitric oxide bioavailability reduces the severity of acute-to-chronic transition in a mouse model of aristolochic acid nephropathy. PLoS One 12: e0183604, 2017. doi: 10.1371/journal.pone.0183604. [DOI] [PMC free article] [PubMed] [Google Scholar]
- 10.Kim SH, Jeon Y, Kim HS, Lee JK, Lim HJ, Kang D, Cho H, Park CK, Lee H, Lee CW. Hepatocyte homeostasis for chromosome ploidization and liver function is regulated by Ssu72 protein phosphatase. Hepatology 63: 247–259, 2016. doi: 10.1002/hep.28281. [DOI] [PubMed] [Google Scholar]
- 11.Lan R, Geng H, Polichnowski AJ, Singha PK, Saikumar P, McEwen DG, Griffin KA, Koesters R, Weinberg JM, Bidani AK, Kriz W, Venkatachalam MA. PTEN loss defines a TGF-β-induced tubule phenotype of failed differentiation and JNK signaling during renal fibrosis. Am J Physiol Renal Physiol 302: F1210–F1223, 2012. doi: 10.1152/ajprenal.00660.2011. [DOI] [PMC free article] [PubMed] [Google Scholar]
- 12.Lazzeri E, Angelotti ML, Peired A, Conte C, Marschner JA, Maggi L, Mazzinghi B, Lombardi D, Melica ME, Nardi S, Ronconi E, Sisti A, Antonelli G, Becherucci F, De Chiara L, Guevara RR, Burger A, Schaefer B, Annunziato F, Anders HJ, Lasagni L, Romagnani P. Endocycle-related tubular cell hypertrophy and progenitor proliferation recover renal function after acute kidney injury. Nat Commun 9: 1344, 2018. doi: 10.1038/s41467-018-03753-4. [DOI] [PMC free article] [PubMed] [Google Scholar]
- 13.Mort RL, Ford MJ, Sakaue-Sawano A, Lindstrom NO, Casadio A, Douglas AT, Keighren MA, Hohenstein P, Miyawaki A, Jackson IJ. Fucci2a: a bicistronic cell cycle reporter that allows Cre mediated tissue specific expression in mice. Cell Cycle 13: 2681–2696, 2014. doi: 10.4161/15384101.2015.945381. [DOI] [PMC free article] [PubMed] [Google Scholar]
- 14.Muzumdar MD, Tasic B, Miyamichi K, Li L, Luo L. A global double-fluorescent Cre reporter mouse. Genesis 45: 593–605, 2007. doi: 10.1002/dvg.20335. [DOI] [PubMed] [Google Scholar]
- 15.Neelisetty S, Alford C, Reynolds K, Woodbury L, Nlandu-Khodo S, Yang H, Fogo AB, Hao CM, Harris RC, Zent R, Gewin L. Renal fibrosis is not reduced by blocking transforming growth factor-β signaling in matrix-producing interstitial cells. Kidney Int 88: 503–514, 2015. doi: 10.1038/ki.2015.51. [DOI] [PMC free article] [PubMed] [Google Scholar]
- 16.Pabla N, Gibson AA, Buege M, Ong SS, Li L, Hu S, Du G, Sprowl JA, Vasilyeva A, Janke LJ, Schlatter E, Chen T, Ciarimboli G, Sparreboom A. Mitigation of acute kidney injury by cell-cycle inhibitors that suppress both CDK4/6 and OCT2 functions. Proc Natl Acad Sci USA 112: 5231–5236, 2015. doi: 10.1073/pnas.1424313112. [DOI] [PMC free article] [PubMed] [Google Scholar]
- 17.Shi M, Ma L, Zhou L, Fu P. Renal protective effects of 17β-estradiol on mice with acute aristolochic acid nephropathy. Molecules 21: E1391, 2016. doi: 10.3390/molecules21101391. [DOI] [PMC free article] [PubMed] [Google Scholar]
- 18.Simmons AJ, Banerjee A, McKinley ET, Scurrah CR, Herring CA, Gewin LS, Masuzaki R, Karp SJ, Franklin JL, Gerdes MJ, Irish JM, Coffey RJ, Lau KS. Cytometry-based single-cell analysis of intact epithelial signaling reveals MAPK activation divergent from TNF-α-induced apoptosis in vivo. Mol Syst Biol 11: 835, 2015. doi: 10.15252/msb.20156282. [DOI] [PMC free article] [PubMed] [Google Scholar]
- 19.Simmons AJ, Scurrah CR, McKinley ET, Herring CA, Irish JM, Washington MK, Coffey RJ, Lau KS. Impaired coordination between signaling pathways is revealed in human colorectal cancer using single-cell mass cytometry of archival tissue blocks. Sci Signal 9: rs11, 2016. doi: 10.1126/scisignal.aah4413. [DOI] [PMC free article] [PubMed] [Google Scholar]
- 20.Thomsen ER, Mich JK, Yao Z, Hodge RD, Doyle AM, Jang S, Shehata SI, Nelson AM, Shapovalova NV, Levi BP, Ramanathan S. Fixed single-cell transcriptomic characterization of human radial glial diversity. Nat Methods 13: 87–93, 2016. doi: 10.1038/nmeth.3629. [DOI] [PMC free article] [PubMed] [Google Scholar]
- 21.Vanherweghem JL, Tielemans C, Abramowicz D, Depierreux M, Vanhaelen-Fastre R, Vanhaelen M, Dratwa M, Richard C, Vandervelde D, Verbeelen D, Jadoul M. Rapidly progressive interstitial renal fibrosis in young women: association with slimming regimen including Chinese herbs. Lancet 341: 387–391, 1993. doi: 10.1016/0140-6736(93)92984-2. [DOI] [PubMed] [Google Scholar]
- 22.Venkatachalam MA, Weinberg JM, Kriz W, Bidani AK. Failed tubule recovery, AKI-CKD transition, and kidney disease progression. J Am Soc Nephrol 26: 1765–1776, 2015. doi: 10.1681/ASN.2015010006. [DOI] [PMC free article] [PubMed] [Google Scholar]
- 23.Yang L, Besschetnova TY, Brooks CR, Shah JV, Bonventre JV. Epithelial cell cycle arrest in G2/M mediates kidney fibrosis after injury. Nat Med 16: 535–543, 2010. doi: 10.1038/nm.2144. [DOI] [PMC free article] [PubMed] [Google Scholar]


