

Abstract
Background
The relationship between vitamin D levels and peripheral arterial disease (PAD) remains unclear. We assessed the association of serum 25-hydroxyvitamin D (25(OH)D) levels with the prevalence of PAD in patients with type 2 diabetes mellitus(T2DM).
Methods
A total of 1018 T2DM patients participated in this cross-sectional study. Serum 25(OH)D levels were measured and risk factors of PAD were recorded. PAD was diagnosed as an ankle-brachial index (ABI) < 0.9.
Results
The mean age of the diabetic patients was 58.59 ± 11.34 years. Of all the patients, only 20.1% had a 25(OH)D level ≥ 20 ng/mL. Compared to patients without PAD, serum 25(OH)D levels were significantly lower in those with PAD (14.81 ± 8.43 vs. 11.55 ± 5.65 ng/mL, P < 0.001). The overall prevalence of PAD was 7.7%. From the highest level (≥ 20 ng/mL) to the lowest level (< 10 ng/mL) of serum 25(OH)D, the prevalence of PAD was 2.8, 7.5 and 10.7% respectively. After adjustment for age, sex, body mass index (BMI), smoking status and season, compared to patients with serum 25(OH)D levels ≥20 ng/mL, the odds ratios of PAD in patients with a level of 10 to < 20 ng/mL and < 10 ng/mL was 3.587(95% CI: 1.314–9.790) and 5.540(95% CI: 2.004–15.320), respectively. When further considering the influence of coronary heart disease (CHD), hypertension and cerebral infarction, the ratios changed to 3.824(95% CI: 1.378–10.615) and 5.729(95% CI: 2.028–16.187), respectively. And after further adjustment for the duration of diabetes, glycated hemoglobin (HbA1c) and glomerular filtration rate (GFR), the ratios changed to 3.489(95% CI: 1.100–11.062) and 3.872(95% CI: 1.168–12.841), respectively.
Conclusions
Reduced serum vitamin D levels were associated with an increased risk of PAD in T2DM patients. Randomized interventive clinical studies are required to verify the effects of vitamin D supplementation on PAD.
Keywords: Type 2 diabetes, 25-hydroxyvitamin D, Vitamin D deficiency, Peripheral arterial disease
Background
Peripheral arterial disease (PAD) is one of the most common complications of diabetes, which leads to a high risk of morbidity and mortality from cardiovascular disease [1]. It affects approximately 8.5 million adults aged ≥40 years in the US [2]. A survey of 21,152 eligible participants in 7 different cities in China indicated that the prevalence of PAD in the male and female natural population was 2.52 and 3.66% respectively [3]. As prevalence of diabetes in China is increasing, so are the risks of its comorbidities. Although most PAD patients are asymptomatic, they are still at an increased risk of developing cardiovascular disease [1].
There are some well-established risk factors for PAD, such as diabetes, older age, smoking status, dyslipidemia and hypertension [4]. Vitamin D is usually considered to have a regulatory role in calcium homeostasis and bone metabolism. Recently, more and more evidence has shown the unconventional roles it plays in the body, including insulin resistance, ß cell dysfunction [5], prevalence of type 2 diabetes mellitus (T2DM) and metabolic syndrome [6, 7] and dyslipidemia [8]. However, at present, the relationship between vitamin D status and PAD remains to be unequivocally elucidated. A number of human studies have suggested that there is a strong relationship between vitamin D deficiency and the prevalence and severity of PAD [9, 10]. Other studies have reported that a low level of serum 25(OH)D might lead to arterial calcification, possibly because it can cause osteoblast-like functions in arterial smooth muscle cells, which result in calcium deposition in arterial walls [11, 12]. Meanwhile, it has also been demonstrated that serum 25(OH)D levels are not associated with arterial stiffness or PAD [13, 14]. Furthermore, there is limited literature regarding what, if any, association exists between vitamin D status and PAD in Chinese T2DM patients.
Therefore, we carried out a cross-sectional study to investigate the relationship between serum 25(OH)D levels and the prevalence of PAD with ankle brachial index (ABI), after adjusting for known risk factors in hospital-based T2DM patients. The results of this study may provide new insights for the likely role of vitamin D in atherosclerotic disease.
Methods
Study population
A total of 1457 T2DM patients admitted to the Department of Endocrinology, Beijing Tongren Hospital, Capital Medical University between January 2015 and May 2018 participated in this cross-sectional study. All patients had free exposure to sunlight. Exclusion criteria were: 1) treated with medication that may interfere with bone metabolism, such as bisphosphonates, calcium and vitamin D supplements, calcitonin, estrogen and selective estrogen receptor modulators or corticosteroids; 2) diagnosed with hyperthyroidism, hypothyroidism, hyperparathyroidism, hypoparathyroidism or hypercortisolism; 3) had chronic gastrointestinal diseases, such as gastroduodenal ulcer, inflammatory bowel disease or chronic diarrhea;4) hepatic dysfunction, defined as alanine aminotransferase (ALT) levels ≥2 times the upper reference limit; 5) renal dysfunction, defined as serum creatinine higher than the upper reference limit. Among the 1457 diabetes patients, 72 patients had renal dysfunction, 26 had hepatic dysfunction, 73 had hyper/hypothyroidism, 19 were taking calcium or vitamin D and 249 did not complete the test of ABI, leaving 1018 patients for further analysis. The flowchart of the study was shown in Fig. 1.
Fig. 1.

Flowchart of the study. NPAD: no peripheral arterial disease; PAD: peripheral arterial disease
Baseline characteristics of patients
All the patients completed a detailed questionnaire, including the patient’s age, sex, duration of diabetes, season of hospitalization, smoking status, history of hypertension, hyperlipidemia, coronary heart disease (CHD) and cerebral infarction. Smoking status was classified as never, former or current. Patients with blood pressure ≥ 140/90 mmHg or being treated with anti-hypertensive medication were diagnosed as hypertension. Hyperlipidemia was defined as low density lipoprotein (LDL) ≥ 3.5 mmol/L or having history of using lipid-lowering medication. CHD was defined as having a history of coronary stent implantation or coronary artery bypass grafting, showing myocardial ischemia in the EKG, having typical symptoms of angina or myocardial infarction. Cerebral infarction was defined as having a definite disease history, or showing the signs of cerebral infarction in CT or MRI scans. Body mass index (BMI) of each patient was calculated as the weight (kg) divided by the square of height (m2).
All subjects underwent retinal photography to determine diabetic retinopathy using a TopconTRC-NW7SF fundus camera (Topcon, Tokyo, Japan) ophthalmic digital imaging system. The results of fundus photography were evaluated and graded as follows: non-diabetic retinopathy (NDR); non-proliferative diabetic retinopathy (NPDR) and proliferative diabetic retinopathy (PDR). A renogram was used to estimate the glomerular filtration rate (GFR). Glycated hemoglobin (HbA1c) was measured by high-performance liquid chromatography (VARIANT, Bio-Rad Lab., Hercules, CA, US). Serum creatinine, uric acid, total cholesterol (TC), triglycerides (TG), high density lipoprotein (HDL) cholesterol, LDL cholesterol concentrations, calcium, phosphate, alkaline phosphatase (ALP) were measured by an automated biochemical analyzer (Beckman company, US). Serum 25(OH)D was detected with an electrochemiluminescence method .
ABI measurements
Doppler ultrasound (Huntleigh) was adapted. All patients were asked to have a 10 min rest, and maintain a supine position. Systolic blood pressure was measured in the brachial, posterior tibial and dorsalis pedis arteries, with blood pressure cuffs positioned on both sides of the upper arms and legs. ABI was calculated by dividing the higher systolic ankle (posterior tibial or dorsalis pedis) pressure by the higher brachial artery systolic pressure. Patients with an ABI<0.9 were considered to have PAD.
Statistical analysis
Continuous variables were expressed as mean ± standard deviation ( ±s), and the comparison between 2 groups was made using a t-test. Categorical measures were expressed as percentage and a chi-squared test was used for analysis. Binary logistic regression analysis was used to analyze the influencing factors of PAD in hospitalized T2DM patients according to 3 Models (Model 1 was adjusted for age, sex, BMI, smoking status and season. Model 2 was adjusted for age, sex, BMI, smoking status, season, CHD, hypertension and cerebral infarction. Model 3 was adjusted for age, sex, BMI, smoking status, season, CHD, hypertension, cerebral infarction, HbA1c, duration of diabetes and GFR). Receiver operating characteristic (ROC) curves were plotted to evaluate the accuracy of the 3 Models for diagnosing PAD. The area under the ROC curve (AUC) and the corresponding 95% confidence intervals were determined at the same time. A simple-to-use nomogram was made to visualize the regression model. SPSS ver. 24.0 software (SPSS Inc., Chicago, IL, US), MedCalc ver. 18.0 software (MedCalc Software, Ostend, Belgium) and R ver. 2.8.1(R foundation for Statistical Computing) with the rms package were used for statistical analyses. A P-value <0.05 was considered to be a statistically significant difference.
Results
Characteristics of participants
Among the 1018 T2DM patients, the mean age was 58.59 ± 11.34 years and the mean HbA1c value was 8.79 ± 1.81%. There were 564 males (55.4%), with a mean age of 56.47 ± 11.35 years; the mean HbA1c was 8.74 ± 1.81%. There were 454 females (44.6%), with a mean age of 61.23 ± 10.78 years; the mean HbA1c was 8.86 ± 1.82%. Of all the patients, 20.1% had a 25(OH)D level of ≥20 ng/mL, 48.1% had a level of 10 to < 20 ng/mL, and 31.8% had a level of <10 ng/mL. Patients with PAD tended to be older, had diabetes for a longer duration, higher serum creatinine levels and a lower GFR. These patients were more likely to have diabetic retinopathy and a history of hypertension, CHD and cerebral infarction. There were no significant differences in sex, BMI, smoking status, HbA1c levels, serum uric acid or serum lipid metabolism between participants with and without PAD (P > 0.05). Additionally, compared to patients without PAD, patients with PAD showed no significant differences in serum calcium, phosphate and ALP (P > 0.05) (Table 1).
Table 1.
Clinic characteristics of type 2 diabetic patients with or without PAD
| NPAD (N = 940) | PAD (N = 78) | P | |
|---|---|---|---|
| Age, years | 57.82 ± 11.12 | 67.88 ± 9.77 | 0.000 |
| Male, n(%) | 526 (56.0%) | 38 (48.7%) | 0.216 |
| BMI, kg/m2 | 25.58 ± 3.36 | 26.08 ± 3.62 | 0.204 |
| Smoking status, n(%) | |||
| never | 589 (62.7%) | 45 (55.7%) | |
| former | 105 (11.2%) | 15 (19.2%) | 0.104 |
| current | 246 (26.2%) | 18 (23.1%) | |
| Duration of diabetes | |||
| ≥10 years | 565 (60.1%) | 57 (73.1%) | 0.024 |
| <10 years | 375 (39.9%) | 21 (26.9%) | |
| Hypertension, n(%) | 525 (55.9%) | 62 (79.5%) | 0.000 |
| Hyperlipidemia, n (%) | 505 (53.7%) | 46 (59.0%) | 0.371 |
| CHD, n (%) | 201 (21.4%) | 37 (47.4%) | 0.000 |
| Cerebral infarction, n (%) | 119 (12.7%) | 20 (25.6%) | 0.001 |
| Diabetic retinopathy, n (%) | |||
| NDR | 665 (70.7%) | 39 (50.0%) | |
| NPDR | 171 (18.2%) | 24 (30.8%) | 0.001 |
| PDR | 104 (11.1%) | 15 (19.2%) | |
| GFR, ml/min | 92.22 ± 19.92 | 75.33 ± 19.90 | 0.000 |
| HbA1c, % | 8.77 ± 1.82 | 9.12 ± 1.71 | 0.108 |
| Serum creatinine, umol/L | 65.34 ± 15.17 | 72.77 ± 17.97 | 0.001 |
| Serum uric acid, mmol/L | 329.92 ± 79.93 | 340.85 ± 82.75 | 0.253 |
| TC, mmol/L | 4.47 ± 0.99 | 4.55 ± 1.17 | 0.488 |
| LDL, mmol/L | 2.68 ± 0.84 | 2.74 ± 0.97 | 0.598 |
| HDL, mmol/L | 1.20 ± 0.31 | 1.02 ± 0.27 | 0.712 |
| TG, mmol/L | 1.85 ± 1.57 | 1.96 ± 1.23 | 0.537 |
| Serum 25(OH)D, ng/ml | 14.81 ± 8.43 | 11.55 ± 5.65 | 0.000 |
| Serum calcium, mmol/L | 2.25 ± 0.09 | 2.26 ± 0.10 | 0.412 |
| Serum phosphate, mmol/L | 1.26 ± 0.17 | 1.24 ± 0.16 | 0.314 |
| ALP, mmol/L | 73.42 ± 22.2 | 73.35 ± 23.33 | 0.978 |
NPAD no peripheral arterial disease, PAD peripheral arterial disease, BMI body mass index, CHD coronary heart disease, NDR non-diabetic retinopathy, NPDR non-proliferative diabetic retinopathy, PDR proliferative diabetic retinopathy, GFR glomerular filtration rate, HbA1c glycated hemoglobin, TC total cholesterol, LDL low density lipoprotein, HDL high density lipoprotein, TG triglycerides, 25(OH)D 25-hydroxyvitamin D, ALP alkaline phosphatase
The prevalence of PAD
A total of 78(7.7%) T2DM patients had PAD and the cohort was comprised of 38 males (48.7%) and 40 females (51.3%). The prevalence of PAD was gradually increased from patients with the highest (≥ 20 ng/mL), medium (10 to <20 ng/mL) to the lowest (< 10 ng/mL) levels of serum 25(OH)D, which was 2.8, 7.5 and 10.7% respectively (P > 0.05). Compared to patients without PAD, serum 25(OH)D levels were significantly lower in subjects with PAD (14.81 ± 8.43 vs. 11.55 ± 5.65 ng/mL, P < 0.001).
Association between 25(OH)D levels and PAD
The association between 25(OH) D levels and PAD was analyzed in 3 Models. After adjustment for Model 1, compared to patients with serum 25(OH)D ≥ 20 ng/mL, the odds ratio of PAD in patients with a level of 10 to <20 ng/mL and < 10 ng/mL was 3.587(95% CI: 1.314–9.790) and 5.540(95% CI: 2.004–15.320), respectively. When further considering the influence of CHD, hypertension and cerebral infarction, the ratio changed to 3.824(95% CI: 1.378–10.615) and 5.729(95% CI: 2.028–16.187), respectively. And after further adjustment for the duration of diabetes, HbA1c and GFR, the ratio changed to 3.489(95% CI: 1.100–11.062) and 3.872(95% CI: 1.168–12.841), respectively (Table 2).
Table 2.
Odds ratios of PAD by categorical 25(OH)D levels
| Variable | OR | 95%CI | P | |
|---|---|---|---|---|
| Model 1 | 25(OH)D ≥ 20 ng/ml | 1(ref) | ||
| 25(OH)D 10 to<20 ng/ml | 3.587 | 1.314–9.790 | 0.013 | |
| 25(OH)D<10 ng/ml | 5.540 | 2.004–15.320 | 0.001 | |
| Model 2 | 25(OH)D ≥ 20 ng/ml | 1(ref) | ||
| 25(OH)D 10 to<20 ng/ml | 3.824 | 1.378–10.615 | 0.010 | |
| 25(OH)D<10 ng/ml | 5.729 | 2.028–16.187 | 0.001 | |
| Model 3 | 25(OH)D ≥ 20 ng/ml | 1(ref) | ||
| 25(OH)D 10 to<20 ng/ml | 3.489 | 1.100–11.062 | 0.034 | |
| 25(OH)D<10 ng/ml | 3.872 | 1.168–12.841 | 0.027 |
Model 1 was adjusted for age, sex, BMI, smoking status and season
Model 2 was adjusted for age, sex, BMI, smoking status, season, CHD, hypertension and cerebral infarction
Model 3 was adjusted for age, sex, BMI, smoking status, season, CHD, hypertension, cerebral infarction, HbA1c, duration of diabetes and GFR
PAD peripheral arterial disease, 25(OH)D: 25-hydroxyvitamin D
Comparison of 3 models for diagnosing PAD
The AUC areas of Model 1, Model 2 and Model 3 were 0.799 (95%CI: 0.768–0.828), 0.829 (95%CI: 0.799–0.856) and 0.854 (95%CI: 0.826–0.879), respectively (Fig. 2). All the models had a positive value in diagnosing PAD(P < 0.0001). There were statistical differences between the 3 Models, and Model 3 turned out to be the most powerful model. A nomogram was developed to visualize the Model 3 that could assess the risk of PAD (Fig. 3).
Fig. 2.
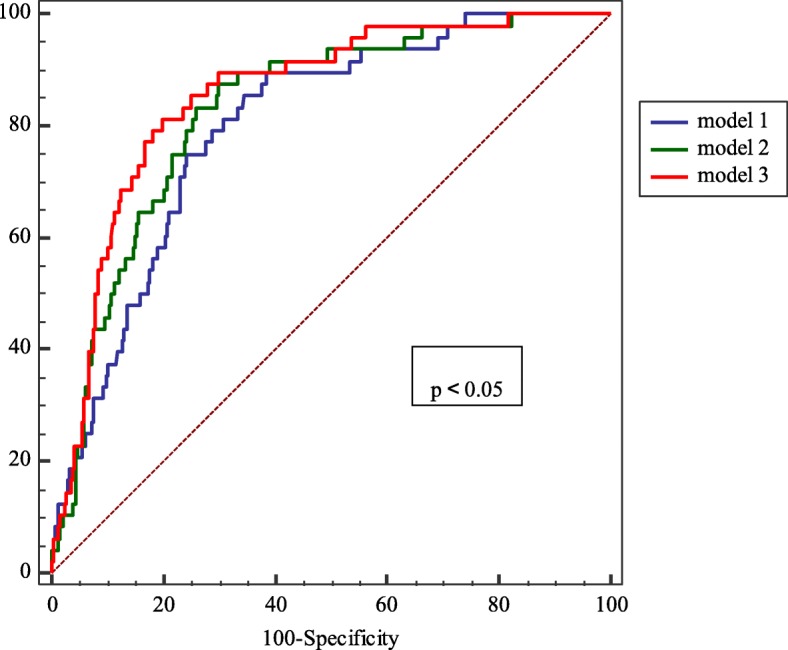
Comparison of the three logistic regression models for diagnosing PAD in patients with T2DM
Fig. 3.

A simple-to-use nomogram for diagnosing PAD. Instructions for using the nomogram: Draw a perpendicular line from the axis of each risk factor to determine the corresponding “POINTS” . The total points of all risk factors are then obtained. After that, draw a line descending from the axis “TOTAL POINTS” until it reaches the axis of “Rik of PAD”. For binary variables (except “Duration”), 0 = no and 1 = yes. For duration categories, 0 = duration of diabetes≥10 years and 1 = duration of diabetes<10 years. For season categories, 0 = spring, 1 = summer, 2 = autumn, 3 = winter. For smoke categories, 0 = never, 1 = former and 2 = current. For VDD categories, 0 = serum 25(OH)D ≥ 20 ng/ml, 1 = serum 25(OH)D 10 to<20 ng/ml and 2 = serum 25(OH)D<10 ng/ml
Discussion
In this cross-sectional study of 1018 hospitalized T2DM patients, we demonstrated that 79.9% of patients in the study had serum 25(OH)D levels lower than 20 ng/mL, while only 20.1% had levels higher than 20 ng/mL, which means vitamin D deficiency in T2DM patients was very common. The serum 25(OH)D levels in patients without PAD were much higher than those in patients with PAD. In the different vitamin D groups from the highest to the lowest levels, the prevalence of PAD was increased gradually (2.8, 7.5 and 10.7% respectively). Surprisingly, the association of 25(OH)D and PAD was still significant after adjustment for known PAD risk factors and related indexes of diabetes.
Many studies have confirmed an association between vitamin D deficiency and increased prevalence of cardiovascular events or mortality [15, 16]. However, there is a controversy in the relationship between vitamin D deficiency and PAD. A number of studies have demonstrated that low serum 25(OH)D levels are closely linked with PAD. Results from NHANES 2001–2004 [10] analyzed the data of 4839 participants and revealed that after multivariable adjustment, compared to the highest 25(OH)D quartile (≥29.2 ng/mL), the prevalence ratio of PAD for the lowest 25(OH)D quartile (< 17.8 ng/mL) was 1.80 (95% CI: 1.19–2.74). Another study [17] reviewed the medical data of 1435 veterans and concluded that vitamin D deficiency was associated with an increased amputation risk in veterans with PAD. However, other studies did not agree with this conclusion. Veronese N et al [18] selected 3099 participants and found no evidence of any significant association between the incident of PAD and serum 25(OH)D levels after a mean of 4.4 years follow-up, no matter whether adjusting for known PAD risk factors or not. Another cohort study [19] followed 11,789 subjects for over 17.1 years. In this study, it was shown that compared to participants with sufficient 25(OH)D, the hazard ratio of PAD in those with deficient 25(OH)D levels was 1.25 (95% CI: 1.06–1.48) after adjustment for demographic characteristics, BMI, physical activity, and smoking status. However, after further inclusion of cardiovascular risk factors, there was no evident association (OR: 1.15; 95%CI: 0.97–1.37)). Racial differences may be a contributing factor to the contradictory results [9]. To the best of our knowledge, there have been only a small number of Chinese studies in this field [20, 21]. Therefore, more data of Chinese population are urgently needed in future investigations. Our findings revealed that there was a strong association between low serum 25(OH)D levels and the prevalence of PAD after adjustment for various risk factors, strongly suggesting that vitamin D deficiency is an independent risk factor for PAD.
Several possible mechanisms have been described to explain the association between low serum vitamin D levels and the increased risk of developing PAD. In vitro studies, vitamin D levels have shown an association between obesity, diabetes and dyslipidemia [22–24], which are all significant risk factors for PAD. In the present study, even excluding the influence of PAD risk factors, the relationship between serum 25(OH)D levels and PAD was still present, which means maybe some other mechanisms are also involved. First, in vivo studies, active vitamin D calcitriol inhibits endothelial cell activation and TNF-α adhesion molecule expression, which play a role in the various stages of atherosclerosis [25]. Second, vitamin D can modulate and regulate the activity of inflammatory cytokines such as TNF-α and IL-10, and thus influencing the atherosclerotic process [26]. In addition, vitamin D may increase platelet aggregation and thrombogenesis [27]. Importantly, low levels of vitamin D may upregulate the renin-angiotensin-aldosterone system (RAAS) [28],which could stimulate collagen formation, matrix remodeling and vascular hypertrophy, increase oxidant stress, depress nitric-oxide-dependent signaling, and reduce elastin synthesis [29], leading to the development of atherosclerosis.
Nomograms, as statistical tools, have been widely used to aid clinical decisions. Nomograms could help physicians not only to estimate the likelihood of a specific event for an individual subject (i.e. cancer survival time), but also to predict the outcome using combined clinical risk factors [30]. In the present study, we developed a nomogram-illustrated model to assess the risk of PAD in T2DM patients, which may be used in clinical practice and to inform patients about their risk of developing PAD. Furthermore, the nomogram may be applied for preventing PAD, such as losing weight, better control of blood glucose and supplementation of vitamin D. However, more evidence from randomized controlled trials will be required to evaluate the effect of the preventive therapeutic strategies with the risk factors in the nomogram.
There are some limitations to our study conclusions. First, this was a cross-sectional study and residual confounding factors may have remained, so it is difficult to conclude definitive cause-effect relationships. Second, as a single center hospitalized study, the enrolled patients may be different from the actual demographic profile of Beijing. Third, the number of patients in the study was relatively small. And a larger sample size prospective study will be preferable. Fourth, we did not differentiate symptomatic and non-symptomatic patients with PAD in the current study. Finally, ABI was the only measurement used to diagnose PAD. Ultrasonography and angiography of the lower extremities should be conducted in the future studies.
Conclusions
Reduced serum vitamin D levels increased the risk of PAD in T2DM patients. This association was still strong after adjustment for known PAD risk factors and related indications of diabetes. Considering PAD is a very common and severe complication of T2DM, randomized intervention clinical studies should be carried out to verify the effect of vitamin D supplementation on PAD.
Acknowledgments
None.
Abbreviations
- 1,25(OH)2D
1,25 dihydroxyvitamin D
- 25(OH)D
25-hydroxyvitamin D
- ABI
Ankle-brachial index
- ALP
Alkaline phosphatase
- ALT
Alanine aminotransferase
- AUC
The area under the ROC curve
- BMI
Body mass index
- CHD
Coronary heart disease
- GFR
Glomerular filtration rate
- HbA1c
Glycated hemoglobin
- HDL
High density lipoprotein
- LDL
Low density lipoprotein
- NDR
Non-diabetic retinopathy
- NPDR
Non-proliferative diabetic retinopathy
- PAD
Peripheral arterial disease
- PDR
Proliferative diabetic retinopathy
- ROC
Receiver operating characteristic
- T2DM
Type 2 diabetes mellitus
- TC
Total cholesterol
- TG
Triglycerides
Authors’ contributions
JKY designed the study. JY collected the data. JY, LH and ZX analyzed and interpreted the data. JY and PJ edited the text. All authors read and approved the final manuscript.
Funding
A priming scientific research foundation for the junior researcher in Beijing Tongren Hospital, Capital Medical University (TRYY-KYJJ-2016-057), awarded to Jing Yuan, supported this research in the collection and analysis of the data.
Availability of data and materials
The data that support the findings of this study are available from the corresponding author upon reasonable request.
Ethics approval and consent to participate
The Ethical Committee of Beijing Tongren Hospital, Capital Medical University approved the study and written informed consent was obtained from all study participants.
Consent for publication
Not applicable.
Competing interests
The authors declare that they have no competing interests.
Footnotes
Publisher’s Note
Springer Nature remains neutral with regard to jurisdictional claims in published maps and institutional affiliations.
Contributor Information
Jing Yuan, Email: yuanjingapple@126.com.
Pu Jia, Email: jiapum@163.com.
Lin Hua, Email: hualin7750@139.com.
Zhong Xin, Email: xinz@medmail.com.cn.
Jin-Kui Yang, Email: jkyang@ccmu.edu.cn.
References
- 1.Criqui MH, Langer RD, Fronek A, Feigelson HS, Klauber MR, McCann TJ, Browner D. Mortality over a period of 10 years in patients with peripheral arterial disease. N Engl J Med. 1992;326(6):381–386. doi: 10.1056/NEJM199202063260605. [DOI] [PubMed] [Google Scholar]
- 2.Allison MA, Ho E, Denenberg JO, Langer RD, Newman AB, Fabsitz RR, Criqui MH. Ethnic-specific prevalence of peripheral arterial disease in the United States. Am J Prev Med. 2007;32(4):328–333. doi: 10.1016/j.amepre.2006.12.010. [DOI] [PubMed] [Google Scholar]
- 3.Wang Y, Xu Y, Li J, Wei Y, Zhao D, Hou L, Hasimu B, Yang J, Yuan H, Hu D. Characteristics of prevalence in peripheral arterial disease and correlative risk factors and comorbidities among female natural population in China. VASA. 2010;39(4):305–311. doi: 10.1024/0301-1526/a000054. [DOI] [PubMed] [Google Scholar]
- 4.Selvin E, Erlinger TP. Prevalence of and risk factors for peripheral arterial disease in the United States: results from the National Health and Nutrition examination survey, 1999-2000. CIRCULATION. 2004;110(6):738–743. doi: 10.1161/01.CIR.0000137913.26087.F0. [DOI] [PubMed] [Google Scholar]
- 5.Kayaniyil S, Vieth R, Retnakaran R, Knight JA, Qi Y, Gerstein HC, Perkins BA, Harris SB, Zinman B, Hanley AJ. Association of vitamin D with insulin resistance and beta-cell dysfunction in subjects at risk for type 2 diabetes. Diabetes Care. 2010;33(6):1379–1381. doi: 10.2337/dc09-2321. [DOI] [PMC free article] [PubMed] [Google Scholar]
- 6.Pittas AG, Lau J, Hu FB, Dawson-Hughes B. The role of vitamin D and calcium in type 2 diabetes. A systematic review and meta-analysis. J Clin Endocrinol Metab. 2007;92(6):2017–2029. doi: 10.1210/jc.2007-0298. [DOI] [PMC free article] [PubMed] [Google Scholar]
- 7.Mitri J, Nelson J, Ruthazer R, Garganta C, Nathan DM, Hu FB, Dawson-Hughes B, Pittas AG. Plasma 25-hydroxyvitamin D and risk of metabolic syndrome: an ancillary analysis in the diabetes prevention program. Eur J Clin Nutr. 2014;68(3):376–383. doi: 10.1038/ejcn.2013.293. [DOI] [PMC free article] [PubMed] [Google Scholar]
- 8.Faridi KF, Zhao D, Martin SS, Lupton JR, Jones SR, Guallar E, Ballantyne CM, Lutsey PL, Michos ED. Serum vitamin D and change in lipid levels over 5 y: the atherosclerosis risk in communities study. NUTRITION. 2017;38:85–93. doi: 10.1016/j.nut.2017.01.008. [DOI] [PMC free article] [PubMed] [Google Scholar]
- 9.Reis JP, Michos ED, von Muhlen D, Miller ER. Differences in vitamin D status as a possible contributor to the racial disparity in peripheral arterial disease. Am J Clin Nutr. 2008;88(6):1469–1477. doi: 10.3945/ajcn.2008.26447. [DOI] [PubMed] [Google Scholar]
- 10.Melamed ML, Muntner P, Michos ED, Uribarri J, Weber C, Sharma J, Raggi P. Serum 25-hydroxyvitamin D levels and the prevalence of peripheral arterial disease: results from NHANES 2001 to 2004. Arterioscler Thromb Vasc Biol. 2008;28(6):1179–1185. doi: 10.1161/ATVBAHA.108.165886. [DOI] [PMC free article] [PubMed] [Google Scholar]
- 11.Zagura M, Serg M, Kampus P, Zilmer M, Eha J, Unt E, Lieberg J, Cockcroft JR, Kals J. Aortic stiffness and vitamin D are independent markers of aortic calcification in patients with peripheral arterial disease and in healthy subjects. Eur J Vasc Endovasc Surg. 2011;42(5):689–695. doi: 10.1016/j.ejvs.2011.07.027. [DOI] [PubMed] [Google Scholar]
- 12.Garcia-Canton C, Bosch E, Ramirez A, Gonzalez Y, Auyanet I, Guerra R, Perez MA, Fernandez E, Toledo A, Lago M, et al. Vascular calcification and 25-hydroxyvitamin D levels in non-dialysis patients with chronic kidney disease stages 4 and 5. Nephrol Dial Transplant. 2011;26(7):2250–2256. doi: 10.1093/ndt/gfq650. [DOI] [PubMed] [Google Scholar]
- 13.Liew JY, Sasha SR, Ngu PJ, Warren JL, Wark J, Dart AM, Shaw JA. Circulating vitamin D levels are associated with the presence and severity of coronary artery disease but not peripheral arterial disease in patients undergoing coronary angiography. Nutr Metab Cardiovasc Dis. 2015;25(3):274–279. doi: 10.1016/j.numecd.2014.12.005. [DOI] [PubMed] [Google Scholar]
- 14.McDermott MM, Liu K, Ferrucci L, Tian L, Guralnik J, Kopp P, Van Horn L, Liao Y, Green D, Kibbe M, et al. Vitamin D status, functional decline, and mortality in peripheral artery disease. Vasc Med. 2014;19(1):18–26. doi: 10.1177/1358863X13518364. [DOI] [PMC free article] [PubMed] [Google Scholar]
- 15.Umehara K, Mukai N, Hata J, Hirakawa Y, Ohara T, Yoshida D, Kishimoto H, Kitazono T, Hoka S, Kiyohara Y, et al. Association between serum vitamin D and all-cause and cause-specific death in a general Japanese population- the Hisayama study. Circ J. 2017;81(9):1315–1321. doi: 10.1253/circj.CJ-16-0954. [DOI] [PubMed] [Google Scholar]
- 16.De Metrio M, Milazzo V, Rubino M, Cabiati A, Moltrasio M, Marana I, Campodonico J, Cosentino N, Veglia F, Bonomi A, et al. Vitamin D plasma levels and in-hospital and 1-year outcomes in acute coronary syndromes: a prospective study. Medicine (Baltimore) 2015;94(19):e857. doi: 10.1097/MD.0000000000000857. [DOI] [PMC free article] [PubMed] [Google Scholar]
- 17.Gaddipati VC, Bailey BA, Kuriacose R, Copeland RJ, Manning T, Peiris AN. The relationship of vitamin D status to cardiovascular risk factors and amputation risk in veterans with peripheral arterial disease. J Am Med Dir Assoc. 2011;12(1):58–61. doi: 10.1016/j.jamda.2010.02.006. [DOI] [PubMed] [Google Scholar]
- 18.Veronese N, De Rui M, Bolzetta F, Toffanello ED, Coin A, Zambon S, Corti MC, Baggio G, Perissinotto E, Maggi S, et al. Serum 25-Hydroxyvitamin D and the incidence of peripheral artery disease in the elderly: the pro.V.a study. J Atheroscler Thromb. 2015;22(7):726–734. doi: 10.5551/jat.28134. [DOI] [PubMed] [Google Scholar]
- 19.Rapson IR, Michos ED, Alonso A, Hirsch AT, Matsushita K, Reis JP, Lutsey PL. Serum 25-hydroxyvitamin D is associated with incident peripheral artery disease among white and black adults in the ARIC study cohort. ATHEROSCLEROSIS. 2017;257:123–129. doi: 10.1016/j.atherosclerosis.2017.01.016. [DOI] [PMC free article] [PubMed] [Google Scholar]
- 20.Li DM, Zhang Y, Li Q, Xu XH, Ding B, Ma JH. Low 25-Hydroxyvitamin D level is associated with peripheral arterial disease in type 2 diabetes patients. Arch Med Res. 2016;47(1):49–54. doi: 10.1016/j.arcmed.2016.01.007. [DOI] [PubMed] [Google Scholar]
- 21.Zhou W, Ye SD. Relationship between serum 25-hydroxyvitamin D and lower extremity arterial disease in type 2 diabetes mellitus patients and the analysis of the intervention of vitamin D. J Diabetes Res. 2015;2015:815949. doi: 10.1155/2015/815949. [DOI] [PMC free article] [PubMed] [Google Scholar]
- 22.Ford ES, Ajani UA, McGuire LC, Liu S. Concentrations of serum vitamin D and the metabolic syndrome among U.S. adults. Diabetes Care. 2005;28(5):1228–1230. doi: 10.2337/diacare.28.5.1228. [DOI] [PubMed] [Google Scholar]
- 23.Forman JP, Giovannucci E, Holmes MD, Bischoff-Ferrari HA, Tworoger SS, Willett WC, Curhan GC. Plasma 25-hydroxyvitamin D levels and risk of incident hypertension. HYPERTENSION. 2007;49(5):1063–1069. doi: 10.1161/HYPERTENSIONAHA.107.087288. [DOI] [PubMed] [Google Scholar]
- 24.Martins D, Wolf M, Pan D, Zadshir A, Tareen N, Thadhani R, Felsenfeld A, Levine B, Mehrotra R, Norris K. Prevalence of cardiovascular risk factors and the serum levels of 25-hydroxyvitamin D in the United States: data from the third National Health and Nutrition examination survey. Arch Intern Med. 2007;167(11):1159–1165. doi: 10.1001/archinte.167.11.1159. [DOI] [PubMed] [Google Scholar]
- 25.Equils O, Naiki Y, Shapiro AM, Michelsen K, Lu D, Adams J, Jordan S. 1,25-Dihydroxyvitamin D inhibits lipopolysaccharide-induced immune activation in human endothelial cells. Clin Exp Immunol. 2006;143(1):58–64. doi: 10.1111/j.1365-2249.2005.02961.x. [DOI] [PMC free article] [PubMed] [Google Scholar]
- 26.Schleithoff SS, Zittermann A, Tenderich G, Berthold HK, Stehle P, Koerfer R. Vitamin D supplementation improves cytokine profiles in patients with congestive heart failure: a double-blind, randomized, placebo-controlled trial. Am J Clin Nutr. 2006;83(4):754–759. doi: 10.1093/ajcn/83.4.754. [DOI] [PubMed] [Google Scholar]
- 27.Wu-Wong JR. Potential for vitamin D receptor agonists in the treatment of cardiovascular disease. Br J Pharmacol. 2009;158(2):395–412. doi: 10.1111/j.1476-5381.2009.00171.x. [DOI] [PMC free article] [PubMed] [Google Scholar]
- 28.Li YC, Kong J, Wei M, Chen ZF, Liu SQ, Cao LP. 1,25-Dihydroxyvitamin D (3) is a negative endocrine regulator of the renin-angiotensin system. J Clin Invest. 2002;110(2):229–238. doi: 10.1172/JCI0215219. [DOI] [PMC free article] [PubMed] [Google Scholar]
- 29.Zieman SJ, Melenovsky V, Kass DA. Mechanisms, pathophysiology, and therapy of arterial stiffness. Arterioscler Thromb Vasc Biol. 2005;25(5):932–943. doi: 10.1161/01.ATV.0000160548.78317.29. [DOI] [PubMed] [Google Scholar]
- 30.Martini A, Cumarasamy S, Beksac AT, Abaza R, Eun DD, Bhandari A, Hemal AK, Porter JR, Badani KK. A nomogram to predict significant estimated glomerular filtration rate reduction after robotic partial nephrectomy. Eur Urol. 2018;74(6):833–839. doi: 10.1016/j.eururo.2018.08.037. [DOI] [PubMed] [Google Scholar]
Associated Data
This section collects any data citations, data availability statements, or supplementary materials included in this article.
Data Availability Statement
The data that support the findings of this study are available from the corresponding author upon reasonable request.