

Pho7 is the Schizosaccharomyces pombe fission yeast Zn2Cys6 transcriptional factor that drives a response to phosphate starvation in which phosphate acquisition genes are upregulated. Here we report a crystal structure at 1.6-Å resolution of the Pho7 DNA-binding domain (DBD) bound at its target site 2 in the pho1 promoter (5′-TCGGAAATTAAAAA).
KEYWORDS: DNA-protein interaction, Schizosaccharomyces pombe, mutagenesis, protein structure, transcription factor
ABSTRACT
Pho7 is the Schizosaccharomyces pombe fission yeast Zn2Cys6 transcriptional factor that drives a response to phosphate starvation in which phosphate acquisition genes are upregulated. Here we report a crystal structure at 1.6-Å resolution of the Pho7 DNA-binding domain (DBD) bound at its target site 2 in the pho1 promoter (5′-TCGGAAATTAAAAA). Comparison to the previously reported structure of Pho7 DBD in complex with its binding site in the tgp1 promoter (5′-TCGGACATTCAAAT) reveals shared determinants of target site specificity as well as variations in the protein-DNA interface that accommodate different promoter DNA sequences. Mutagenesis of Pho7 amino acids at the DNA interface identified nucleobase contacts at the periphery of the footprint that are essential for the induction of pho1 expression in response to phosphate starvation and for Pho7 binding to site 1 in the pho1 promoter.
INTRODUCTION
Pho7, a 738-amino-acid member of the Zn2Cys6 family of fungal transcription factors (1, 2), is the transcriptional activator underlying a Schizosaccharomyces pombe fission yeast response to phosphate starvation (3–6) that results in upregulation of the pho1, pho84, and tgp1 genes, encoding a cell surface acid phosphatase (Pho1), an inorganic phosphate transporter (Pho84), and a glycerophosphate transporter (Tgp1), respectively. An autonomous DNA-binding domain (DBD) of Pho7, spanning amino acids 279 to 368 and including the Zn2Cys6 module, was identified recently and used to locate Pho7 recognition sites in the promoters of the pho1 and tgp1 genes to a 12-nucleotide motif, 5′-TCG(G/C)(A/T)XXTTXAA (6). The tgp1 promoter contains a single Pho7 binding site. The pho1 promoter contains two Pho7 recognition elements (sites 1 and 2) separated by a 20-nucleotide spacer. The Pho7 DBD binds independently (and without apparent cooperativity) to these two sites in the pho1 promoter (6).
The Pho7 DNA-binding site is distinct from the DNA-binding sites of other Zn2Cys6 proteins that recognize pairs of CGG triplets that are arranged as inverted, direct, or everted repeats (1, 7–12). The tgp1 promoter site (5′-TCGGACATTCAA) and pho1 promoter site 2 (5′-TCGGAAATTAAA) that are bound by Pho7 contain only a single CGG triplet. Studies of the effects of single mutations of the CGG triplet on Pho7-DBD binding to the tgp1 promoter in vitro and on tgp1 and pho1 promoter activity in vivo underscore the importance of triplet recognition to Pho7 function in phosphate homeostasis (2).
We recently reported the 1.7-Å crystal structure of Pho7 DBD in a complex with its target site in the tgp1 promoter (2). The Pho7 DBD resembles the Gal4 DBD, a prototype of the Zn2Cys6 DBD (7, 8), with respect to the virtually identical folds of their Zn2Cys6 modules, comprising two α helices and associated loops, and the positions of the cysteines of their zinc coordination complexes. Pairwise replacement of the Pho7 Zn-binding cysteines (Cys292, Cys295, Cys302, Cys308, Cys311, Cys318) with alanine effaced the fission yeast phosphate starvation response (6), likely by disrupting the DBD fold. Alanine substitution for Arg306, which makes a network of fold-stabilizing hydrogen bonds, eliminated Pho7 binding to the tgp1 and pho1 promoter sites in vitro and abolished the in vivo induction of Pho1 in response to phosphate starvation (2).
The crystal structure highlighted two distinctive features of the Pho7-DNA interface. First, Pho7 DBD binds DNA as a monomer, unlike the DBDs of most other fungal Zn2Cys6 factors that bind as homodimers (1). In keeping with its monomeric DNA-binding mode, the Pho7 DBD lacks a counterpart of the coiled-coil homodimerization domain at the C terminus of the Gal4 DBD. Second, the Pho7 DBD protein engages in hydrogen bonding to 13 individual nucleobases within and remote from the CGG triplet (2). A limited mutational analysis of the Pho7-DNA interface with the tgp1 promoter identified several amino acids at which alanine substitution attenuated the pho1 phosphate starvation response and concordantly reduced Pho7 binding to a pho1 promoter site (2).
In the present study, we extend our analysis by solving the structure of Pho7 DBD in complex with recognition site 2 in the pho1 promoter. The results highlight how Pho7 can accommodate nucleotide sequence variations in its target site in the promoters of different Pho7-responsive genes (i.e., tgp1 versus pho1). With the structures of two Pho7-DNA complexes now in hand, we expanded the mutational analysis of the Pho7-DNA interface and thereby identified amino acids that abolish or attenuate the pho1 phosphate starvation response by virtue of their effect on the binding of Pho7 DBD to recognition site 1 in the pho1 promoter.
RESULTS
Structure of Pho7 DBD in complex with a DNA recognition site in the pho1 promoter.
Pho7 DBD was cocrystallized with a 19-bp DNA duplex that corresponds to site 2 of the pho1 promoter (Fig. 1). The structure of the protein-DNA complex was solved at 1.6-Å resolution (Rwork and Rfree = 18.09 and 20.27, respectively) (Table 1). The two zinc atoms are depicted as green spheres in Fig. 1, with the surrounding anomalous difference density being indicated by red mesh. Pho7 makes extensive contacts with the DNA nucleobases and backbone phosphates over a 14-bp segment, 5′-T1C2G3G4A5A6A7T8T9A10A11A12A13A14, of the pho1 promoter (numbered starting from the first T nucleotide of the consensus Pho7 binding motif). The first α helix of the zinc-binding module inserts into the DNA major groove over the 5′-T1C2G3G4 base pairs. The protein segments on either side of the zinc-binding module adopt an extended conformation that tracks with and penetrates into the DNA minor groove spanning 10 bp (5′-G4A5A6A7T8T9A10A11A12A13). Pho7 makes direct contacts to 11 of the DNA nucleobases in pho1 site 2, denoted by red dots in Fig. 1. The direct base contacts are located at the outer edges of the protein-DNA footprint. Pho7 makes multiple water-mediated contacts to nucleobases in the middle of the pho1 DNA. The protein-DNA interactions with pho1 site 2 are illustrated in two-dimensional cartoon format in Fig. 2A.
FIG 1.

Structure of Pho7 DBD bound to pho1 site 2 DNA. The Pho7-DNA complex is shown with the DNA depicted as a stick model, with an overlying transparent surface model being shown to highlight the major and minor grooves. The Pho7 protein is rendered as a cartoon trace with cyan α helices. The two zinc atoms are shown as green spheres, and the six zinc-binding cysteines are shown as stick models and labeled. The anomalous difference density for the zinc atoms, contoured at 5σ, is shown in red mesh. The primary structures of the pho1 site 2 DNA ligand (seen in its entirety in the crystal structure) and the Pho7 DBD polypeptide in the crystal structure are shown at bottom. Red dots indicate DNA nucleobases that are contacted directly by Pho7 amino acids. Black dots denote the zinc-binding cysteines.
TABLE 1.
Crystallographic data and refinement statistics
| Parametera | Value(s)b |
|---|---|
| Data collection statistics | |
| Beamline | 24ID-C |
| Space group | P21 |
| a, b, c (Å) | 53.17, 37.58, 57.56 |
| α, β, ϒ (o) | 90.00, 104.2, 90.00 |
| Wavelength | 0.97910 |
| Resolution (Å) | 50.00–1.60 (1.63–1.60) |
| Rpim | 0.027 (0.131) |
| I/σI | 29.7 (6.5) |
| Completeness (%) | 97.9 (95.1) |
| Redundancy | 4.0 (3.5) |
| Unique reflections | 28,959 (1,429) |
| CC1/2 | 1.000 (0.979) |
| Molecular replacement model (PDB accession no.) | 6E33 |
| Refinement statistics | |
| Rwork/Rfree (%) | 18.09/20.27 |
| No. of atoms | 1,668 |
| DNA | 814 |
| Protein | 466 |
| Ions | 2 |
| Water | 386 |
| B factors (mean/Wilson) | 22.0/12.8 |
| RMSD | |
| Bond lengths (Å) | 0.008 |
| Bond angles (o) | 1.048 |
| Ramachandran plot (%) | |
| Favored | 100 |
| Outliers | 0 |
| PBD accession no. | 6O19 |
I, intensity of a reflection; CC1/2, a correlation coefficient between two parts of the experimental data, each containing a random half of the measurements of each reflection; RMSD, root mean square deviation.
Values for the highest-resolution shell are in parentheses.
FIG 2.
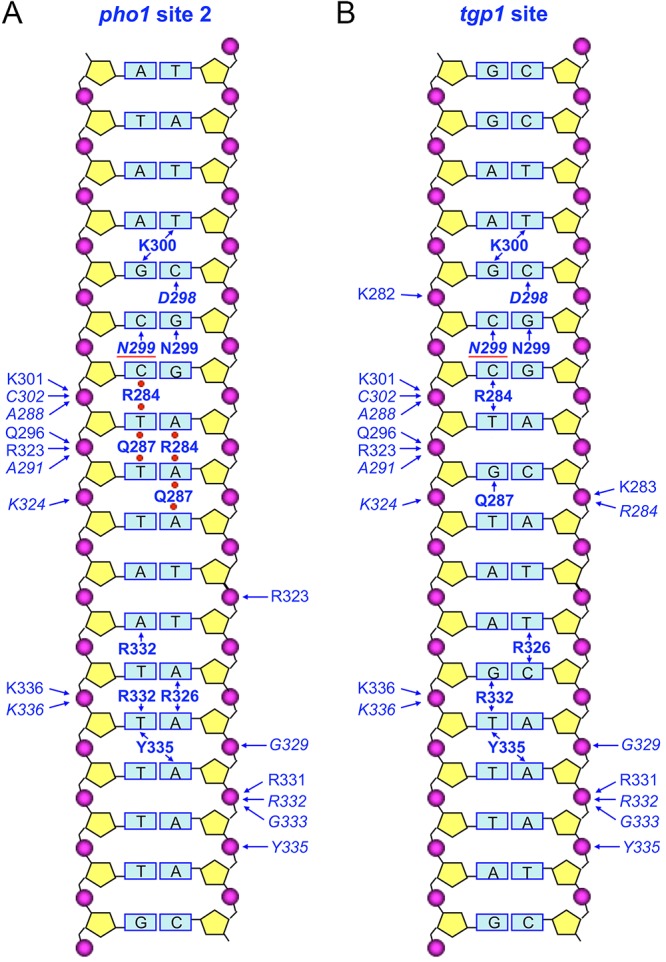
Cartoon diagram summarizing Pho7-DNA contacts. (A) The Pho7 complex with pho1 promoter site 2. (B) The Pho7 complex with the tgp1 promoter site. The DNAs are depicted as a two-dimensional base pair ladder, with the top (5′-CGG triplet-containing) strand being shown on the right and the complementary bottom strand being shown on the left. Amino acids that contact particular backbone phosphates are labeled to the left and right of the phosphates (depicted as magenta spheres) in plain font for side chain phosphate contacts and italic font for main chain phosphate contacts, as indicated by the arrows pointing at the phosphates. Amino acids that directly contact particular nucleobases are labeled in bold font (plain font for protein side chain interactions with bases and italic font for main chain contacts), as indicated by the arrows pointing at the bases. Water-mediated contacts to the nucleobases in the pho1 site 2 complex are denoted by red spheres between the amino acid label and the base. The red line denotes stacking of Asn299 on the cytosine base.
The Pho7-DNA interface in the major groove over the 5′-T1C2G3G4 base pairs is shown in Fig. 3A. Lys300 N-ζ makes bifurcated base-specific contacts to the thymine O-4 atom of the T1·A pair and the guanine O-6 atom of the C2·G pair. The Asp298 main chain carbonyl makes a base-specific hydrogen bond with the cytosine N-4 of the C2·G pair. Asn299 N-δ and the Asn299 main chain carbonyl make base-specific hydrogen bonds to the guanine O-6 and cytosine N-4 atoms of the G3·C pair, respectively. The Asn299 side chain stacks on and makes van der Waals contacts with the cytosine of the G4·C pair.
FIG 3.

The Pho7 interface with pho1 site 2 DNA. (A) Detailed stereo view focused on the interactions of the DBD with the DNA segment 5′-TCGGAAAT. The DNA is shown as a stick model with gray carbons and a gold cartoon trace through the backbone phosphates. The 5′-CGGAA top-strand nucleobases are labeled in bold font. Selected amino acids in the DBD are depicted as stick models with beige carbons and labeled in plain font for side chains and italic font for main chains. Waters are depicted as red spheres. Direct and water-mediated Pho7-DNA hydrogen bonds are indicated by black dashed lines. Van der Waals contacts are shown as green dashed lines. (B) Detailed stereo view focused on DBD interactions in the minor groove over the 5′-TTAAAAA segment.
A view of the minor groove interface with the 5′-G4A5A6A7 base pairs is also shown in Fig. 3A. Arg284 penetrates the minor groove, where it forms a network of water-mediated hydrogen bonds with cytosine O-2 of the G4·C pair, adenine N-3 and thymine O-2 of the A5·T pair, and adenine N-3 of the A6·T pair. Gln287 also penetrates the minor groove to make water-mediated hydrogen bonds via N-ε with thymine O-2 of the A5·T pair and adenine N-3 of the A6·T pair and via O-ε with thymine O-2 of the A6·T pair and adenine N-3 of the A7·T pair.
Pho7 DBD makes several hydrogen bonds to the phosphates of the 3′-A1G2C3C4T5T6T7 strand of the DNA segment shown in Fig. 3A. Lys301 N-ζ and the Cys302 and Ala288 main chain amides engage the C4pT5 phosphate. Gln296 N-ε, Arg323 NH-2, and the Ala291 main chain amide coordinate the T5pT6 phosphate. The Lys324 main chain amide contacts the T6pT7 phosphate. Arg323 NH-1 engages the 5′-T8pT9 phosphate on the other DNA strand.
Figure 3B shows the protein-DNA contacts to the distal portion of pho1 site 2, which are exclusively in the minor groove. Arg326 makes bifurcated hydrogen bonds from NH-2 to adenine N-3 of the A10·T pair and adenine N-3 of the A11·T pair. Arg332 makes bidentate hydrogen bonds from NH-2 to adenine N-3 of the T9·A pair and from NH-1 to thymine O-2 of the A11·T pair. The Tyr335 OH makes bifurcated hydrogen bonds to thymine O-2 of the A11·T pair and adenine N-3 of the A12·T pair. The Tyr335 phenyl ring also makes van der Waals contacts with the A13 deoxyribose sugar.
Phosphate contacts to the distal part of the pho1 site are shown in Fig. 3B. On the 5′-A10A11A12A13A14 strand, the A11pA12 phosphate is contacted by the Gly329 main chain amide. The A12pA13 phosphate is coordinated by the Arg332 and Gly333 main chain amides and by bifurcated hydrogen bonds from Arg331 N-ε. The A13pA14 phosphate is contacted by the Tyr335 main chain amide. On the other strand, the 3′-T10pT11 phosphate receives hydrogen bonds from Lys336 N-ζ and the Lys336 main chain amide.
Comparison of Pho7 complexes with two different promoter elements.
Figure 4 shows a stereo view of the superimposed structures of Pho7 DBD bound to the pho1 site 2 and tgp1 promoter elements. Figure 2 shows side-by-side cartoon projections of the atomic contacts of the Pho7 DBD with pho1 site 2 (Fig. 2A) and tgp1 (Fig. 2B) promoter elements. The DNA sequences of the two ligands within the 14-bp Pho7 footprint differ at three positions (underlined), with these being 5′-T1C2G3G4A5A6A7T8T9A10A11A12A13A14 in pho1 site 2 and 5′-T1C2G3G4A5C6A7T8T9C10A11A12A13T14 in tgp1. The DNA phosphate interactions are mostly identical in the two complexes, with the exception that the phosphate contacts made by the Lys282 and Lys283 side chains and the Arg284 main chain amide in the tgp1 complex (Fig. 2B) are not seen in the pho1 site 2 complex. This absence reflects a difference in the crystal lattice of the two complexes, whereby the N-terminal peptide segment 279GKVKKR moves away from the pho1 site 2 DNA to which Pho7 is bound (Fig. 4) so that Lys280 donates a hydrogen bond to a DNA phosphate in a neighboring complex related by crystallographic symmetry. Also, the nearly C-terminal peptide 326RPTG329 is displaced leftward in the pho1 site 2 complex by 3.1 Å with respect to the Pro327 C-α (Fig. 4) and by 2.6 Å and 2.7 Å at the Arg326 C-α and Thr328 C-α, respectively. This movement reflects the fact that the underlying DNA minor groove is narrower in the pho1 site 2 complex than in the tgp1 site complex (Fig. 4).
FIG 4.

Comparison of Pho7 DBD complexes with pho1 site 2 and tgp1 promoter DNAs. A stereo view of the superimposed structures of Pho7 bound to the tgp1 promoter site (colored gold) and pho1 site 2 (colored green) is shown. The N-terminal peptide segment that had a different trajectory in the pho1 complex is indicated by N. The C-terminal peptide segment 326RPTG329 that is displaced leftward in the pho1 complex concomitant with narrowing of the DNA minor groove is denoted by the P327 and T328 labels.
The most noteworthy similarities and differences in the two complexes pertain to the nucleobase contacts (Fig. 2). At the upstream edge of the footprint of both complexes, Lys300, Asp298, and Asn299 make direct base-specific atomic interactions with the 5′-T1C2G3 base pairs. At the distal margin of both complexes, Tyr335 makes direct contacts to the 5′-A11A12 base pairs. Between these bookends, there are significant differences in the protein-DNA interface. First, whereas in the tgp1 complex all protein contacts of Arg284 and Gln287 to the 5′-G4A5C6 base pairs are direct, in the pho1 site 2 complex Arg284 and Gln287 make a wider network of exclusively water-mediated contacts to the 5′-G4A5A6A7 base pairs (Fig. 2). We presume that this change occurs because of the difference in the identity of the sixth base pair of the recognition sequence, which is C:G in tgp1 and A·T in pho1 site 2. Second, the base interactions of Arg326 and Arg332 with the 5′-T9A10A11 base pairs in the pho1 site 2 complex are remodeled vis-à-vis their contacts with the 5′-T9C10A11 base pairs in the tgp1 complex (Fig. 2). These changes attest to plasticity in Pho7’s DNA interface underlying its ability to recognize sequence variants of its consensus binding site.
Effect of Pho7 mutations on phosphate homeostasis in vivo.
We used the two crystal structures of Pho7-DNA complexes to guide a new alanine scan of 6 amino acids implicated in DNA recognition in one or both of the complexes: Lys282, Lys283, Arg284, Asn299, Arg332, and Tyr335. We also replaced Tyr335 conservatively with phenylalanine. The mutant alleles were exchanged into the chromosomal pho7+ locus (6). The pho7 wild-type (pho7-WT), pho7 mutant (pho7-mut), and pho7Δ strains were tested for growth on yeast extract with supplements (YES) agar medium (Fig. 5A). As noted previously (2, 6), the pho7Δ strain grew as well as or slightly slower than the wild type (WT) at 25°C and was “sicker” at higher (34°C and 37°C) and lower (20°C) temperatures, as gauged by colony size (Fig. 5A). All seven mutant alleles complemented the temperature-sensitive and cold-sensitive phenotypes (Fig. 5A). Western blotting of whole-cell extracts affirmed that the Pho7 WT and mutant proteins were present at similar levels and that no Pho7 was detected in the extract from pho7Δ cells (Fig. 5B).
FIG 5.

Effect of Pho7 mutations on phosphate homeostasis in vivo. (A) S. pombe strains deleted of pho7 (pho7Δ) or bearing the indicated pho7 alleles were spot tested for growth at the temperatures specified. (B) Western blots of whole-cell extracts prepared from S. pombe strains with the indicated pho7-TAP or pho7Δ alleles. The blots were probed with antibodies recognizing the TAP tag (top) or the Spt5 protein (bottom). The positions and sizes (in kilodaltons) of marker polypeptides are indicated on the left. (C) Acid phosphatase activity of cells bearing the indicated pho7 alleles assayed before (+ phosphate) and 5 h after (– phosphate) transfer of logarithmically growing cells to medium lacking phosphate.
The pho7-WT, pho7-mut, and pho7Δ strains were assayed for the phosphate starvation response by determining Pho1 acid phosphatase activity before and 5 h after transferring the cells from rich medium to synthetic medium lacking phosphate. pho7-WT cells manifested a 4-fold increase in Pho1 activity after 5 h of starvation (Fig. 5C). pho7Δ cells had a very low basal level of acid phosphatase activity in phosphate-replete medium and did not induce Pho1 during phosphate starvation (Fig. 5C). The R332A, Y335A, and Y335F strains phenocopied the basal activity of the pho7Δ strain, and they failed to mount an effective response to phosphate starvation, implying that these mutations crippled Pho7’s ability to activate pho1 expression. In contrast, Pho1 activity in N299A cells was 81% of that of the WT under phosphate-replete conditions and also 81% of that of the WT after 5 h of phosphate starvation. The K282A, K283A, and R284A strains had basal Pho1 activities that were 41%, 18%, and 15% of the activity of the WT, respectively, and they mounted a response to starvation to reach levels of acid phosphatase activity after 5 h that were 94%, 57%, and 48% of the level of starved WT cells, respectively (Fig. 5C).
Figure 6 shows the results of a primer extension analysis of pho1 mRNA levels in the pho7-WT, pho7-mut, and pho7Δ strains sampled after 5 h of phosphate starvation. Actin (act1) mRNA was analyzed as an internal control in the primer extension reactions. The results affirmed that N299A, K282A, K283A, and R284A cells induced pho1 transcription in response to starvation (by comparison to the WT and pho7Δ strains), whereas R332A, Y335A, and Y335F cells displayed a feeble level of pho1 mRNA accumulation.
FIG 6.

Effect of Pho7 mutations on pho1 mRNA in phosphate-starved cells. Steady-state levels of pho1 mRNA (top) and act1 mRNA (bottom) were gauged by reverse transcriptase primer extension with gene-specific antisense primers in single reaction mixtures programmed by total RNA from phosphate-starved S. pombe strains deleted of pho7 (pho7Δ) or bearing the indicated pho7 alleles. The primer extension products were analyzed by urea-PAGE and visualized by autoradiography. The images shown in the top and bottom panels are from a single exposure of one gel. The positions and sizes (in nucleotides) of DNA size markers are indicated on the left.
Effect of Pho7 mutations on DNA binding in vitro.
The seven mutations studied as described above in the context of full-length Pho7 were introduced into the Pho7-(279–368) DNA-binding domain. Recombinant mutant DBDs were purified (Fig. 7A) and then assayed for binding to Pho7 sites 1 and 2 in the pho1 promoter and to the Pho7 site in the tgp1 promoter (Fig. 7B). The electrophoretic mobility shift assay (EMSA) results with pho1 site 1 are quantified in Fig. 8A. The results highlight a correlation between defective site 1 binding in vitro and pho1 expression in vivo. To wit, the R332A, Y335A, and Y335F mutations that most strongly affected the phosphate starvation response virtually abolished binding of the DBD to the site 1 probe (Fig. 8A). Mutations K282A, K283A, and N299A had no effect on site 1 binding. R284A reduced site 1 affinity by 40% compared to that for the WT (Fig. 8A).
FIG 7.
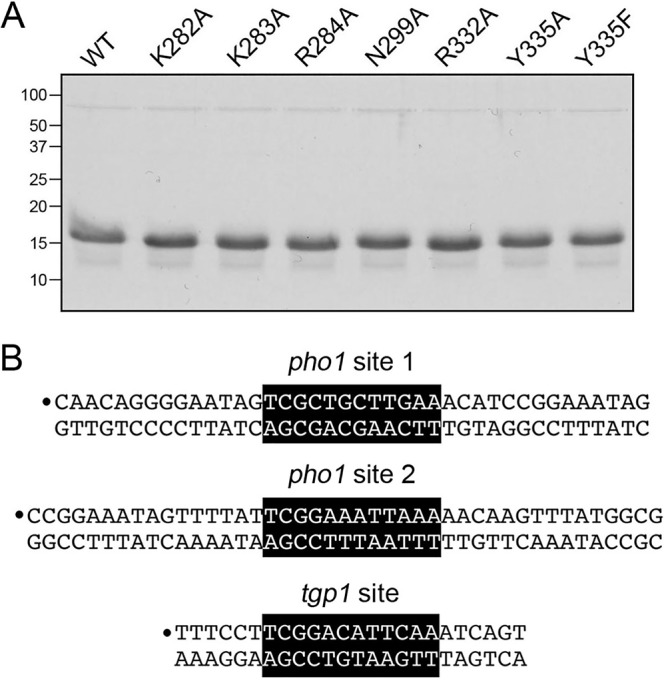
Pho7 DBD mutants. (A) Aliquots (5 μg) of the indicated wild-type and mutant Pho7-(279–368) proteins were analyzed by SDS-PAGE. The Coomassie blue-stained gel is shown. The positions and sizes (in kilodaltons) of marker polypeptides are indicated on the left. (B) The DNA ligands used for assay of Pho7 binding to pho1 promoter sites 1 and 2 and the tgp1 promoter site are shown. The 32P label is indicated by the circle. The Pho7 binding motif is shown on a black background.
FIG 8.
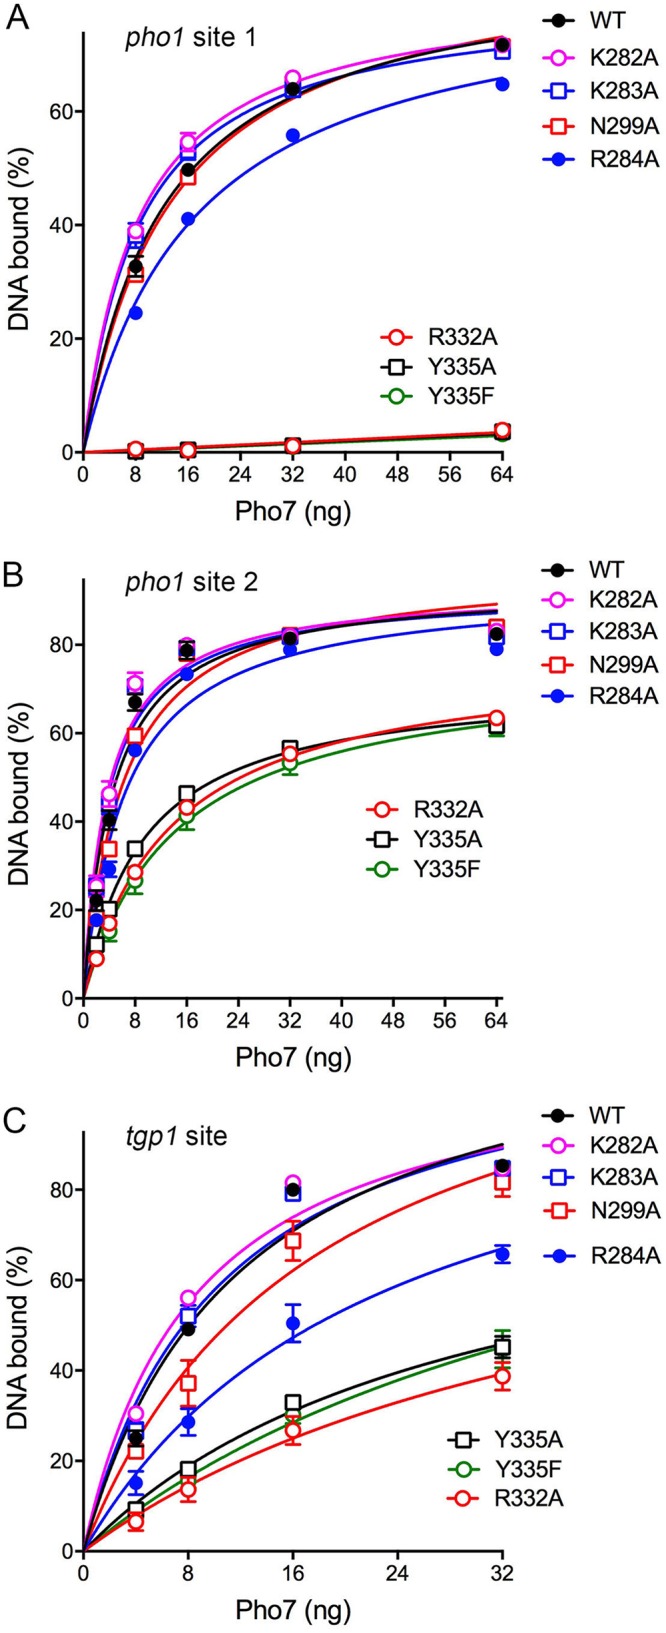
Mutational effects on Pho7 binding to three target sites. EMSAs were performed as described in Materials and Methods using the pho1 site 1 (A), pho1 site 2 (B), and tgp1 site (C) DNA probes depicted in Fig. 7B. The extents of DNA binding were quantified and are plotted as a function of the amount of input Pho7-(279–368). Each datum in the graphs is the average from three independent binding experiments ± SEM. The data were fit by nonlinear regression to a one-site specific binding equation in Prism software.
The EMSA results with pho1 site 2 (quantified in Fig. 8B) indicated, as noted previously (2, 6), that the affinity of Pho7-DBD was 3-fold greater for site 2 than for site 1. Mutations K282A, K283A, N299A, and R284A had no significant effect on site 2 binding. The R332A, Y335A, and Y335F DBDs (which were defective for site 1 binding) did bind site 2, albeit with affinities 2- to 3-fold lower than the affinity of the WT DBD and with a lower extent of site 2 binding at the highest level of protein tested. These results agree with the previous suggestion (2) that Pho7 binding to site 1 in the pho1 promoter is an Achilles heel with respect to the pho1 response to phosphate starvation.
Mutations elicited a range of phenotypes with respect to DBD binding to the tgp1 promoter site (Fig. 8C). The K282A and K283A mutations had no effect. The N299A mutant had a 50% lower affinity for the tgp1 site. The R284A mutation reduced the affinity by 2-fold, and again, the R332A, Y335A, and Y335F mutations had the greatest impact, with ∼3- to 4-fold decrements in affinity (Fig. 8C).
DISCUSSION
Here, we determined the atomic structure of the Pho7 DNA-binding domain bound at its target site 2 in the pho1 promoter and compared it to the structure of Pho7 DBD in complex with its binding site in the tgp1 promoter. As discussed above, the two Pho7-DNA structures reveal shared determinants of target site specificity as well as variations in the protein-DNA interface that accommodate different promoter DNA sequences. A new round of structure-guided mutations of Pho7 at the DNA interface illuminated structure-activity relations and identified two amino acids—Arg332 and Tyr335—at which alanine substitution concordantly effaced the pho1 phosphate starvation response and Pho7 binding to site 1 in the pho1 promoter. In what we regard as a surprising outcome, the mutational analysis revealed that the Asn299 side chain was dispensable for the pho1 phosphate starvation response and for Pho7 binding to all three promoter sites that were interrogated.
Pho7 resembles other Zn2Cys6 transcriptional factors with respect to recognition of a CGG base pair triplet in the DNA major groove (1). In the case of Gal4, the only amino acid side chain interaction with a DNA nucleobase is a bifurcated hydrogen bond from Lys18 N-ζ to the guanine N-7 atom (underlined) of the second base of the 5′-CGG triplet and to the guanine O-6 atom (underlined) of the third base of the 5′-CGG triplet (7, 8). The equivalent side chain in other Zn2Cys6 transcription factors also makes base-specific contacts to this second guanine: via a lysine in Ppr1, Hap1, Leu3, and AlcR (9, 11–13) or a histidine in Put3 (10). Asn299 is the equivalent Pho7 residue that donates a hydrogen bond from N-δ to guanine O-6 of the second base (underlined) of the 5′-CGG triplet. All of the aforementioned Zn2Cys6 proteins make a pair of hydrogen bonds from adjacent main chain carbonyls to the cytosine N-4 of the first C·G pair of the triplet and the cytosine N-4 of the second G·C pair. These are the equivalents of the main chain Pho7-DNA contacts made by Asp298 O and Asn299 O. Given the importance of the G3·C base pair in the 5′-T1C2G3G4 segment of the consensus Pho7 site (2), we expected to see a loss of Pho7 function upon replacement of Asn299 with alanine. That this was not the case suggests that the base-specific contact of the Asn299 main chain carbonyl with the cytosine of the G3·C pair suffices to achieve proper sequence recognition.
Our previous mutational analysis highlighted the importance of Lys300, which makes base-specific contacts in Pho7-DNA crystal structures with both the thymine of the T1·A pair and the guanine of the C2·G pair. A K300A mutation erased the pho1 starvation response and Pho7 binding to pho1 promoter site 1 (2). The K300A mutant DBD displayed a reduced binding affinity for pho1 promoter site 2 and tgp1 promoter DNA (2).
A key difference between the DNA interfaces of Pho7 and other Zn2Cys6 proteins is that Pho7 makes many contacts with the nucleobases in the minor groove at the downstream periphery of its 14-bp footprint. We reported previously that Arg326, which contacts the O-2 atoms of the 5′-T9 and C10 bases in the tgp1 complex and the N-3 atoms of the 5′-A10 and A11 bases in the pho1 site 2 complex, is important for Pho7 function. An R326A mutation ablated the pho1 starvation response and the binding of Pho7 to pho1 promoter site 1 (2). R326A elicited 16-fold and 2-fold decrements in Pho7 binding to the tgp1 site and pho1 site 2, respectively (2). Here we found that Arg332 and Tyr335 are also critical for Pho7 function. Arg332 sits across from Arg326 in the minor groove, where it makes contacts with two nucleobases on the 3′ strand: either with the 3′-G10 and T11 bases in the tgp1 complex or with the 3′-A9 and T11 bases in the pho1 site 2 complex. An R332A mutation interdicted the pho1 starvation response and Pho7 binding to pho1 promoter site 1; it also reduced Pho7 binding to tgp1 and pho1 site 2 promoter DNAs. The Tyr335 OH makes cross-strand minor groove contacts to the 3′-T11 and 5′-A12 bases and also engages in a hydrogen bond with Arg332 (Fig. 3B). The key role of the tyrosine hydroxyl is established by our findings that the Y335A and Y335F mutations behaved identically in eliminating the pho1 starvation response and Pho7 binding to pho1 promoter site 1 while also reducing binding to the tgp1 site and pho1 site 2.
Mutations of individual Pho7 amino acids that contact the bases in the middle of the DNA interface appear to have a lesser impact than mutations of residues that recognize bases at the periphery of the footprint. For example, we saw here that alanine substitution for Arg284, which makes direct contacts in the minor groove with bases 4 and 5 in the tgp1 complex or water-mediated contacts with bases 4, 5, and 6 in the pho1 site 2 complex, has a relatively mild impact on the pho1 starvation response and Pho7 binding to the three promoter DNAs tested. We reported previously that alanine substitution of Gln287, which makes direct minor groove interactions with the 3′-G6 base in the tgp1 complex and more extensive water-mediated contacts to 3′-T5 and T6 and 5′-A6 and A7 in the pho1 site 2 complex, reduced the pho1 starvation response by half and pho1 site 1 affinity by 4-fold (2).
The alanine mutations studied here and previously (2) of several amino acids that contact the DNA phosphate backbone (Lys282, Lys283, Gln296, Arg331) had little impact on promoter DNA binding or the pho1 phosphate starvation response. In contrast, mutation of Arg323, which contacts two phosphates, one on each strand across the minor groove in the pho1 site 2 complex, severely attenuated the pho1 starvation response and Pho7 binding to pho1 site 1, while also reducing tgp1 site binding by ∼16-fold (2). Alanine substitution for Lys301, which contacts a phosphate on the 3′ strand, reduced the pho1 starvation response by ∼3-fold and pho1 site 1 and tgp1 site affinity by ∼4-fold (2).
A consistent finding in our studies is that Pho7 binds less avidly to pho1 site 1 than to pho1 site 2 or the tgp1 promoter site and that the effect of Pho7 mutations on the pho1 phosphate starvation response reflects their impact on binding to pho1 site 1. We suspect that pho1 site 1 binding is a vulnerable point in Pho7 function because (i) the site 1 sequence 5′-T1C2G3C4 deviates from the 5′-T1C2G3G4 consensus found in pho1 site 2 and tgp1 and (ii) mutating the tgp1 G4·C base pair to C4·G reduced Pho7 binding by 3-fold (2). A fuller understanding of pho1 site 1 will depend on a structure of the Pho7 DBD in complex with site 1 promoter DNA. However, our attempts to cocrystallize the DBD bound to site 1 have not been fruitful.
In conclusion, this work extends a structural framework for understanding the principles of DNA recognition by Pho7, which are distinctive from those of other Zn2Cys6 transcriptional factors, and the contributions of individual amino acids at the DNA interface to promoter site binding and fission yeast phosphate homeostasis.
MATERIALS AND METHODS
Pho7 DNA-binding domain.
We constructed pET28b-His10Smt3-Pho7-DBD plasmids for expression of wild-type or mutated Pho7 DNA-binding domains fused to an N-terminal His10Smt3 module. The plasmids were transformed into Escherichia coli BL21(DE3) cells. The procedures for protein production and purification from soluble bacterial lysates by sequential Ni-affinity chromatography, tag cleavage, tag removal via Ni affinity, and gel filtration steps were as described previously (6). Protein concentrations were determined as described previously (6).
Crystallization, diffraction data collection, and structure determination.
Equimolar concentrations of high-performance liquid chromatography-purified 20-mer DNA oligonucleotides 5′-TTATTCGGAAATTAAAAACA and 5′-GTTTTTAATTTCCGAATAAT (from Integrated DNA Technologies) were annealed by heating for 10 min at 95°C and slow cooling to room temperature. A protein-DNA mixture containing 0.9 mM Pho7-(279–339), 0.45 mM duplex DNA, 45 mM Tris-HCl, pH 7.4, 182 mM NaCl, and 9% glycerol was prepared and incubated at room temperature for 10 min. An aliquot (1 μl) of the protein-DNA solution was then mixed with an equal volume of precipitant solution containing 100 mM Tris-HCl, pH 8.0, 0.2 M sodium acetate, 35% polyethylene glycol 4000. Crystals were grown at room temperature by hanging-drop vapor diffusion against the precipitant solution. The crystals were harvested and directly flash-frozen in liquid nitrogen. X-ray diffraction data were collected from a single crystal at Advanced Photon Source beamline 24ID-C. The data were integrated with the HKL2000 package (14). Phases were obtained in the Phenix system (15) by molecular replacement using the structure of the Pho7-DBD complex with tgp1 promoter DNA (PDB accession number 6E33) as the search model. Iterative model building into electron density was performed with the program O (16). Refinement was accomplished with Phenix (15). Data collection and refinement statistics are presented in Table 1.
Allelic exchange of pho7-Ala mutants at the pho7 locus.
Replacement of the native pho7 locus with a pho7-WT-TAP or pho7-mut-TAP allele was performed as described previously (6). Correct insertions were verified by Southern blotting and sequencing of PCR-amplified DNA segments to ascertain the presence of the desired allele. To gauge the effect of these mutations on vegetative growth, cultures of S. pombe strains containing the indicated pho7-TAP allele were grown in liquid medium until the A600 reached 0.6 to 0.9. The cultures were adjusted to a final A600 of 0.1, and aliquots (3 μl) of serial 5-fold dilutions were spotted on YES agar plates, which were then incubated at 20°C, 25°C, 30°C, 34°C, and 37°C. To gauge the expression of the Pho7 and Pho7-Ala proteins, we performed Western blotting of whole-cell extracts of the pho7Δ and pho7-TAP strains grown to mid-log phase in YES medium at 30°C, using a rabbit polyclonal antibody recognizing the TAP tag (catalog number P1291; Sigma) and rabbit polyclonal anti-Spt5 antibody (17) as a loading control. The procedures for extract preparation and immunoblotting were described previously (6).
Acid phosphatase assay of Pho1 expression.
Aliquots of exponentially growing S. pombe cultures grown in yeast extract with supplements (YES) medium at 30°C were harvested by centrifugation, and the cells were washed with water and suspended in water. For phosphate starvation experiments, the cells were harvested, washed in water, adjusted to an A600 of ∼0.15 in pombe minimal glutamate (PMG) medium without phosphate, and then incubated at 30°C for 5 h. To quantify Pho1 acid phosphatase activity, reaction mixtures (200 μl) containing 100 mM sodium acetate (pH 4.2), 10 mM p-nitrophenylphosphate, and cells (0.01 to 0.1 A600 unit) were incubated for 5 min at 30°C. The reactions were quenched by adding 1 ml of 1 M sodium carbonate, the cells were removed by centrifugation, and the absorbance of the supernatant at 410 nm was measured. Acid phosphatase activity is expressed as the ratio of the A410 (p-nitrophenol production) to the A600 (cells). Each datum is the average ± standard error of the mean (SEM) from at least three phosphatase assays using cells from three independent cultures.
RNA analysis.
Fission yeast cells grown in YES medium at 30°C to an A600 of 0.5 to 0.8 were harvested, washed with water, and then transferred to PMG medium without phosphate to attain an A600 of 0.3. The cells were incubated in PMG (without PO4) medium for 5 h at 30°C. Total RNA was then extracted from 10 A600 units of phosphate-starved cells via the hot phenol method (18). For analysis of specific transcripts by primer extension, 20 μg of total RNA was used as the template for Moloney murine leukemia virus reverse transcriptase-catalyzed extension of 5′ 32P-labeled oligodeoxynucleotide primers complementary to the pho1 or act1 mRNAs. The primer extension reactions were performed as described previously (19), and the products were analyzed by electrophoresis of the reaction mixtures through a 22-cm 8% polyacrylamide gel containing 7 M urea in 80 mM Tris-borate, 1.2 mM EDTA. The 32P-labeled primer extension products were visualized by autoradiography of the dried gel. The primer sequences were as follows: for act1, 5′-GATTTCTTCTTCCATGGTCTTGTC, and for pho1, 5′-GTTGGCACAAACGACGGCC.
DNA binding by EMSA.
32P-labeled DNA oligonucleotides (prepared with [γ-32P]ATP and T4 polynucleotide kinase) were annealed to a 2-fold molar excess of a complementary nonlabeled DNA oligonucleotide by heating for 10 min at 95°C, followed by slow cooling to 25°C. The radiolabeled DNA duplexes were purified by electrophoresis through a native 12% polyacrylamide gel in 0.25× TBE (22 mM Tris-borate, pH 8.3, 0.5 mM EDTA). The labeled DNA was eluted from an excised gel slice, ethanol precipitated, and resuspended in 10 mM Tris-HCl, pH 7.4, 1 mM EDTA. EMSA reaction mixtures (10 μl) containing 50 mM Tris-HCl, pH 7.4, 10% glycerol, 340 ng poly(dI-dC) (Sigma), 0.25 pmol 32P-labeled pho1 site 1 or site 2 DNA or 0.5 pmol tgp1 site DNA, 50 mM NaCl (for pho1 DNAs) or 200 mM NaCl (for tgp1 DNA), and 2 μl of wild-type or mutant Pho7-(279–368) (serially diluted in buffer containing 50 mM Tris-HCl, pH 7.4, 250 mM NaCl, 10% glycerol, 0.1% Triton X-100 to attain the nanogram amounts specified in the figures) were incubated for 10 min at 22°C. The mixtures were analyzed by electrophoresis through a native 6% polyacrylamide gel containing 2.5% (vol/vol) glycerol in 0.25× TBE buffer (for pho1 DNAs) or 1× TBE buffer (for tgp1 DNA). The extent of DNA binding to Pho7 (as a percentage of the total amount of labeled DNA in the sample) was determined by scanning the dried gel with a phosphorimager and analyzing the data in ImageQuant software.
Accession number(s).
Coordinates and structure factors have been deposited in the Protein Data Bank under accession number 6O19.
ACKNOWLEDGMENTS
This research was supported by NIH grants R35-GM126945 (to S.S.) and R01-GM52470 (to B.S.). The MSKCC structural biology core laboratory is supported by National Cancer Institute grant P30-CA008748. X-ray diffraction data were collected at synchrotron facilities supported by grants and contracts from the National Institutes of Health (P41GM103403, HEI-S10RR029205) and the U.S. Department of Energy (DE-AC02-06CH11357).
The funders had no role in study design, data collection and interpretation, or the decision to submit the work for publication.
We declare that we have no conflicts of interest with the contents of this article.
REFERENCES
- 1.MacPherson S, Larochelle M, Turcotte B. 2006. A fungal family of transcriptional regulators: the zinc cluster proteins. Microbiol Mol Biol Rev 70:583–604. doi: 10.1128/MMBR.00015-06. [DOI] [PMC free article] [PubMed] [Google Scholar]
- 2.Garg A, Goldgur Y, Schwer B, Shuman S. 2018. Distinctive structural basis for DNA recognition by the fission yeast Zn2Cys6 transcription factor Pho7 and its role in phosphate homeostasis. Nucleic Acids Res 46:11262–11273. doi: 10.1093/nar/gky827. [DOI] [PMC free article] [PubMed] [Google Scholar]
- 3.Carter-O’Connell I, Peel MT, Wykoff DD, O’Shea EK. 2012. Genome-wide characterization of the phosphate starvation response in Schizosaccharomyces pombe. BMC Genomics 13:697. doi: 10.1186/1471-2164-13-697. [DOI] [PMC free article] [PubMed] [Google Scholar]
- 4.Henry TC, Power JE, Kerwin CL, Mohammed A, Weissman JS, Cameron DM, Wykoff DD. 2011. Systematic screen of Schizosaccharomyces pombe deletion collection uncovers parallel evolution of the phosphate signal pathways in yeasts. Eukaryot Cell 10:198–206. doi: 10.1128/EC.00216-10. [DOI] [PMC free article] [PubMed] [Google Scholar]
- 5.Schwer B, Sanchez A, Shuman S. 2015. RNA polymerase II CTD phospho-sites Ser5 and Ser7 govern phosphate homeostasis in fission yeast. RNA 21:1770–1780. doi: 10.1261/rna.052555.115. [DOI] [PMC free article] [PubMed] [Google Scholar]
- 6.Schwer B, Sanchez AM, Garg A, Chatterjee D, Shuman S. 2017. Defining the DNA binding site recognized by the fission yeast Zn2Cys6 transcription factor Pho7 and its role in phosphate homeostasis. mBio 8:e01218-17. doi: 10.1128/mBio.01218-17. [DOI] [PMC free article] [PubMed] [Google Scholar]
- 7.Marmorstein R, Carey M, Ptashne M, Harrison SC. 1992. DNA recognition by GAL4: structure of a protein-DNA complex. Nature 356:408–414. doi: 10.1038/356408a0. [DOI] [PubMed] [Google Scholar]
- 8.Hong M, Fitzgerald MX, Harper S, Luo C, Speicher DW, Marmorstein R. 2008. Structural basis for dimerization in DNA recognition by Gal4. Structure 16:1019–1026. doi: 10.1016/j.str.2008.03.015. [DOI] [PMC free article] [PubMed] [Google Scholar]
- 9.Marmorstein R, Harrison SC. 1994. Crystal structure of a PPR1-DNA complex: DNA recognition by proteins containing a Zn2Cys6 binuclear cluster. Genes Dev 8:2504–2512. doi: 10.1101/gad.8.20.2504. [DOI] [PubMed] [Google Scholar]
- 10.Swaminathan K, Flynn P, Reece RJ, Marmorstein R. 1997. Crystal structure of a PUT3-DNA complex reveals a novel mechanism for DNA recognition by a protein containing a Zn2Cys6 binuclear cluster. Nat Struct Biol 4:751–759. doi: 10.1038/nsb0997-751. [DOI] [PubMed] [Google Scholar]
- 11.King DA, Zhang L, Guarente L, Marmorstein R. 1999. Structure of a HAP1-DNA complex reveals dramatically asymmetric DNA binding by a homodimeric protein. Nat Struct Biol 6:64–71. doi: 10.1038/4940. [DOI] [PubMed] [Google Scholar]
- 12.Fitzgerald MX, Rojas JR, Kim JM, Kohlhaw GB, Marmorstein R. 2006. Structure of a Leu3-DNA complex: recognition of everted CGG half-sites by a Zn2Cys6 binuclear cluster protein. Structure 14:725–735. doi: 10.1016/j.str.2005.11.025. [DOI] [PubMed] [Google Scholar]
- 13.Cahuzac B, Cerdan R, Felenbok B, Guittet E. 2001. The solution structure of an AlcR-DNA complex sheds light onto the unique tight and monomeric DNA binding of a Zn2Cys6 protein. Structure 9:827–836. doi: 10.1016/S0969-2126(01)00640-2. [DOI] [PubMed] [Google Scholar]
- 14.Otwinowski Z, Minor W. 1997. Processing of X-ray diffraction data collected in oscillation mode. Methods Enzymol 276:307–326. doi: 10.1016/S0076-6879(97)76066-X. [DOI] [PubMed] [Google Scholar]
- 15.Adams PD, Afonine PV, Bunkóczi G, Chen VB, Davis IW, Echols N, Headd JJ, Hung LW, Kapral GJ, Grosse-Kunstleve RW, McCoy AJ, Moriarty NW, Oeffner R, Read RJ, Richardson DC, Richardson JS, Terwilliger TC, Zwart PH. 2010. PHENIX: a comprehensive Python-based system for macromolecular structure solution. Acta Crystallogr D Biol Crystallogr 66:213–221. doi: 10.1107/S0907444909052925. [DOI] [PMC free article] [PubMed] [Google Scholar]
- 16.Jones TA, Zou JY, Cowan SW, Kjeldgaard M. 1991. Improved methods for building protein models in electron density maps and the location of errors in these models. Acta Crystallogr A 47(Pt 2):110–119. doi: 10.1107/S0108767390010224. [DOI] [PubMed] [Google Scholar]
- 17.Schwer B, Schneider S, Pei Y, Aronova A, Shuman S. 2009. Characterization of the Schizosaccharomyces pombe Spt5-Spt4 complex. RNA 15:1241–1250. doi: 10.1261/rna.1572709. [DOI] [PMC free article] [PubMed] [Google Scholar]
- 18.Herrick D, Parker R, Jacobson A. 1990. Identification and comparison of stable and unstable RNAs in Saccharomyces cerevisiae. Mol Cell Biol 10:2269–2284. doi: 10.1128/MCB.10.5.2269. [DOI] [PMC free article] [PubMed] [Google Scholar]
- 19.Schwer B, Mao X, Shuman S. 1998. Accelerated mRNA decay in conditional mutants of yeast mRNA capping enzyme. Nucleic Acids Res 26:2050–2057. doi: 10.1093/nar/26.9.2050. [DOI] [PMC free article] [PubMed] [Google Scholar]