The intestinal microbiota, a conglomerate of microorganisms comprising bacteria, viruses, archaea and fungi, has been recognised as an important component of host physiology through, for example, its influence on nutritional biotransformation, immune response and xenobiotic metabolism.1 These functions are performed via a complexed and multilayer set of controls coming from within the microbial community as well as host factors. Consequently, this intricate microbiota–host partnership is viewed as an essential element of health. For example, intestinal bacterial, fungal and viral composition is different in patients with IBDs and colorectal cancer compared with healthy subjects.2–4 A number of investigative lines probing the impact of microbiota in disease initiation, progression and therapeutics are currently underway. The microbial therapeutic field is particularly dynamic, in part due to the impressive success of faecal microbiota transplantation (FMT) for treatment of recurrent Clostridium difficile infection.5 Whether FMT or derivative synthetic cocktail could be applied to other disease conditions is unclear, and a number of clinical trials for the treatment of metabolic syndrome, diabetes and IBD are currently underway to address this question.
The field of cancer has been particularly attentive to the interaction between bacteria and therapeutics.6 7 This impact of bacteria on therapeutics is wide and includes modulation of chemotherapeutic and immunotherapeutic agents’ efficacy and toxicity via metabolic and immune-mediated mechanisms.8–11 In particular, the recent discovery that intestinal microbiota profoundly impacts responses of patients with cancer to immune checkpoint blockade therapy (Routy et al,12 Gopalakrishnan et al 13 and Matson et al 14) has attracted much attention. In these studies, the authors used an antibody targeting the coinhibitory receptor/ligand system programmed death-1 (PD-1)/PDL-1 administered to patients with metastatic melanoma13 14 or non-small cell lung cancer and renal cell carcinoma.12 The overall hypothesis pursued by these research teams was that heterogeneous and transient patients’ responses to immune checkpoint therapies are in part due to intestinal microbiota. In their study of response of patient with metastatic melanoma to anti-PD-1 therapy, Gopalakrishnan et al found higher relative abundance of Faecalibacterium prausnitzii in responding (R) compared with non-responding (NR) patients. Interestingly, using a different cohort of patients with metastatic melanoma, Matson et al found that responsiveness to PD-1 therapy is defined by an increased abundance of a group of eight species driven by Bifidobacterium longum.
In the case of non-small cell lung cancer, Routy et al observed increased relative abundance of Akkermansia muciniphila in PD-1 R compared to NR. Importantly, FMT in mice carrying tumours displayed improved response to anti-PDL-1 therapy when faeces originated from R compared to NR patients, suggesting a functional impact of microbiota in therapeutic responses. Therefore, microbial composition may possess predictive clinical value for immune checkpoint blockade therapy such as PD-1. More importantly, these findings suggest that altering microbial composition could represent a therapeutic avenue for cancer management. Although the mechanism by which microbiota synergises with PD-1 therapy to enhance therapeutic efficacy is still unclear and likely involved improved tumour immune environment,15 an intriguing observation from these three studies is the lack of consensus microbial signals associated with PD-1 response. Indeed, each of the research teams identified different bacterial signals (Akkermansia, Faecalibacterium and Bifidobacterium) associated with PD-1 responses, a divergence that could be related to a number of confounding factors such as sampling method/storage, DNA extraction, geographical differences, sequencing technology and analytical pipelines used by the teams. Alternatively, these microbial signals are intrinsic to each cohort but functionally related, which would suggest that function and not specific species better defines therapeutic efficacy.
Among all confounding factors mentioned above, the analytical pipeline is the most straightforward one to address. Therefore, the sequencing data for the three studies were obtained and reanalysed using QIIME V.1.9.116 for the 16S data and MetaPhlAn217 for the metagenome shotgun sequencing data. Linear discriminant analysis effect size (LEfSe)18 was then used to identify biomarkers associated with R and NR. Using this common approach, a significant (p<0.05) difference in beta diversity (weighted UniFrac) between R and NR in Gopalakrishnan et al and Matson et al (no 16S data were generated by Routy et al) was detected. In the case of alpha diversity (Chao1), only Gopalakrishnan et al’s data showed significant difference (p<0.05), with R having higher diversity than NR. However, when both data sets were combined, the difference in alpha but not beta diversity between R and NR was lost. At the taxa level, our approach was able to reproduce Gopalakrishnan et al’s results but failed to detect Bifidobacterium in Matson et al’s data set using LEfSe. It is worth mentioning that using Matson et al’s approach (non-parametric t-test), Bifidobacterium was among the top significantly (uncorrected p<0.05) enriched taxa in R.
The metagenome shotgun sequencing data, on the other hand, did not show any significant differences in microbial community structure between R and NR in all three studies whether analysed separately or combined. LEfSe analysis using MetaPhlAn2 species level profiles confirmed only Routy et al’s results. Interestingly, after combining all three data sets, LEfSe detected the enrichment of A. muciniphila and Ruminococcus champanellensis in R.
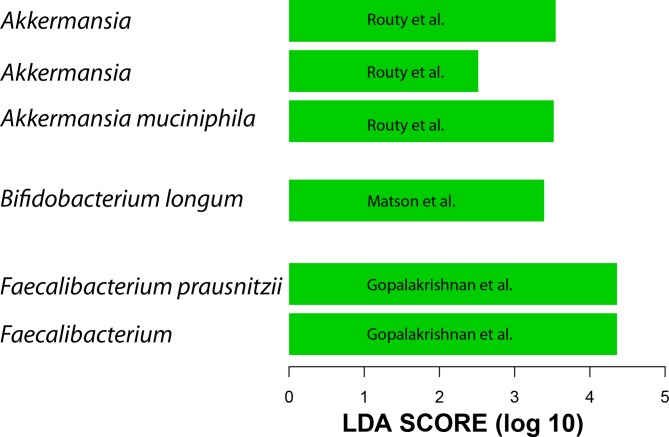
Given the above results and the lack of 16S data from all three studies, the metagenome shotgun sequencing data were used to generate QIIME closed-reference operational taxonomic units (OTUs) at 97% similarity to the greengenes reference data set.19 20 We did not include data from patients with renal cell carcinoma because these clustered differently than metastatic melanoma and non-small cell lung cancer (data not shown). A difference between R and NR was detected only in Gopalakrishnan et al’s data at the beta diversity level, however, this difference is lost when data from the three data sets are combined. When taxa enriched in R were examined, the same taxa reported by the three groups to be associated with R were found to be present only when each data set was analysed separately (figure 1). When all three data sets were combined, the gut microbiota of R showed enrichment of A. muciniphila and R. bromii but not Faecalibacterium or Bifidobacterium. Therefore, processing all data through the same pipeline confirmed the existence of a unique microbial 16S rDNA signal associated with each study.
Figure 1.
Linear discriminant analysis (LDA) scores (generated by linear discriminant analysis effect size (LEfSe)) computed from QIIME closed-reference operational taxonomic units (OTUs) at 97% similarity to the greengenes reference using the metagenome shotgun sequencing data show differentially abundant taxa in the gut microbiota of patients who responded to programmed death-1 (PD-1) treatment. Shown taxa have p value <0.05 and LDA score >2. Each bar represents a different OTU.
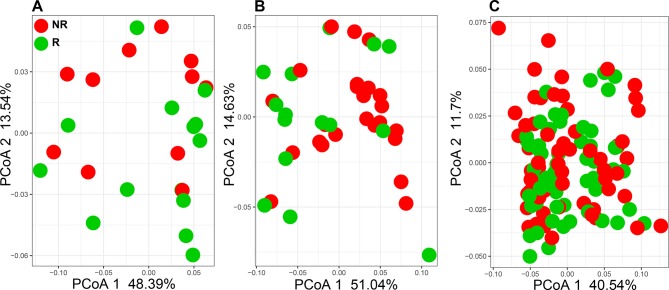
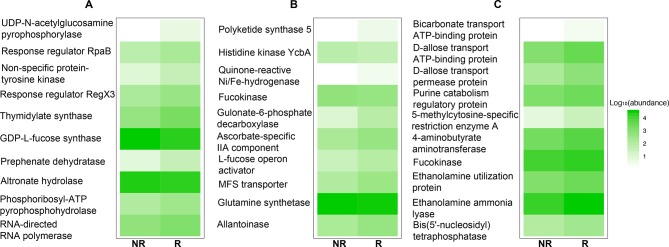
Despite the divergence in 16S rDNA signals between studies, PD-1 responsiveness may be related to a common functionality from these disparate microorganisms. Therefore, the functional content of those samples was examined by aligning metagenome shotgun sequencing reads using Diamond aligner 21 to a local copy of KEGG bacterial orthologues22 Interestingly, using this approach a significant (p<0.05) difference was detected at the beta diversity (Bray-Curtis dissimilarity) level between R and NR in both Gopalakrishnan et al and Matson et al’s data but not in Routy et al’s data (figure 2A–C). This separation between R and NR is lost when all data from different data sets are combined. When KEGG orthologue differential abundances (p<0.05) between R and NR were examined, Matson et al’s data set produced the highest number (869 orthologues), followed by Gopalakrishnan et al’s (653 orthologues) data set and last by Routy et al’s (108 orthologues) data set. A representative set of those orthologues is shown in figure 3, where the top 10 differentially abundant orthologues between R and NR from each data set are plotted (figure 3A–C).
Figure 2.
Principle coordinate analysis (PCoA) using Bray-Curtis dissimilarity generated from KEGG orthologue profiles. (A) Gopalakrishnan et al 13 (PERMANOVA p=0.04, PCoA 2 p=0.02). (B) Matson et al 14 (PERMANOVA p=0.04, PCoA 1 p=0.04). (C) Routy et al 12 (PERMANOVA, PCoA 1 and 2: not significant). NR, non-responding; PERMANOVA, permutational multivariate analysis of variance; R, responding.
Figure 3.
KEGG orthologue relative abundances for the top 10 differentially detected orthologues between responding (R) and non-responding (NR) in (A) Gopalakrishnan et al,13 (B) Matson et al 14 and (C) Routy et al.12
Importantly, no common orthologues were observed in all three data sets but pairwise intersections showed that Gopalakrishnan et al and Matson et al share the highest number of orthologues (23 orthologues), followed by Matson et al and Routy et al (11 orthologues) and last, Gopalakrishnan et al and Routy et al (three orthologues).
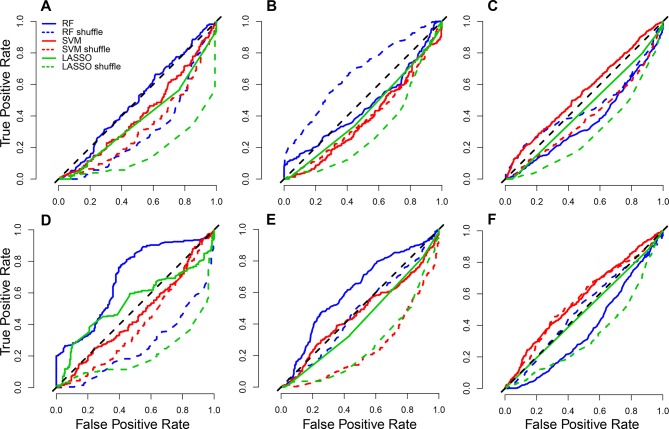
Finally, three machine learning classifiers (least absolute shrinkage and selection operator,23 random forest (RF)24 and support vector machine (SVM)25) were employed to test whether microbial signals (species or KEGG orthologues) could predict PD-1 responses using MetAML.26 The use of species-level metagenomic profiles as an input to MetAML resulted in poor performance for the three classifiers (figure 4A–C). The best performing classifier was SVM on Routy et al’s data generating an area under the curve (AUC) of 0.62 (figure 4C). Interestingly, classifiers’ performance was enhanced when KEGG orthologues were used (figure 4D–F) with RF on Gopalakrishnan et al’s data generating the highest AUC, 0.71 (figure 4D). Combining data sets did not enhance classifiers’ performance regardless of the profile used.
Figure 4.
Average receiver operating characteristic (ROC) curves (over 10 cross-validation folds) for (A) Gopalakrishnan et al,13 (B) Matson et al 14 and (C) Routy et al’s12 species-level MetaPhlAn2 profiles and (D) Gopalakrishnan et al,13 (E) Matson et al 14 and (F) Routy et al’s [12] KEGG orthologue profiles. Solid line: correct labelling for phenotype (R, NR); dotted coloured lines: shuffled labels; diagonal dotted black line: random guess. LASSO, least absolute shrinkage and selection operator; NR, non-responding; R, responding; RF, random forest; SVM, support vector machine.
Our analysis demonstrates that analytical pipelines are not responsible for the observed taxa disparity in PD-1 response between the three studies. This finding is in line with a previous report showing that analytical pipeline is not driving signal difference in microbiota analysis.27 Importantly, microbial gene content has better predictive power and overlapping signal than microbial communities’ composition. Clearly, the search for microbial signal as predictors of therapeutic response, at least from the standpoint of immune checkpoint blockade, would require deeper functional investigation, as profiling microbial composition is unlikely to bring sufficient information to untangled signal from noise. Is there a direct link between microbial functional profiling and patients’ response to immune checkpoint blockade? A deeper look at these microbial functions would necessitate analysis of microbial gene expression using RNA sequencing or metabolomics to identify potential pathways associated with treatment efficacy. However, one could not discount the possibility that microbial structures (cell surface antigens, nucleic acids, and so on)28 and not microbial metabolic activities are responsible for the synergistic interaction between bacteria, immune cells and therapeutic efficacy.
The continuous expansion of new clinical trials targeting various cancer forms would likely contribute to a better understanding of the role of microbiota in mediating efficacy of immune checkpoint inhibitors,29 pending that microbiota sampling is incorporated into these trials. Similarly, larger cohorts may be necessary in order to identify potential microbial markers defining responsiveness.
In addition, one would need to investigate microbiota relationship with cancer management beyond T cell target therapy and immune checkpoint inhibitors. For example, understanding the role of microbiota in other immuno-oncology treatment modalities such as cancer vaccine, oncolytic virus and cell-mediated therapy (chimeric antigen receptor T cell therapy) may help identify either microbiota component associated with a specific class of treatment or overlapping signal applicable to a wide spectrum of immunotherapy. Another important point regarding the link between microbiota and immune checkpoint response is the source of the signal. So far, all efforts have been directed at linking drug efficacy to bacteria, but the complexity of the microbiota may hide additional signals. As stated above, fungi and viruses are an intrinsic part of the microbiota and have been shown to impact immune response,30 31 an essential component of immunotherapy. It would be important to investigate the role of these other microorganisms in defining the interaction between microbiota and cancer therapy. In conclusion, the search for microbial signals defining the extent of cancer therapeutic response is an ongoing quest, and the next years promise to deliver exciting new paradigm for the field of cancer research.
Footnotes
Patient consent for publication: Not required.
Contributors: RZG analysed the data and generate the figures. CJ and RZG wrote the paper. CJ supervised the study.
Funding: This research was supported by the National Institutes of Health grants (R01DK073338), the Florida Academic Cancer Center Alliance (FACCA) Research pilot grant and the University of Florida, Department of Medicine Gatorade Fund to CJ. RZG is supported by UFHCC funds.
Competing interests: None declared.
Provenance and peer review: Not commissioned; internally peer reviewed.
References
- 1. Shreiner AB, Kao JY, Young VB. The gut microbiome in health and in disease. Curr Opin Gastroenterol 2015;31:69–75. 10.1097/MOG.0000000000000139 [DOI] [PMC free article] [PubMed] [Google Scholar]
- 2. Nakatsu G, Zhou H, Wu WKK, et al. Alterations in enteric virome are associated with colorectal cancer and survival outcomes. Gastroenterology 2018;155:529–41. 10.1053/j.gastro.2018.04.018 [DOI] [PubMed] [Google Scholar]
- 3. Norman JM, Handley SA, Baldridge MT, et al. Disease-specific alterations in the enteric virome in inflammatory bowel disease. Cell 2015;160:447–60. 10.1016/j.cell.2015.01.002 [DOI] [PMC free article] [PubMed] [Google Scholar]
- 4. Sokol H, Leducq V, Aschard H, et al. Fungal microbiota dysbiosis in IBD. Gut 2017;66:1039–48. 10.1136/gutjnl-2015-310746 [DOI] [PMC free article] [PubMed] [Google Scholar]
- 5. Kelly CR, Kahn S, Kashyap P, et al. Update on fecal microbiota transplantation 2015: indications, methodologies, mechanisms, and outlook. Gastroenterology 2015;149:223–37. 10.1053/j.gastro.2015.05.008 [DOI] [PMC free article] [PubMed] [Google Scholar]
- 6. Wallace BD, Wang H, Lane KT, et al. Alleviating cancer drug toxicity by inhibiting a bacterial enzyme. Science 2010;330:831–5. 10.1126/science.1191175 [DOI] [PMC free article] [PubMed] [Google Scholar]
- 7. Geller LT, Barzily-Rokni M, Danino T, et al. Potential role of intratumor bacteria in mediating tumor resistance to the chemotherapeutic drug gemcitabine. Science 2017;357:1156–60. 10.1126/science.aah5043 [DOI] [PMC free article] [PubMed] [Google Scholar]
- 8. Alexander JL, Wilson ID, Teare J, et al. Gut microbiota modulation of chemotherapy efficacy and toxicity. Nat Rev Gastroenterol Hepatol 2017;14:356–65. 10.1038/nrgastro.2017.20 [DOI] [PubMed] [Google Scholar]
- 9. Currò D. The role of gut microbiota in the modulation of drug action: a focus on some clinically significant issues. Expert Rev Clin Pharmacol 2018;11:171–83. 10.1080/17512433.2018.1414598 [DOI] [PubMed] [Google Scholar]
- 10. Koppel N, Maini Rekdal V, Balskus EP. Chemical transformation of xenobiotics by the human gut microbiota. Science 2017;356:eaag2770 10.1126/science.aag2770 [DOI] [PMC free article] [PubMed] [Google Scholar]
- 11. Routy B, Gopalakrishnan V, Daillère R, et al. The gut microbiota influences anticancer immunosurveillance and general health. Nat Rev Clin Oncol 2018;15:382–96. 10.1038/s41571-018-0006-2 [DOI] [PubMed] [Google Scholar]
- 12. Routy B, Le Chatelier E, Derosa L, et al. Gut microbiome influences efficacy of PD-1-based immunotherapy against epithelial tumors. Science 2018;359:91–7. 10.1126/science.aan3706 [DOI] [PubMed] [Google Scholar]
- 13. Gopalakrishnan V, Spencer CN, Nezi L, et al. Gut microbiome modulates response to anti-PD-1 immunotherapy in melanoma patients. Science 2018;359:97–103. 10.1126/science.aan4236 [DOI] [PMC free article] [PubMed] [Google Scholar]
- 14. Matson V, Fessler J, Bao R, et al. The commensal microbiome is associated with anti-PD-1 efficacy in metastatic melanoma patients. Science 2018;359:104–8. 10.1126/science.aao3290 [DOI] [PMC free article] [PubMed] [Google Scholar]
- 15. Zitvogel L, Ayyoub M, Routy B, et al. Microbiome and anticancer immunosurveillance. Cell 2016;165:276–87. 10.1016/j.cell.2016.03.001 [DOI] [PubMed] [Google Scholar]
- 16. Caporaso JG, Kuczynski J, Stombaugh J, et al. QIIME allows analysis of high-throughput community sequencing data. Nat Methods 2010;7:335–6. 10.1038/nmeth.f.303 [DOI] [PMC free article] [PubMed] [Google Scholar]
- 17. Truong DT, Franzosa EA, Tickle TL, et al. MetaPhlAn2 for enhanced metagenomic taxonomic profiling. Nat Methods 2015;12:902–3. 10.1038/nmeth.3589 [DOI] [PubMed] [Google Scholar]
- 18. Segata N, Izard J, Waldron L, et al. Metagenomic biomarker discovery and explanation. Genome Biol 2011;12:R60 10.1186/gb-2011-12-6-r60 [DOI] [PMC free article] [PubMed] [Google Scholar]
- 19. DeSantis TZ, Hugenholtz P, Larsen N, et al. Greengenes, a chimera-checked 16S rRNA gene database and workbench compatible with ARB. Appl Environ Microbiol 2006;72:5069–72. 10.1128/AEM.03006-05 [DOI] [PMC free article] [PubMed] [Google Scholar]
- 20. McDonald D, Price MN, Goodrich J, et al. An improved Greengenes taxonomy with explicit ranks for ecological and evolutionary analyses of bacteria and archaea. Isme J 2012;6:610–8. 10.1038/ismej.2011.139 [DOI] [PMC free article] [PubMed] [Google Scholar]
- 21. Buchfink B, Xie C, Huson DH. Fast and sensitive protein alignment using DIAMOND. Nat Methods 2015;12:59–60. 10.1038/nmeth.3176 [DOI] [PubMed] [Google Scholar]
- 22. Kanehisa M, Goto S. KEGG: kyoto encyclopedia of genes and genomes. Nucleic Acids Res 2000;28:27–30. 10.1093/nar/28.1.27 [DOI] [PMC free article] [PubMed] [Google Scholar]
- 23. Tibshirani R. Regression shrinkage and selection via the lasso. J R Stat Soc Series B, Stat Methodol 1996;58:267–88. [Google Scholar]
- 24. Tk H. Random Decision Forests. In: Proceedings of the third international conference on document analysis and recognition. Washington, DC, USA: IEEE Computer Society, 1995:278. [Google Scholar]
- 25. Cortes C, Vapnik V. Support-vector networks. Mach Learn 1995;20:273–97. 10.1007/BF00994018 [DOI] [Google Scholar]
- 26. Pasolli E, Truong DT, Malik F, et al. Machine learning meta-analysis of large metagenomic datasets: tools and biological insights. PLoS Comput Biol 2016;12:e1004977 10.1371/journal.pcbi.1004977 [DOI] [PMC free article] [PubMed] [Google Scholar]
- 27. Sinha R, Abu-Ali G, Vogtmann E, et al. Assessment of variation in microbial community amplicon sequencing by the Microbiome Quality Control (MBQC) project consortium. Nat Biotechnol 2017;35:1077–86. 10.1038/nbt.3981 [DOI] [PMC free article] [PubMed] [Google Scholar]
- 28. do Carmo FLR, Rabah H, De Oliveira Carvalho RD, et al. Extractable bacterial surface proteins in probiotic-host interaction. Front Microbiol 2018;9:645 10.3389/fmicb.2018.00645 [DOI] [PMC free article] [PubMed] [Google Scholar]
- 29. Tang J, Shalabi A, Hubbard-Lucey VM. Comprehensive analysis of the clinical immuno-oncology landscape. Ann Oncol 2018;29:84–91. 10.1093/annonc/mdx755 [DOI] [PubMed] [Google Scholar]
- 30. Underhill DM, Iliev ID. The mycobiota: interactions between commensal fungi and the host immune system. Nat Rev Immunol 2014;14:405–16. 10.1038/nri3684 [DOI] [PMC free article] [PubMed] [Google Scholar]
- 31. Neil JA, Cadwell K. The intestinal virome and immunity. J Immunol 2018;201:1615–24. 10.4049/jimmunol.1800631 [DOI] [PMC free article] [PubMed] [Google Scholar]


