

Abstract
Introduction:
Clinical evaluation of a two-dimensional (2D) liquid-filled ion chamber detector array used in the verification of highly modulated small beams of stereotactic body radiation therapy (SBRT) has been conducted.
Materials and Methods:
Measurements with the Octavius 1000 SRS (PTW, Freiburg, Germany) detector with 977 liquid-filled ion chambers were compared against EDR2 film and PTW Octavius Seven29. The performance of detector array has been evaluated on ten SBRT patient plans. Dose profiles of individual and composite fields' calculated using Pinnacle3 treatment planning system were compared against measurements with Octavius 1000 SRS detector array, EDR2 film, and Octavius Seven29 detector. Gamma index and profile comparison were used in the evaluation and assessment of the detector's performance.
Results:
The Gamma index measurements show agreement between Pinnacle3 computations and Octavius 1000 SRS array, PTW Octavius Seven29, and EDR2 film for >90% of the points using 2%, 2 mm tolerance criteria. Profiles obtained with the Octavius 1000 SRS were in agreement with the EDR2 film profiles, demonstrating the detector's superior sampling rate.
Conclusions:
The Octavius 1000 SRS is a dosimetrically accurate device to perform quality assurance checks in SBRT treatments. The broad range of measurements performed in this study quantified the dosimetric accuracy of Octavius 1000 SRS detector in the clinical setup of the small fields in radiotherapy.
Keywords: High-density dosimeter, ion chamber, liquid-filled ion chamber, quality assurance, stereotactic body radiation therapy quality assurance
INTRODUCTION
Stereotactic body radiation therapy (SBRT) technique is being used routinely, often in combination with intensity-modulated radiotherapy (IMRT). In this context, SBRT uses very small-sized field to deliver a large radiation dose with steep dose gradient, necessitating dose calculations involving small field dosimetry. Higher doses with smaller fields introduce more uncertainty into modeling in the treatment planning system (TPS), treatment planning calculations, patient-specific quality assurance (QA) measurements, and treatment delivery. Therefore, to perform treatments, which will not damage the healthy tissues surrounding the target and achieve reliable dose delivery to the target volume, spatial, and dosimetric accuracy of the delivered dose distribution is required. A number of studies[1,2,3,4] have pointed out the use of small fields for precisely targeting of treatment volumes have clinical advantages but bears many challenges that need to be addressed.[5]
QA and verification of the delivered dose[6,7,8,9] for such complex treatments are necessary. Several reports[10,11,12] have recommended implementation protocols for radiotherapy treatment planning as well as specific software tools and measurement devices for clinical verification of patient-specific IMRT QA.[13,14,15] The small field measurements require precise and accurate placement of the detector at the center of the field and depth of interest, failing which may lead to measurement error due to placement uncertainties.[16] A high sampling frequency necessitates closer placement and smaller detector volume, both of which have the Nyquist frequency limitations. The sensitivity of an ion chamber depends on the density of the active media and for a liquid-filled chamber and it is up to three orders of magnitude higher than that of an air-filled ion chamber of the same sensitive volume. This led to a significant reduction in detector volume and allows closer placement of ion chambers for higher sampling frequency. Catano et al.[17] investigated a liquid-filled ionization chamber for high-precision relative dosimetry and showed its ability to perform profile measurements and penumbrae determination with excellent accuracy. Pardo et al.[18] investigated the verification of intensity-modulated profiles using a pixel segmented liquid-filled ion chamber linear array and concluded that good repeatability, small pixel size, and high spatial resolution make the detector ideal for profile verification of high-gradient beams utilized in IMRT and SBRT. Pena et al.[19] investigated the temperature dependence of the liquid-filled ionization chamber and Mosquera et al.[20] investigated that the ionic recombination and free-ion yield observed in liquid-filled isooctane.
QA of volumetric modulated arc therapy plan formulates the necessity to study the angular dependence of the detector array. The changes in the beam direction intercepting the detector plane characterize the angular dependence of the detector. It is observed that the array measurements underestimate the dose on the beam axis for the open field half-arc deliveries.[21] The angular dependence of the single detector at the center of the Octavius 1000 detector array has been investigated.[22] To determine the correction factors for the single detector as well as for the array of detectors is a complex process. The development of the PTW Octavius 4D phantom that comes with an inclinometer (attachable to the gantry) minimizes the need for angular dependence correction since during the delivery two-dimensional (2D) array is always perpendicular to the beam axis. For the verification of high-gradient beam profiles, volume effect[22] of the detectors is an important characteristic for the accurate representation of the measured dose profiles.
The present investigation evaluates a 2D liquid-filled ion chamber detector array for planar dose measurements of clinical radiation beams. The detector array has a limited field size with high-spatial resolution suitable for small field dosimetry and can find a utility in patient-specific QA of SBRT targets. Gamma analysis of the measured data against TPS calculation has been reported but may lack sensitivity in highly-modulated fields. In addition to gamma analysis, beam profiles have been displayed.
MATERIALS AND METHODS
The dosimetric characteristics of the 2D liquid-filled ion chamber detector array Octavius 1000 SRS (PTW, Freiburg, Germany) are investigated in this study. The 2D detector array consists of 977 liquid-filled ionization chambers arranged in a square plane and span over an area of 11 cm × 11 cm. Each detector has a size of 2.3 mm × 2.3 mm × 0.5 mm (volume = 2.65 mm3). In the inner high-resolution area of 5.5 cm × 5.5 cm2, the center-to-center spacing of the detectors is 2.5 mm, whereas the center-to-center spacing of the detectors in the outer area is 5 mm.
The linear dimensions of the 2D Octavius 1000 SRS are 30 cm width × 42 cm depth × 2.2 cm height and weight approximately 5.4 kg. According to the manufacturer, the reference point is located 9 mm below the surface of the array. The device is able to measure absorbed dose and absorbed dose rate to water. A correction factor for daily output variation of the linac was performed by measuring the dose with an ADCL calibrated air field ionization chamber and the detector array under the same conditions. The Octavius 1000 SRS uses PTW's VeriSoft software ver 5.1 (PTW, Freiburg, Germany) for measurement acquisition and data analysis which includes profile comparison (horizontal, vertical, and diagonal), planar isodose overlay, and gamma index calculation.
PTW's 2D-Array Seven29 vented ion chamber array used for comparison consists of 729 vented ionization chambers uniformly arranged over an area of 27 cm × 27 cm. The vented plane-parallel ion chambers are cube-shaped (5 mm × 5 mm × 5 mm), and the center-to-center spacing is 10 mm. The array has 2.2-cm thickness, and chambers are surrounded by acrylic. The VeriSoft software, the same version used with Octavius 1000 SRS, controls the detector. An on-site correction factor for the quality of the beam and daily output variation of the linac was measured under the same conditions as described above and applied during measurements.
Kodak EDR2 film (Carestream Health, Rochester, NY) was used for comparison in this study due to its high spatial resolution. The films were calibrated before each comparison to obtain delivered dose using a series of film exposures at known doses. The optical density for each dose level was then used to create a calibration curve which was applied to convert the film measurements to delivered dose.
A Novalis Radiosurgery platform (Brainlab AG, Feldkirchen, Germany) linear accelerator equipped with 120 high definition multi-leaf collimator (HD-MLC) was used in all the measurements of this study using 6 MV photon beams.
Patient selection
Ten most-recent SBRT patient plans were used for all measurements in this study. All the plans were optimized using the Pinnacle3 (Philips, Madison, WI) TPS. Each plan was optimized to deliver the dose to the target using eight to eleven static IMRT fields. The treatment site, dose, and field statistics are shown in Table 1. After the optimization and approval of each plan, the dose distributions of each field and the composite dose distribution from the summation of all the beams was calculated on the CT image set of the phantom. Phantom irradiation was performed as displayed in Figures 1 and 2.
Table 1.
The number of fields, segments and monitor units for examined treatment sites
| Patient number | ||||||||||
|---|---|---|---|---|---|---|---|---|---|---|
| 1 | 5 | 7 | 10 | 2 | 3 | 6 | 8 | 4 | 9 | |
| Treatment site | Liver | Liver | Liver | Liver | Lung | Lung | Lung | Lung | Spine | Pancreas |
| Dose per fraction (Gy) | 15 | 3 | 3 | 3 | 10 | 10 | 7.5 | 10 | 4 | 6.6 |
| Number of fields | 9 | 8 | 8 | 8 | 8 | 8 | 8 | 9 | 11 | 8 |
| Number of segments (per fraction) | 270 | 234 | 180 | 180 | 146 | 168 | 110 | 152 | 130 | 160 |
| Number of monitor units (per fraction) | 4322 | 864 | 456 | 414 | 2840 | 2432 | 1784 | 1983 | 1085 | 2083 |
| Minimum field size (cm2 equivalent) | 6.3 | 11.5 | 6.7 | 6.8 | 4.7 | 6.6 | 5.2 | 5.5 | 4.9 | 6.2 |
| Maximum field size (cm2 equivalent) | 8.1 | 12 | 8 | 8.2 | 5.2 | 7.1 | 6.9 | 5.9 | 6.5 | 7 |
Figure 1.

(a) The standard setup used for Octavius 1000 SRS measurements with the detector array placed between two slabs of plastic water. The source to surface distance is 95 cm and the effective point of measurement is set at 100 cm from the radiation source. (b) Experimental setup for the measurements using an EDR2 film. A 5 cm plastic water phantom is placed on top of the EDR2 film such that the point of measurement is set at 100 cm from the radiation source. The plastic water slab used for backscatter has a 5-cm thickness
Figure 2.

(a): The setup that was used for the measurements that were acquired using Octavius 1000 SRS array and Octavius phantom. The detector array is placed in the Octavius phantom at a source to surface distance of 84 cm and the effective point of measurement is set at 100 cm from the radiation source. (b) Experimental setup for the measurements using an EDR2 film placed in the Octavius phantom. The point of measurement is set to be at 100 cm from the radiation source
Phantom setup
One set of measurements was conducted for the dose profiles comparison of the Octavius 1000 SRS detector array resolution with EDR2 film. Figure 1a shows the setup of the Octavius 1000 SRS used throughout the first set of measurements. Plastic Water Phantom material (CNMC, Nashville, TN) was used for the buildup and backscatter of radiation. The plastic water slabs used are plates of a 30 cm × 30 cm surface size, of various thicknesses, with a density of 1.03 g/cm3. The thickness of the buildup slab was 4.1 cm, and the thickness of the backscatter slab was 5 cm. The source to surface distance for the measurement setup was 95 cm such that the reference point of measurement of the Octavius 1000 SRS was set to be at source to detector distance (SDD) of 100 cm. Results from the individual fields measured using the Octavius 1000 SRS detector was compared with EDR2 film measurements performed at 100 cm SDD [Figure 1b].
The second set of measurements was performed for the comparison of the dose profiles while changing the buildup thickness. The octagon-shaped Octavius solid-body phantom demonstrates change in sensitivity with depth[23] when using different buildup thickness during measurement. As shown in Figure 2a and b, Octavius 1000 SRS, Octavius Seven29 arrays and EDR2 film were irradiated using PTW's Octavius phantom such that SDD was 100 cm using 15 cm buildup. The Octavius 1000 SRS and Seven29 detector profiles were compared against EDR2 film profiles. The Octavius phantom (PTW, Freiburg, Germany) is made of polystyrene (density of 1.04 g/cm3) which acts as both buildup and backscatter material. A similar, energy-dependent correction factor for Seven29 was measured and applied to each measurement.
Finally, patient-specific IMRT QA measurements were carried out to compare the treatment planning calculated planar composite doses of each plan against measurements with the Octavius 1000 SRS, the EDR2 film and the Octavius Seven29 using the Octavius phantom setup as shown in Figure 2.
Gamma analysis
For dosimetric comparison, gamma analysis was performed on planar dose profile using two sets of criteria: 2% dose difference (DD), 2 mm distance-to-agreement (DTA) and 3% DD, 3% DTA. A dose threshold of 10% of the global maximum measured dose was applied to discard contribution of low dose region in the analysis.
Statistical analysis
Pairwise correlation coefficient and statistically significant differences were ascertained among the various measured, and TPS computed data using STATA R9 (College Station, TX, USA). Normality of the data was tested using the Shapiro–Wilk test using threshold of 0.05. For normally distributed data, Student's t-test was applied, and the Wilcoxon signed-rank test was employed otherwise.
RESULTS
Figure 3 shows the results of measurements for the several fields used for comparison between Octavius 1000 SRS array and EDR2 film using the setup shown in Figure 1. The number of monitor units delivered per field ranged from 405 (lung plan) to 528 (liver plan) while the number of segments per fraction ranged from 8 to 20, respectively. The agreement between the Octavius 1000 SRS and EDR2 film-measured profiles for high- and low-modulated fields with the gamma index ranging from 91% to 95% for all measured fields based on 2% DD, 2-mm DTA and higher than 95% for 3% DD, 3-mm DTA criteria. The Octavius 1000 SRS data follow closely the film-measured profiles.
Figure 3.

Comparison of the profiles measured in Octavius 1000 SRS and EDR2 film for a single field exposure using setup outlined in Figure 1 with a 5 cm slab phantom (left column). The gamma analysis results calculated with 3% and 3 mm tolerances (middle column) and 2% and 2 mm (right column) are also shown
Figure 4 shows the results of the comparisons for several fields between Octavius 1000 SRS, Octavius Seven29 and EDR2 film using the setup shown in Figure 2 for single field analysis. The respective comparison of the profiles measured with Octavius Seven29 and film illustrate the advantage of the high spatial resolution and sampling capabilities of the Octavius 1000 SRS. Using the Octavius Seven29 the gamma index ranged between 91% and 100% for all measured fields using the 3%, 3 mm criteria. It is apparent that due to the limited number of points of the Octavius Seven29, the spatial information of the dose profile were lower. Highly-modulated regions serve as good examples of the importance of high-resolution detectors for an accurate and meaningful representation of such modulated fields.
Figure 4.

Comparison of profiles measured using Octavius 1000 SRS, Octavius Seven29 and EDR2 film for a single field exposure based on setup shown in Figure 2 using the Octavius phantom (left). The gamma analysis results between the Octavius SRS 1000 and Seven29 against the EDR2 film measurements were calculated using tolerances of 3% and 3 mm (middle) and 2% and 2 mm (right)
The measured planar doses of the composite plan were finally compared [results of several fields are shown in Figure 5] between Octavius 1000 SRS, Octavius Seven29, and EDR2 film using the setup shown in Figure 2. The number of monitor units delivered per fraction ranged from 456 to 4322, and the number of segments ranged from 110 to 270. The agreement between the Octavius 1000 SRS and the film-measured profiles using the gamma index was between 93% and 100% for all measured fields (using 3% and 3 mm criteria).
Figure 5.

Comparison of the measured profiles of Octavius 1000 SRS, Octavius Seven29 and EDR2 film for the composite field exposure based on setup in Figure 2 using the Octavius phantom (left). The gamma factors between the Octavius SRS 1000 and Seven29 against the EDR2 film were calculated using tolerances of 3% and 3 mm (middle) and 2% and 2 mm (right)
Table 2 tabulates results from gamma comparison of the Octavius 1000 SRS with EDR2 film, treatment plan, and Seven29 measurements. The measurements were performed at depths of 5 and 15 cm, as outlined in Figures 1 and 2, respectively. The Octavius 1000 SRS data matched well with the film-measured profiles exhibiting once again the accuracy of the detector and its ability to capture the steep dose variation for highly-modulated fields, especially when contrasted to the Octavius Seven29.
Table 2.
Results of gamma analysis of composite dose of the 10 patient plans measured with Octavius 1000 SRS, EDR2 film, Seven29 for comparison against Pinnacle3 calculated data
| Patient number | ||||||||||
|---|---|---|---|---|---|---|---|---|---|---|
| 1 | 2 | 3 | 4 | 5 | 6 | 7 | 8 | 9 | 10 | |
| 1000 SRS versus film, 5 cm depth (3%, 3 mm) | 96.6 | 99.2 | 95.4 | 100 | 97.7 | 97.1 | 97.4 | 98.2 | 96.6 | 98 |
| 1000 SRS versus film, 5 cm depth (2%, 2 mm) | 94.2 | 96.9 | 92.2 | 92.1 | 96.1 | 95.6 | 93.8 | 95.5 | 92.2 | 94.9 |
| 1000 SRS versus plan, 5 cm depth (3%, 3 mm) | 97.4 | 99.8 | 96.2 | 100.0 | 98.4 | 97.7 | 98.1 | 98.8 | 97.5 | 98.9 |
| 1000 SRS versus plan, 5 cm depth (2%, 2 mm) | 95.9 | 96.8 | 95.0 | 96.4 | 95.8 | 95.5 | 95.4 | 97.2 | 96.2 | 95.6 |
| 1000 SRS versus film, 15 cm depth (3%, 3 mm) | 95.9 | 99.5 | 96.2 | 100.0 | 97.1 | 96.7 | 97.1 | 98.2 | 96.1 | 97.7 |
| 1000 SRS versus film, 15 cm depth (2%, 2 mm) | 93.5 | 96.9 | 96.0 | 91.0 | 96.6 | 93.8 | 95.1 | 95.5 | 95.4 | 95.2 |
| 1000 SRS versus plan, 15 cm depth (3%, 3 mm) | 96.8 | 98.2 | 97.2 | 100.0 | 98.8 | 96.9 | 97.7 | 98.2 | 97.1 | 98.5 |
| 1000 SRS versus plan, 15 cm depth (2%, 2 mm) | 94.9 | 97.4 | 96.8 | 97.5 | 96.0 | 95.1 | 94.2 | 94.3 | 95.5 | 96.1 |
| 1000 SRS versus Seven29, 15 cm depth (3%, 3 mm) | 100.0 | 100.0 | 100.0 | 100.0 | 100.0 | 100 | 100 | 100 | 100 | 100 |
| 1000 SRS versus Seven29, 15 cm depth (2%, 2 mm) | 98.2 | 100.0 | 99.1 | 95.5 | 100.0 | 100 | 100 | 97.7 | 100 | 96.8 |
Note that the two measurement depths of 5 cm, 15 cm (outlined respectively in Figures 1 and 2) and the two sets of gamma criteria (3%/3 mm and 2%/2 mm) were investigated
Pairwise correlation between Octavius 1000 SRS, EDR2 film, Octavius Seven29 measured dat, and the Pinnacle3 calculated data yielded Pearson correlation coefficient >0.98. Two-tailed paired Student's t-test returned P > 0.1 between the measurements and calculated data indicating the acceptance of the null hypothesis.
DISCUSSION
In this work, the clinical application of a 2D liquid-filled ion chamber detector array, the Octavius 1000 SRS is investigated. The Octavius 1000 SRS is found to be easy to use for pre-treatment delivery verification in radiotherapy. The setup procedures and experimental positioning are simple and straightforward. Three different sets of measurements for small fields of highly-modulated beams were performed in this study. Although the detector is available for QA of SRS/SBRT treatment plans, we focused on SBRT applications considered to be appropriate based on the detectors resolution and capability to accurately resolve dose profiles across the field as well as across the single detector considering changes in energy spectrum with a depth of measurement.
In the first set of measurements outlined in Figure 1, a comparison between the Octavius 1000 SRS and EDR2 film measured profiles was performed for single field exposure and 5 cm slab phantom. The center to center spacing of 2.5 mm (sampling frequency 0.4 mm−1) between the ion chambers produces a sampling rate, which results in an accurate representation of the measured profiles of highly-modulated fields. Using the gamma criterion with tolerances of 3% and 3 mm, the percentage of the points passed ranged from 95% to 100%. Person correlation coefficient >0.99 confirms high degree of association between the two data sets. In a similar dosimetric study, Poppe et al.[24] found 98.4% passing rate for 3% and 3 mm gamma index evaluation between Octavius 1000 SRS and Gafchromic ETB3 film for IMRT fields from the prostate treatment plan. Gamma criterion with tolerances of 2% and 2 mm has a passing rate ranging from 91% to 95% for the same fields delivered. There are several factors impacting the outcome of the change in the gamma criterion. Sampling frequency 0.4 mm−1 (Octavius 1000 SRS) vs. 11.2 mm−1 (EDR2) corresponds to approximately 28 sampling points for the length of a single ion chamber in the detector array. Low and Dempsey[25] evaluated the gamma dose distribution comparison method with maximum dose gradient of 12% mm−1 and pixel spacing of 1 mm. While the pixel spacing of the evaluated dose response was sufficiently small to provide accurate calculation of gamma in the steep dose gradient regions, the surface area (2.3 mm × 2.3 mm) of a single detector carries a complexity on its own. Even though the dose-response function of the single chamber cross-section has relatively small σ value of the Gaussian does-response function (0.72 mm),[24] the volume averaging effect[23] becomes more obvious when lowering the % dose difference, distance to agreement criteria for gamma index calculation. The positional errors during the setup,[23] temperature dependence of the liquid-filled ionization chamber,[20] and errors with film processing[26,27,28,29,30] also contribute to the uncertainty of the measured data.
The second set of measurements was performed at varying depths, where single field exposures were compared between the Octavius 1000 SRS, Octavius Seven29 and EDR2 film. Previous research[23] investigated the sensitivity of the detector with the change in buildup thickness. At shallow depths, change in sensitivity can be attributed predominantly to the lower energy charge particles produced by the collimation system. A large variation in array signal to small changes in geometry at larger depths is dominated by alteration in the energy spectrum with depth. Practical use of the detector array on a daily basis will most likely include phantom buildup of the thickness we considered in the study as “higher depth.” Highly-modulated field profiles acquired with 1000 SRS detector array closely follow the profiles acquired by the EDR2 film, as displayed in Figure 3 with the Pearson correlation coefficient >0.98. The sensitivity change with depth showed minimal impact on the data measured and compared to EDR2 film [examples shown in Figure 6] as well as on the single detector point comparisons with the Octavius Seven29. The profile comparison between the Octavius Seven29 and film showed the importance of detector spatial resolution and the advantage of Octavius 1000 SRS. Although the single point agreement of the detector Seven29 with film could be considered acceptable (between 91% and 100% for the 3% 3 mm criteria), due to the limited number of sampling points along the axis of the detector, the complete representation of the modulated profile is not achievable [Figure 7] without increasing the sampling rate.[13] With a 5 mm shift, the sampling frequency is doubled (0.2 mm−1), yet in case of highly modulated beams with steep gradients, the spatial resolution will be compromised due to the size of the single detector and its volume averaging effect (not taking into account possible setup errors).
Figure 6.

Comparison between the measured profiles of the Octavius SRS 1000 and EDR2 film for a single field exposure measured at 5 cm depth (left), 15 cm depth (middle) and the comparison between gammas for two different depths (right)
Figure 7.
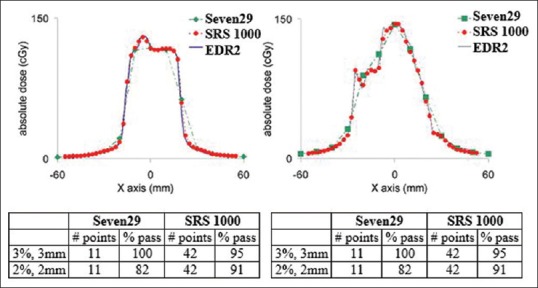
Linear profiles of Octavius 1000 SRS, Octavius Seven29 and EDR2 film. Shown below are the passing rate for gamma criterion comparison between Octavius 1000 SRS and EDR2 film and Octavius Seven29 and EDR2 film
A third set of measurements was performed using multiple field irradiations on Octavius phantom with Octavius 1000 SRS, Octavius Seven29, and EDR2 film. Although the single detector of the Octavius 1000 SRS array can detect submillimetric changes in the field, any variation in the intensity along the single detector will not have an adequate spatial resolution. Detailed analysis into these issues is outside our scope.
The present results verify the argument that the complete representation of the modulated profile cannot be achieved without increasing the sampling rate. Multiple field exposures at high doses delivered to the Octavius 1000 SRS showed the response of the detector to be almost identical to those of EDR2 film and Octavius Seven29. This finding shows there is a linear relationship between the responses of Octavius 1000 SRS with doses in the clinical range.
CONCLUSIONS
Based on the measurements and data analysis of this study, the Octavius 1000 SRS was found to be a dosimetrically accurate array detector suitable for QA and verification of SBRT treatments in radiotherapy. An array of detectors with fine size and high spatial resolution are equally capable of representing the dose profiles of highly-modulated fields as films. The variety of the phantoms and setup used did not produce significant changes in the accuracy of the measurements. Accuracy of the detector array for usage not only for dosimetric verification of patient plans but also in the QA of the linear accelerator. In future studies, we will focus on evaluating detector performance in solely SRS treatments and flattening filter free applications.
Financial support and sponsorship
Nil.
Conflicts of interest
There are no conflicts of interest.
REFERENCES
- 1.Webb S. Intensity Modulated Radiation Therapy. Bristol (England): Institute of Physics Publishing; 2000. [Google Scholar]
- 2.Zelefsky MJ, Fuks Z, Hunt M, Yamada Y, Marion C, Ling CC, et al. High-dose intensity modulated radiation therapy for prostate cancer: Early toxicity and biochemical outcome in 772 patients. Int J Radiat Oncol Biol Phys. 2002;53:1111–6. doi: 10.1016/s0360-3016(02)02857-2. [DOI] [PubMed] [Google Scholar]
- 3.Kam MK, Chau RM, Suen J, Choi PH, Teo PM. Intensity-modulated radiotherapy in nasopharyngeal carcinoma: Dosimetric advantage over conventional plans and feasibility of dose escalation. Int J Radiat Oncol Biol Phys. 2003;56:145–57. doi: 10.1016/s0360-3016(03)00075-0. [DOI] [PubMed] [Google Scholar]
- 4.Krueger EA, Fraass BA, McShan DL, Marsh R, Pierce LJ. Potential gains for irradiation of chest wall and regional nodes with intensity modulated radiotherapy. Int J Radiat Oncol Biol Phys. 2003;56:1023–37. doi: 10.1016/s0360-3016(03)00183-4. [DOI] [PubMed] [Google Scholar]
- 5.Paskalev KA, Seuntjens JP, Patrocinio HJ, Podgorsak EB. Physical aspects of dynamic stereotactic radiosurgery with very small photon beams (1.5 and 3 mm in diameter) Med Phys. 2003;30:111–8. doi: 10.1118/1.1536290. [DOI] [PubMed] [Google Scholar]
- 6.Galvin JM, Bednarz G. Quality assurance procedures for stereotactic body radiation therapy. Int J Radiat Oncol Biol Phys. 2008;71:S122–5. doi: 10.1016/j.ijrobp.2007.10.002. [DOI] [PubMed] [Google Scholar]
- 7.Poppe B, Blechschmidt A, Djouguela A, Kollhoff R, Rubach A, Willborn KC, et al. Two-dimensional ionization chamber arrays for IMRT plan verification. Med Phys. 2006;33:1005–15. doi: 10.1118/1.2179167. [DOI] [PubMed] [Google Scholar]
- 8.Martens C, De Wagter C, De Neve W. The value of the LA48 linear ion chamber array for characterization of intensity-modulated beams. Phys Med Biol. 2001;46:1131–48. doi: 10.1088/0031-9155/46/4/316. [DOI] [PubMed] [Google Scholar]
- 9.Spezi E, Angelini AL, Romani F, Ferri A. Characterization of a 2D ion chamber array for the verification of radiotherapy treatments. Phys Med Biol. 2005;50:3361–73. doi: 10.1088/0031-9155/50/14/012. [DOI] [PubMed] [Google Scholar]
- 10.Kutcher GJ, Coia L, Gillin M, Hanson WF, Leibel S, Morton RJ, et al. Comprehensive QA for radiation oncology: Report of AAPM radiation therapy committee task group 40. Med Phys. 1994;21:581–618. doi: 10.1118/1.597316. [DOI] [PubMed] [Google Scholar]
- 11.Poppe B, Djouguela A, Blechschmidt A, Willborn K, Rühmann A, Harder D. Spatial resolution of 2D ionization chamber arrays for IMRT dose verification: Single-detector size and sampling step width. Phys Med Biol. 2007;52:2921–35. doi: 10.1088/0031-9155/52/10/019. [DOI] [PubMed] [Google Scholar]
- 12.Fraass B, Doppke K, Hunt M, Kutcher G, Starkschall G, Stern R, et al. American association of physicists in medicine radiation therapy committee task group 53: Quality assurance for clinical radiotherapy treatment planning. Med Phys. 1998;25:1773–829. doi: 10.1118/1.598373. [DOI] [PubMed] [Google Scholar]
- 13.Low DA, Harms WB, Mutic S, Purdy JA. A technique for the quantitative evaluation of dose distributions. Med Phys. 1998;25:656–61. doi: 10.1118/1.598248. [DOI] [PubMed] [Google Scholar]
- 14.Tsai JS, Wazer DE, Ling MN, Wu JK, Fagundes M, DiPetrillo T, et al. Dosimetric verification of the dynamic intensity-modulated radiation therapy of 92 patients. Int J Radiat Oncol Biol Phys. 1998;40:1213–30. doi: 10.1016/s0360-3016(98)00009-1. [DOI] [PubMed] [Google Scholar]
- 15.Boehmer D, Bohsung J, Eichwurzel I, Moys A, Budach V. Clinical and physical quality assurance for intensity modulated radiotherapy of prostate cancer. Radiother Oncol. 2004;71:319–25. doi: 10.1016/j.radonc.2004.02.016. [DOI] [PubMed] [Google Scholar]
- 16.Li S, Rashid A, He S, Djajaputra D. A new approach in dose measurement and error analysis for narrow photon beams (beamlets) shaped by different multileaf collimators using a small detector. Med Phys. 2004;31:2020–32. doi: 10.1118/1.1760191. [DOI] [PubMed] [Google Scholar]
- 17.González-Castaño DM, Gómez F, Brualla L, Roselló JV, Planes D, Sánchez M, et al. Aliquid-filled ionization chamber for high precision relative dosimetry. Phys Med. 2011;27:89–96. doi: 10.1016/j.ejmp.2010.04.002. [DOI] [PubMed] [Google Scholar]
- 18.Pardo J, Roselló JV, Sánchez-Doblado F, Gómez F. Verification of intensity modulated profiles using a pixel segmented liquid-filled linear array. Phys Med Biol. 2006;51:N211–9. doi: 10.1088/0031-9155/51/11/N01. [DOI] [PubMed] [Google Scholar]
- 19.Pena J, Franco L, Gomez F, Iglesias A, Pardo J, Pazos A, et al. Liquid-filled ionization chamber temperature dependence. Nucl Instrum Methods Phys Res. 2006;560:584–8. [Google Scholar]
- 20.Pardo J, Franco L, Gómez F, Iglesias A, Lobato R, Mosquera J. Free ion yield observed in liquid isooctane irradiated by gamma rays. Comparison with the Onsager theory. Phys Med Biol. 2004;49:1905–14. doi: 10.1088/0031-9155/49/10/006. [DOI] [PubMed] [Google Scholar]
- 21.Van Esch A, Clermont C, Devillers M, Iori M, Huyskens DP. On-line quality assurance of rotational radiotherapy treatment delivery by means of a 2D ion chamber array and the octavius phantom. Med Phys. 2007;34:3825–37. doi: 10.1118/1.2777006. [DOI] [PubMed] [Google Scholar]
- 22.Markovic M, Stathakis S, Mavroidis P, Jurkovic IA, Papanikolaou N. Characterization of a two-dimensional liquid-filled ion chamber detector array used for verification of the treatments in radiotherapy. Med Phys. 2014;41:051704. doi: 10.1118/1.4870439. [DOI] [PubMed] [Google Scholar]
- 23.Laub WU, Wong T. The volume effect of detectors in the dosimetry of small fields used in IMRT. Med Phys. 2003;30:341–7. doi: 10.1118/1.1544678. [DOI] [PubMed] [Google Scholar]
- 24.Poppe B, Stelljes TS, Looe HK, Chofor N, Harder D, Willborn K, et al. Performance parameters of a liquid filled ionization chamber array. Med Phys. 2013;40:082106. doi: 10.1118/1.4816298. [DOI] [PubMed] [Google Scholar]
- 25.Low DA, Dempsey JF. Evaluation of the gamma dose distribution comparison method. Med Phys. 2003;30:2455–64. doi: 10.1118/1.1598711. [DOI] [PubMed] [Google Scholar]
- 26.Dogan N, Leybovich LB, Sethi A. Comparative evaluation of Kodak EDR2 and XV2 films for verification of intensity modulated radiation therapy. Phys Med Biol. 2002;47:4121–30. doi: 10.1088/0031-9155/47/22/314. [DOI] [PubMed] [Google Scholar]
- 27.Chungbin S, Ezzell G. Streamlined IMRT patient verification measurements using Kodak extended dose range film (EDR2).Med. Phys. 2001;28:1208–9. [Google Scholar]
- 28.Ezzell GA, Chungbin S. The overshoot phenomenon in step-and-shoot IMRT delivery. J Appl Clin Med Phys. 2001;2:138–48. doi: 10.1120/jacmp.v2i3.2607. [DOI] [PMC free article] [PubMed] [Google Scholar]
- 29.Shi C, Papanikolaou N, Yan Y, Weng X, Jiang H. Analysis of the sources of uncertainty for EDR2 film-based IMRT quality assurance. J Appl Clin Med Phys. 2006;7:1–8. doi: 10.1120/jacmp.v7i2.2230. [DOI] [PMC free article] [PubMed] [Google Scholar]
- 30.Das I, Cheng CW, Pai S. Basic Film Dosimetry. Med Phys. 1998;25:2093–115. [Google Scholar]