Summary paragraph:
Synthetic lethality, an interaction whereby the co-occurrence of two genetic events leads to cell death but one event alone does not, can be exploited for cancer therapeutics1. DNA repair processes represent attractive synthetic lethal targets since many cancers exhibit an impaired DNA repair pathway, which can lead to dependence on specific repair proteins2. The success of poly (ADP-ribose) polymerase 1 (PARP-1) inhibitors in homologous recombination-deficient cancers highlights the potential of this approach3. Hypothesizing that other DNA repair defects would give rise to synthetic lethal relationships, we queried dependencies in cancers with microsatellite instability (MSI), which results from deficient DNA mismatch repair (dMMR). Here we analyzed data from large-scale CRISPR/Cas9 knockout and RNA interference (RNAi) silencing screens and found that the RecQ DNA helicase WRN was selectively essential in MSI models in vitro and in vivo, yet dispensable in microsatellite stable (MSS) models. WRN depletion induced double-strand DNA breaks (DSB) and promoted apoptosis and cell cycle arrest selectively in MSI models. MSI cancer models required the helicase activity, but not the exonuclease activity of WRN. These findings expose WRN as a synthetic lethal vulnerability and promising drug target for MSI cancers.
Defects of DNA mismatch repair (MMR) promote a hypermutable state with frequent insertion/deletion mutations occurring at nucleotide repeat regions known as microsatellites and single-nucleotide variant (SNV) mutations4. This class of hypermutation, microsatellite instability (MSI), contributes to several cancers, predominantly 15% of colon4, 22% of gastric5, 20–30% of endometrial6, and 12% of ovarian7 cancers. MSI can arise from Lynch Syndrome4, caused by germline mutations in MMR genes MSH2, MSH6, PMS2, or MLH1. More commonly, MSI cancers arise following somatic MMR inactivation, typically MLH1 promoter hypermethylation4. While MSI has been associated with striking responses to immune checkpoint blockade (ICB), 45–60% of such cancers do not respond to ICB, and use of ICB can be limited by toxicity8,9. Hence, novel therapies are needed for MSI tumors.
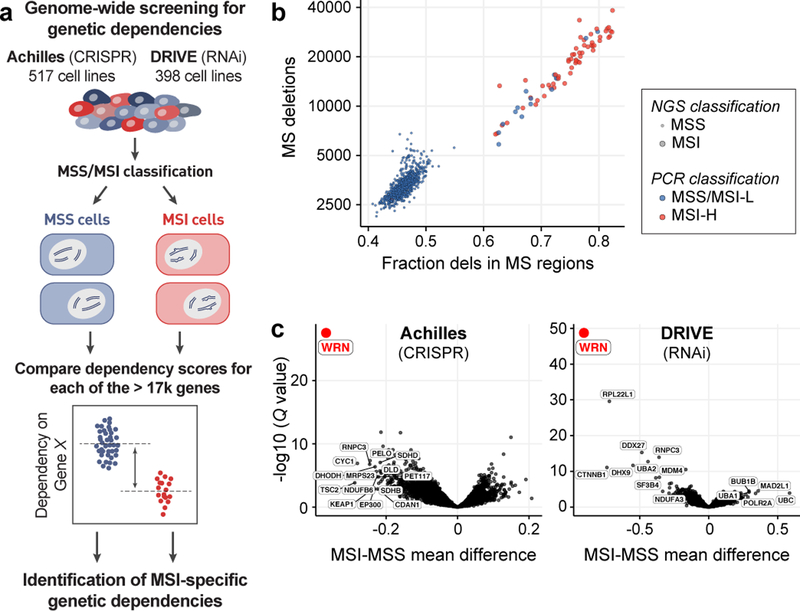
Hypothesizing that MSI/dMMR may create vulnerabilities, we queried two independent large-scale cancer dependency datasets, Project Achilles and Project DRIVE, for genes selectively essential in MSI cancer cells (Fig. 1a). Project Achilles screened 517 cell lines with a genome-scale CRISPR/Cas9 library, and Project DRIVE interrogated 398 cell lines with an RNAi library to define genes essential for proliferation and survival of individual cancer cell lines10,11. We ascertained MSI status using next-generation sequencing (NGS)12 quantification of deletions and fraction of deletions located within microsatellite regions, identifying three groups: MSI, MSS, and indeterminate (Fig. 1b, Supplementary Table 1). These classifications were highly concordant with PCR-based MSI phenotyping13 and with predicted dMMR (Extended Data Fig. 1a). In total, 51 unique MSI and 541 unique MSS cell lines (exclusive of those marked indeterminate) were represented by one or both screening datasets.
Fig. 1. Genome-scale functional genomic screening identifies genes synthetic lethal with MSI.
a, Analyses schematic. Cell lines were grouped by feature. Dependency scores were analyzed to identify feature-specific genetic dependencies. b, Cell lines plotted by number of deletions and fraction of deletions in microsatellite (MS) regions. MSI classification by next generation sequencing (NGS) and multiplex polymerase chain reaction (PCR) are indicated. c, False discovery rate adjusted (FDR) Q values (Benjamini–Hochberg method) plotted against the mean difference of dependency scores between MSI and MSS cell lines for Projects Achilles (n = 32 MSI, 412 MSS) and DRIVE (n = 34 MSI, 327 MSS).
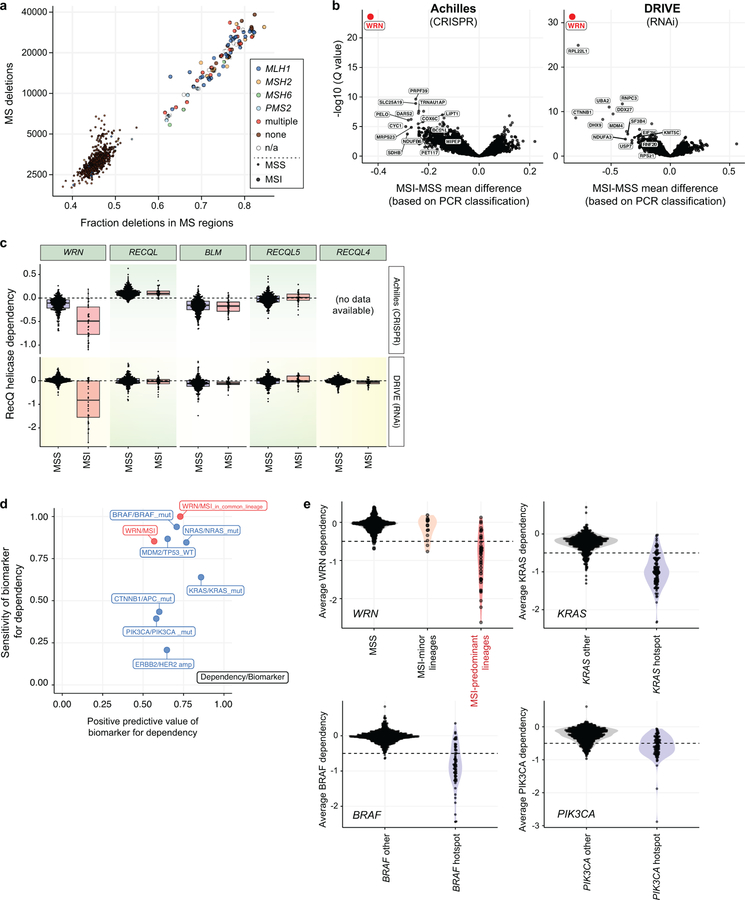
Projects Achilles CRISPR/Cas9 and DRIVE each independently identified WRN, encoding a RecQ DNA helicase, as the top preferential dependency in MSI compared to MSS cell lines (Q values = 4.8×10⁻²⁴ and 1.5×10−45, respectively, Fig. 1c). These findings remained true with PCR-based MSI classifications (Extended Data Fig. 1b). In contrast, none of the four other RecQ DNA helicases were preferentially essential with MSI (Extended Data Fig. 1c). We then evaluated MSI as a biomarker for WRN dependency, demonstrating that the MSI/WRN relationship compared favorably to other strong biomarkers for vulnerabilities such as the relationships of activating KRAS and BRAF mutations to KRAS and BRAF dependencies, respectively (Extended Data Figs. 1d, e).
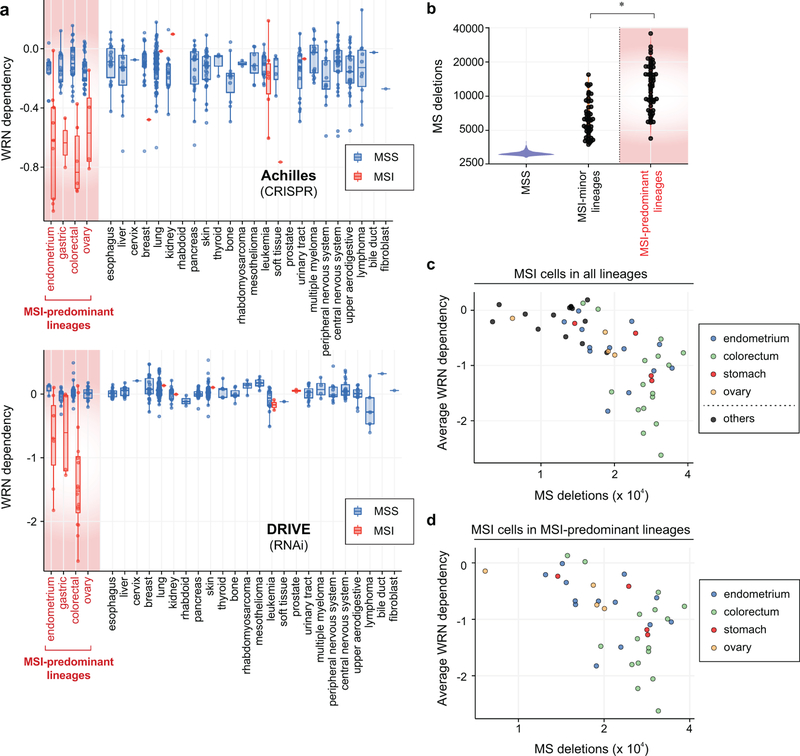
MSI is most commonly observed in colorectal, endometrial, gastric, and ovarian cancers. MSI cell lines from these four lineages (n = 37) showed greater WRN dependence than their MSS counterparts (n = 91; P = 4.2×10⁻¹³, Wilcoxon rank-sum test; Extended Data Fig. 2a). We also identified 14 MSI cell lines from lineages where MSI is less common (6 leukemia, 2 prostate, and single models of other lineages). However, these MSI cells were distinct, harboring a median 0.56-fold fewer deletion mutations in microsatellite regions compared to typical-lineage MSI models (P = 1.7×10⁻⁹; Extended Data Fig. 2b). They were also less WRN dependent (P = 1.1×10⁻⁵; Extended Data Fig. 2c), despite possessing events predictive of dMMR (Supplementary Table 1). Correspondingly, the specificity of MSI as a biomarker for WRN dependency improved by delineating MSI within MSI-predominant lineages (Extended Data Figs. 1d, e). These observations suggest that WRN dependency is not simply a result of dMMR but may require specific lineages and/or a stronger mutator phenotype. Indeed, WRN dependency correlated with the number of microsatellite deletions within all MSI cell lines and in MSI-predominant lineages (Spearman’s rho = −0.74, n = 54, P < 2.2×10⁻¹⁶ ; Spearman’s rho = −0.57, n = 37, P = 3.3×10⁻⁴, respectively; Extended Data Figs. 2c, d).
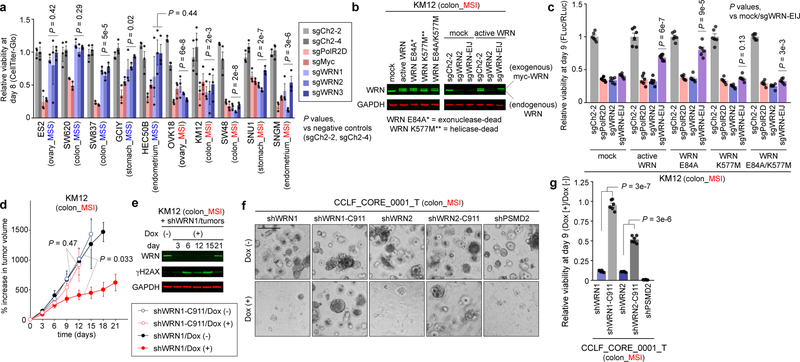
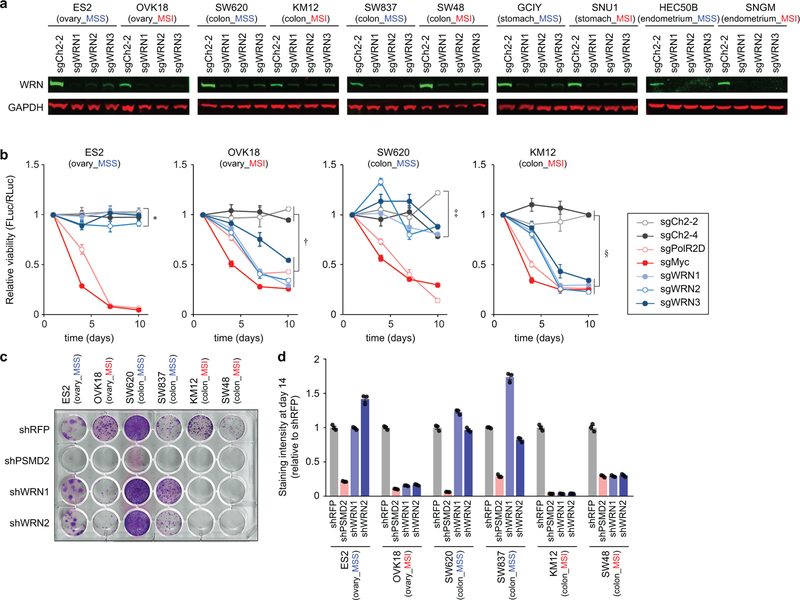
To further assess WRN dependency, we validated three sgRNAs targeting WRN by immunoblot (IB) (Extended Data Fig. 3a) and evaluated WRN knockout in 5 MSS and 5 MSI cell lines, all from MSI-predominant lineages, with an 8-day viability assay. Effects of WRN knockout were comparable to ‘pan-essential’ controls in MSI cell lines. WRN silencing in MSS models instead approximated negative controls, targeting intergenic regions (Fig. 2a). Similarly, WRN depletion impaired the viability of MSI cells despite negligible effects in MSS cells in a 10-day competitive growth assay (Extended Data Fig. 3b). Complementing these CRISPR/Cas9 data, WRN silencing with short hairpin RNA (shRNA) impaired MSI, but not MSS, cell viability (Extended Data Figs. 3c, d). To validate that these phenotypes were attributable to WRN inactivation, we developed an sgRNA targeting a WRN exon-intron junction (sgWRN-EIJ), which silenced endogenous WRN but not exogenous WRN cDNA (Fig. 2b). Correspondingly, WRN cDNA rescued Cas9-expressing KM12 from sgWRN-EIJ, but not sgWRN2, targeting endogenous and exogenous WRN (Fig. 2c). These data argue that the viability loss in MSI cells is attributable to WRN inactivation.
Fig. 2. WRN is a synthetic lethal partner with MSI.
a, Relatively viability 8 days following sgRNA transduction. Negative controls targeting chromosome 2 intergenic sites: sgCh2–2, sgCh2–4. Pan-essential controls: sgPolR2D, sgMyc. WRN sgRNAs: sgWRN1, sgWRN2, sgWRN3. b, (left) Immunoblot (IB). WRN, GAPDH levels in KM12 expressing indicated WRN cDNA. (right) IB. WRN levels following sgRNA transduction. c, Relative viability 9 days following sgRNA transduction in KM12 expressing Cas9 and GFP or indicated WRN cDNA. d, KM12 xenograft growth ± dox-induction of shWRN1 or seed control (shWRN1-C911). e, IB. WRN, ɣH2AX, GAPDH levels in KM12 xenografts. f, Representative images (200 µm scale bar) and g, viability of CCLF_CORE_0001_T 9 days following shRNA induction relative to Dox(−). Data shown: means ± SEM (a, c, d, g). n = 3 (a), 6 (c) biological replicates, 5 (4 from d15–18), 5, 4, 4 tumors for shWRN1/Dox(−), Dox(+), shWRN1-C911/Dox(−), Dox(+), respectively (d), 2 biological replicates with 3 technical replicates each (g). P values: two-way ANOVA between sgWRNs and negative controls (a), two-tailed t-test for sgWRN-EIJ values between mock and indicated WRN cDNA (c), likelihood ratio test comparing Dox(+) vs (−) growth rates (d), two-tailed t-test between shWRN and its seed control (g). For Fig. 2, representative data from one experiment are shown. All experiments were performed three times except for e-g (twice) and d (once).
These findings suggest that WRN dependence with MSI could be exploited by WRN inhibition. WRN protein functions as both a 3’−5’ exonuclease and 3’−5’ helicase in processes including DNA repair, DNA replication, and telomere maintenance14,15. To determine which enzymatic function is essential, we attempted to rescue sgWRN-EIJ with exonuclease-dead (E84A), helicase-dead (K577M), or dually exonuclease/helicase-dead (E84A/K577M) versions of WRN cDNA14 in KM12. Exonuclease inactivation did not attenuate rescue, suggesting this function is dispensable. By contrast, helicase inactivation prevented rescue (Fig. 2b, c), nominating the helicase domain as a candidate therapeutic target.
Next, we validated WRN dependency in vivo with xenografts of KM12 transduced with doxycycline (dox)-inducible shRNA targeting WRN (shWRN1) or control (shWRN1-C911) with nucleotides 9 through 11 of shWRN1 mutated to its complement, thus maintaining the ‘seed’ sequence associated with shRNA off-target effects16. Induction of shWRN1 but not shWRN1-C911 significantly impaired tumor growth (Fig. 2d). We observed substantial depletion of WRN with shWRN1 induction in vivo. However, WRN levels recovered by three weeks (Fig. 2e), mirroring tumor growth recovery, suggesting that WRN re-expression was required to overcome shWRN1 induction. We further demonstrated that shRNA targeting WRN impaired the viability of a novel patient-derived organoid generated from an MSI colon cancer (Figs. 2f, g). By demonstrating the synthetic lethal relationship in vivo and in a patient-derived model, these data support WRN as a therapeutic target for MSI cancers.
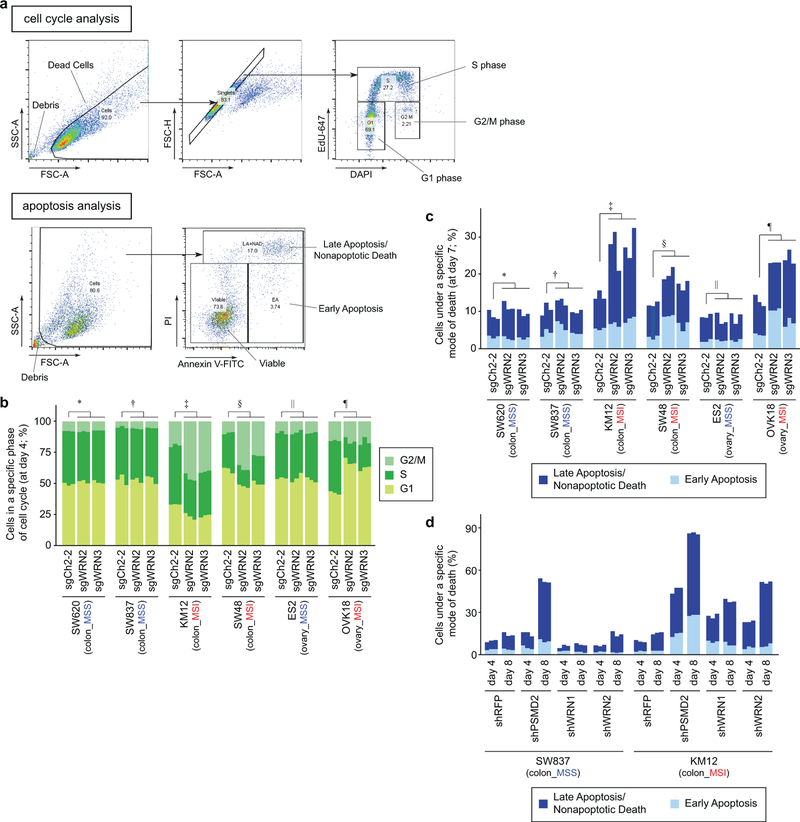
To pursue the basis of WRN dependency, we first performed cell cycle analyses. WRN silencing reduced the proportion of MSI cells in S phase and increased cells in G1 or G2/M phases, suggesting cell cycle arrest at either G1 or G2/M phases (Extended Data Figs. 4a, b). Furthermore, annexin V/propidium iodide (PI) staining demonstrated induction of apoptosis and cell death in MSI cells following WRN silencing (Extended Data Figs. 4a, c, d). In contrast, MSS cell lines demonstrated no significant evidence of increased cell cycle arrest nor death after WRN silencing.
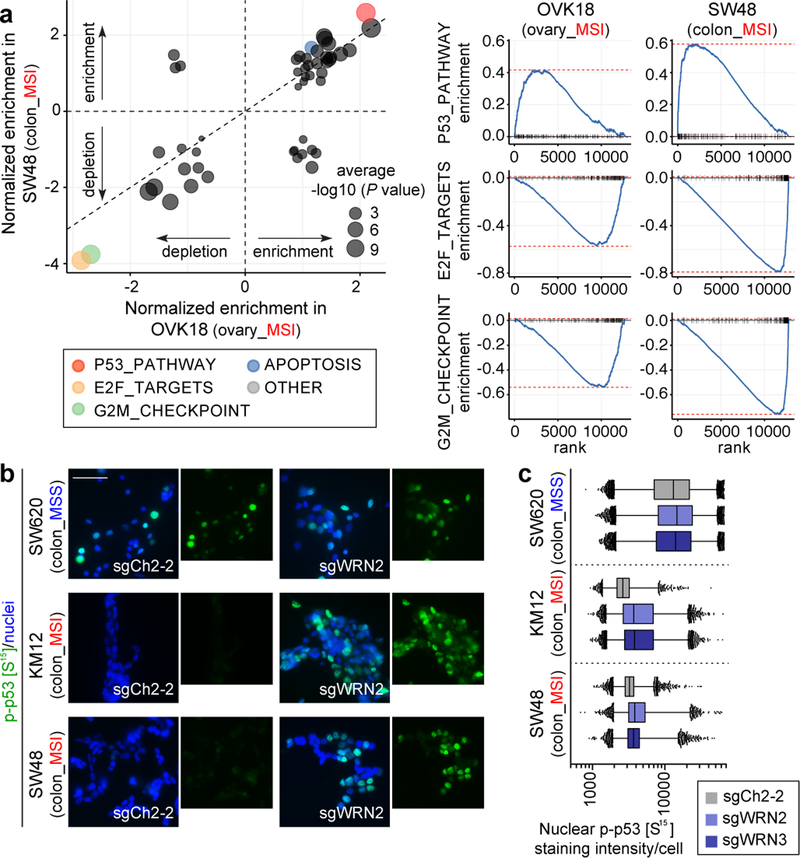
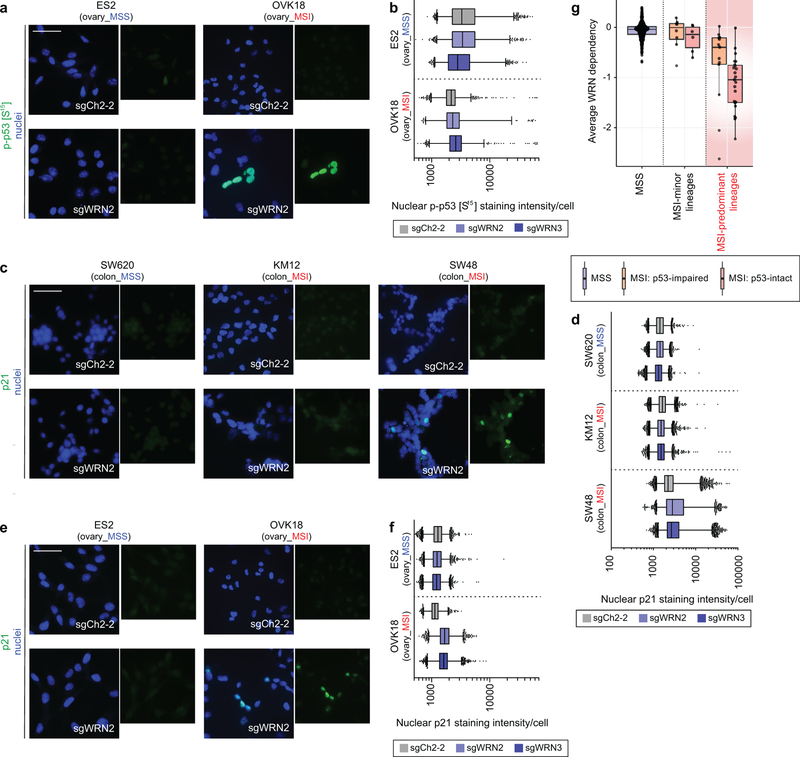
Consistent with the cell cycle and apoptosis assays, mRNA sequencing analysis of WRN silencing in MSI cells revealed downregulated G2/M checkpoint progression and E2F target signatures and upregulated signatures of apoptosis. This analysis additionally revealed p53 activation in MSI-depleted MSI cells (Fig. 3a). Immunofluorescence (IF) in MSI models after WRN silencing demonstrated increased p53 S15 phosphorylation, indicating p53 activation17. In contrast, we observed substantially weaker changes in phospho-p53 intensity in WRN-depleted MSS models (P < 2×10⁻¹⁶, contrast test of mean log fold-change in MSS versus MSI lines, Figs. 3b, c, Extended Data Figs. 5a, b). WRN depletion in TP53 wild-type MSI cells increased protein levels of cyclin-dependent kinase inhibitor p21, another indication of p53 activation. In contrast, there were significantly weaker p21 changes after WRN silencing in MSS and TP53-mutant MSI cells (P < 2×10⁻¹⁶, log fold-change in MSI TP53 wild-type versus MSS or TP53 null cells, Extended Data Figs. 5c–f). We then re-evaluated our dependency data, stratifying by MSI and p53 status. While p53-intact MSI cell lines (n = 23) were more sensitive to WRN loss than their p53-impaired (n = 13) counterparts (P = 0.02; Wilcoxon rank-sum test; common-MSI lineages only), both wild-type and mutant TP53 MSI cell lines were dependent on WRN (Extended Data Fig. 5g). These data suggest that while WRN loss leads to p53 induction, p53 activity contributes to, but is not solely responsible for WRN dependence.
Fig. 3. WRN depletion in MSI cells induces cell cycle arrest, apoptosis, and a p53 response.
a, GSEA enrichment/depletion scores in WRN-depleted OVK18 cells plotted against WRN-depleted SW48 cells. Signature enrichment plots for Hallmark gene sets shown for WRN-depleted OVK18 and SW48 cells. n = 2 biological replicates. b, phospho-p53 (S15) immunofluorescence (IF) following sgRNA transduction (50 µm scale bar). c, Nuclear phospho-p53 (S15) staining intensity per cell. Lower error bar, box lower limit, bar, box upper limit, upper error bar, dots: 1st, 25th percentiles, median, 75th, 99th percentiles, outliers, respectively. Mean log intensity change following WRN knockout compared to control sgRNA in MSI versus MSS cells; P < 2×10⁻¹⁶, contrast test of least-squares means. Mean log-fold change: 0.21 (KM12), 0.10 (SW48), 0.034 (SW620). n = (# cells with sgCh2–2, sgWRN2, sgWRN3) for KM12 (7080, 14410, 15921), SW48 (15329, 9491,13196), SW620 (27374, 23898, 28808). For Fig. 3, representative data from one experiment are shown. All experiments were performed twice except for a (once).
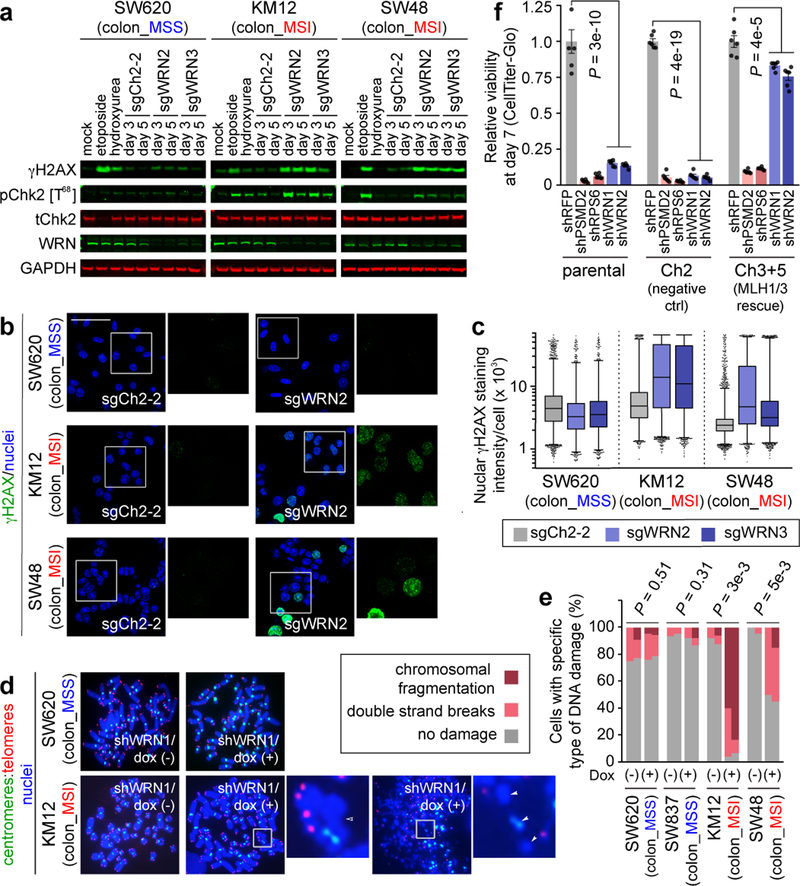
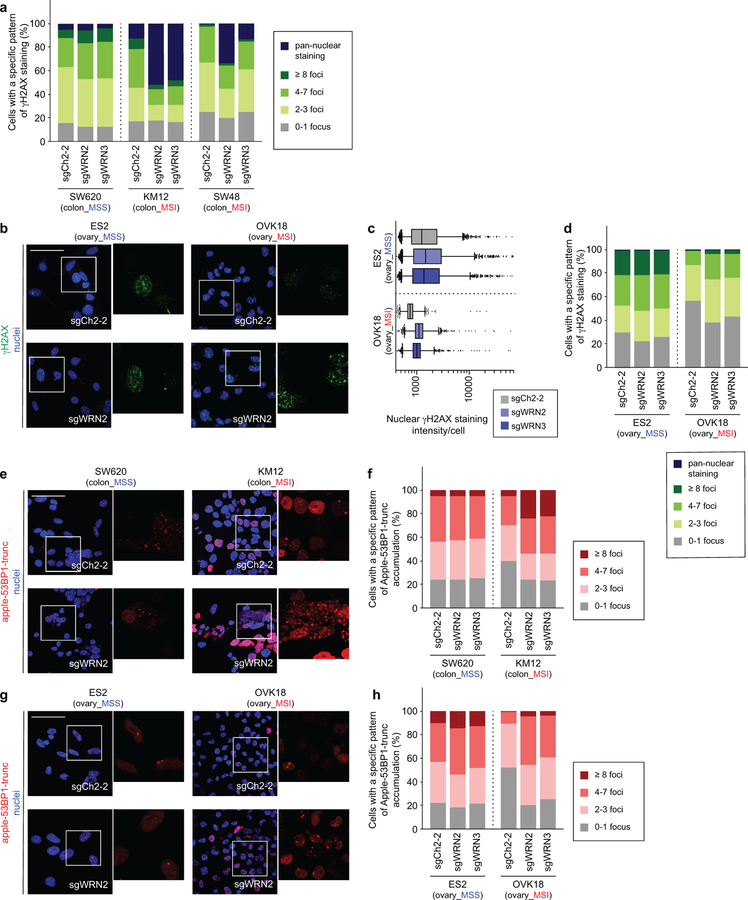
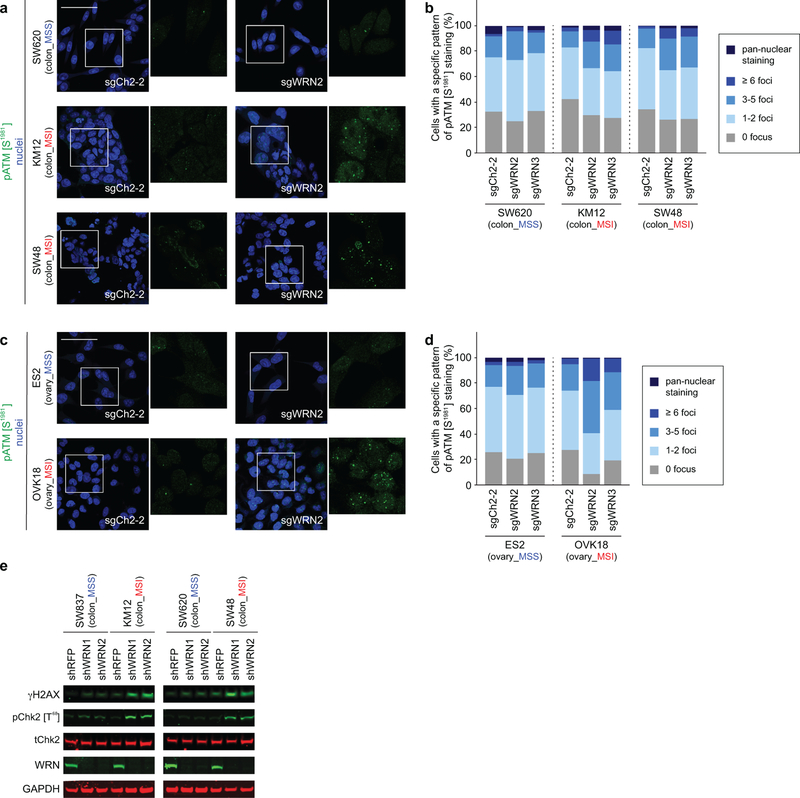
The finding of increased p53 S15 phosphorylation, a phosphorylation target of DNA-damage response kinases ATR and ATM17, suggested that WRN loss with MSI leads to DNA damage. This hypothesis is consistent with roles of p53 and WRN in responding to DNA damage and preserving DNA integrity15,17. Indeed, biallelic germline inactivation of WRN causes Werner Syndrome, characterized by premature aging and increased cancer incidence due to impaired DNA damage repair and telomeric shortening leading to chromosomal aberrations15. Next we determined that WRN silencing in MSI but not MSS cells substantially increased ɣH2AX and 53BP1 foci, markers of DSB (Figs. 4a–c, Extended Data Figs. 6a–h). These findings were corroborated by increased phospho-ATM (S1981) foci formation and Chk2 (T68) phosphorylation, indicating DSB responses known to activate p53 and anti-proliferative signaling18 (Extended Data Figs. 7a–e). We confirmed increased ɣH2AX in MSI cells treated with shRNA against WRN in vitro and in vivo, arguing that DSBs are not just a consequence of CRISPR/Cas9 activity (Fig. 2e, Extended Data Fig. 7e). These observations also explain why p53-impaired MSI cells are sensitive to WRN depletion as DSBs are toxic to cells, independent of p53 status19.
Fig. 4. WRN depletion in MSI cells leads to accumulation of double strand DNA breaks.
a, IB. ɣH2AX, phospho(T86)- and total- Chk2, WRN, GAPDH levels following WRN knockout. Etoposide and hydroxyurea were used to generate DSB and replication stress, respectively. b, ɣH2AX IF following sgRNA transduction (50 µm scale bar). c, Nuclear ɣH2AX staining intensity per cell. Lower error bar, box lower limit, bar, box upper limit, upper error bar, dots: 1st, 25th percentiles, median, 75th, 99th percentiles, outliers, respectively. Mean log intensity change following WRN knockout compared to control in MSI compared with MSS cells; P < 2×10⁻¹⁶, contrast test of least-squares means. Mean log fold-change: 0.39 (KM12), 0.33 (SW48), −0.10 (SW620). n = (cells with sgCh2–2, sgWRN2, sgWRN3) for KM12 (3029, 8880, 6887), SW48 (13246, 4553, 7216), SW620 (9071, 5174, 3853). d, Telomere PNA-FISH of metaphase spreads ± dox-induction of shWRN1. Hollow triangles: chromosomal breaks. Filled triangles: chromosomal fragments. e, Metaphase spread DNA damage pattern per cell. n = 2 independent experiments presented in tandem. f, Relative viability of HCT116 ± MMR restoration 7 days following shRNA transduction. Negative control: shRFP. Pan-essential controls: shPSMD2, shRPS6. WRN shRNA: shWRN1, shWRN2. Data shown: means ± SEM (n = 6 biological replicates). P values: two-tailed t-test for % cells with DNA damage (e), two-way ANOVA between shWRNs and shRFP (f). For a–d, f, representative data from one experiment are shown. For e, data from two independent experiments are shown. All experiments were performed twice.
To evaluate chromosomal integrity with WRN silencing, we examined metaphase spreads of 2 MSI and 2 MSS cell lines with telomere-FISH 96 hours after shWRN1 induction. First, we asked if a telomere defect precipitates the synthetic lethal relationship given WRN’s role in telomeric protection15. WRN silencing induced DSB and fragmentation throughout chromosomes in MSI but not MSS cells. However, we did not observe specific telomeric defects such as increased chromosomal end-to-end fusions or telomeric signal loss. While we observed many MSI cells with chromosomal fragmentation upon WRN silencing, we also identified MSI cells with only a few DSBs (Figs. 4d, e, Extended Data Fig. 8a). Since this assay requires viable cells to cycle into metaphase, these data suggest that DSBs precipitate the lethal effects of WRN loss and are not merely a consequence of cell death.
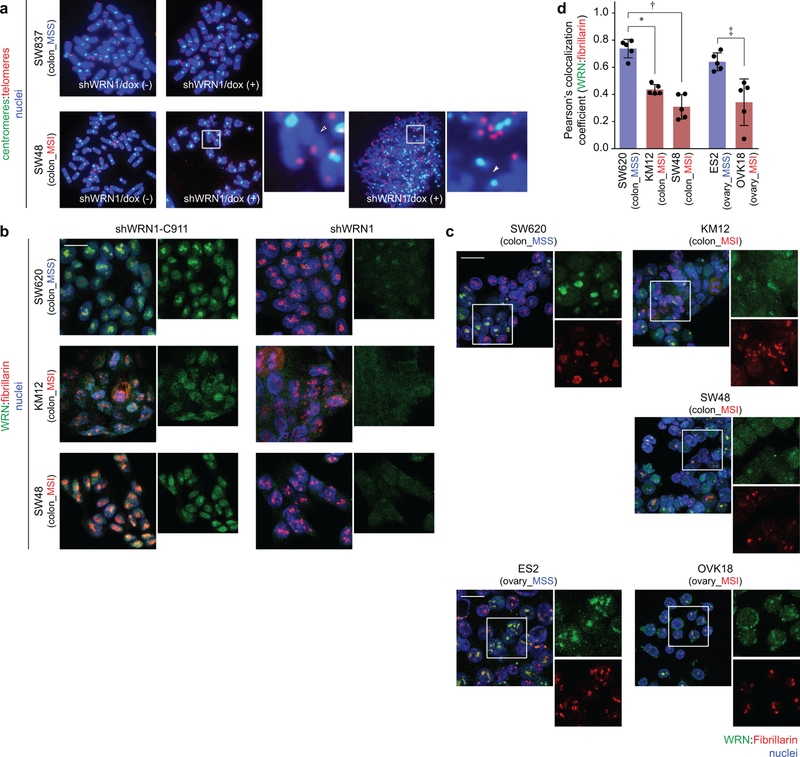
As our FISH data revealed diffuse DSBs in WRN-depleted MSI cells, we hypothesized that loci throughout chromosomes require WRN to maintain genomic stability with MSI. To support this hypothesis, we queried WRN localization with IF. After demonstrating the specificity of WRN IF staining (Extended Data Fig. 8b), we observed predominantly dispersed staining across the nucleoplasm in MSI cells but greater WRN co-localization with the nucleolar marker fibrillarin (Extended Data Figs. 8b–d) and less nucleoplasmic staining in MSS cells. Since WRN has been demonstrated to respond to DNA damage by disseminating from the nucleolus towards the nucleoplasm20, these data suggest WRN is recruited to maintain genomic integrity in MSI cells.
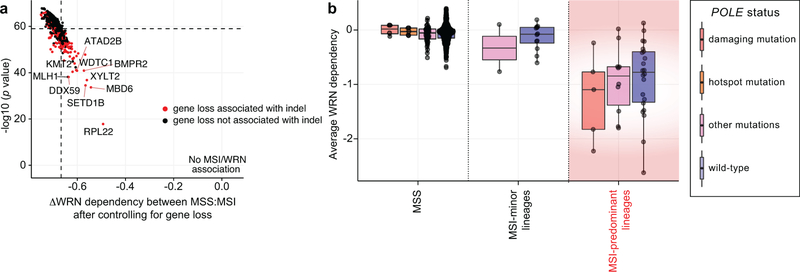
We next evaluated the relationship between dMMR and WRN dependency. We first asked if MSI leads to recurrent mutation and inactivation of another gene, creating a dependency upon WRN. Analogously, the second most significant dependency with MSI was RPL22L1, a dependency described in MSI due to inactivating mutation of its paralog, RPL2211 (Fig. 1c). Analyzing our screening dataset, we found no gene whose loss could account for the preferential dependency upon WRN with MSI (Extended Data Fig. 9a). We also found no increased WRN dependence in cell lines with hypermutation due to mutations of polymerase epsilon (POLE)21 (Extended Data Fig. 9b, Supplementary Table 1), suggesting that hypermutability alone cannot account for WRN dependency.
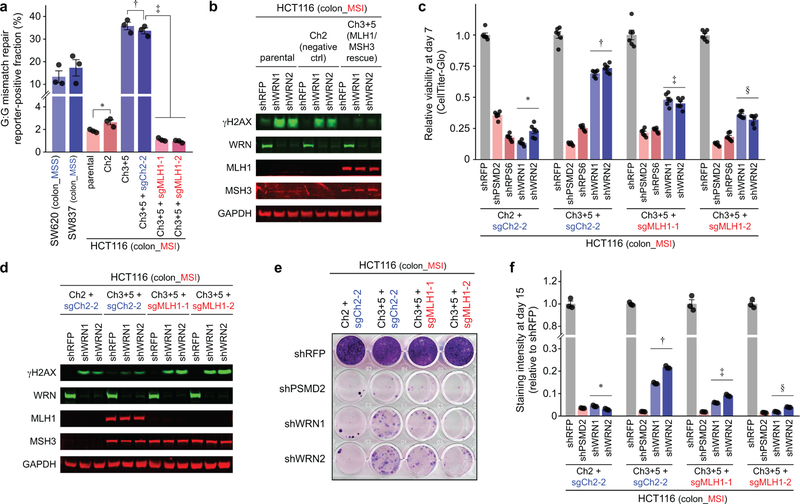
We then explored whether dMMR contributes to WRN dependence using a model wherein MMR activity of the MLH1- and MSH3-mutated MSI colorectal cell line HCT116 was restored by introducing chromosomes 3 and 5 (Ch3+5), carrying MLH1 and MSH3, respectively (Extended Data Fig. 10a)22. WRN knockdown led to ɣH2AX accumulation and impaired viability of parental HCT116 and control cells with an additional chromosome 2. By contrast, Ch3+5 transfer suppressed DSB accumulation and partially rescued viability from shWRN in a 7-day viability assay (Fig. 4f, Extended Data Fig. 10b). The rescue was indeed attributable to MMR restoration as CRISPR/Cas9 knock out of MLH1 re-sensitized HCT116 Ch3+5 to WRN silencing and induced DSB following WRN silencing (Extended Data Figs. 10c, d). Longer-term clonogenic assays with HCT116 cells established that rescue of WRN dependency is modest with MMR restoration, but abolished with MLH1 knockout (Extended Data Figs. 10e, f).
These data argue that dMMR alone contributes to but does not fully explain this synthetic lethal interaction, suggesting that genomic lesions which accumulate with MSI promote WRN dependence. The potential relevance of genomic lesion accumulation is consistent with our observation that MSI cells with fewer microsatellite deletions are less WRN dependent. Accumulating MSI defects could cooperate with dMMR to form genomic structures that require WRN to resolve. Such structures could include insertion-deletion loops23 and/or displacement loops (D-loops) between homeologous DNA sequences24,25, known substrates for MMR machinery. Indeed, dMMR in yeast creates a dependency on Sgs1, homolog of WRN and BLM, to resolve homeologous D-loops normally rejected by MMR26. Beyond WRN’s potential role in preventing DNA damage, loss of WRN’s role in non-homologous end joining and/or homologous recombination could further contribute to DSB accumulation15.
Our observations have revealed that WRN inactivation induces DSBs and activates DSB responses to promote cell death and cell cycle arrest preferentially in MSI cells. Although WRN and other DNA helicases have been nominated as therapeutic targets27, this work highlights WRN as a synthetic lethal target in MSI, defining a population where a WRN-based therapeutic could be deployed. Further studies will be needed to elaborate the intersecting roles of dMMR and genomic lesions in MSI with WRN dependence. While systemic WRN inhibition could induce complications akin to Werner Syndrome, the manifestations of this syndrome require decades to emerge28, suggesting that therapeutic benefits would greatly outweigh risks. Results from this study and the companion study by Behan F., Iorio F., et al.29 support the design of WRN helicase inhibitors to exploit WRN dependency in MSI cancers. More broadly, our findings highlight the power of large-scale cancer profiling efforts10–12,29,30 to identify cancer vulnerabilities and therapeutic biomarkers, illustrating how a Cancer Dependency Map11,30 can accelerate the development of precision therapy for patients.
Materials and Methods:
Genetic Dependency Data:
CRISPR dependency data were taken from the 18Q4 Avana dataset31. These data contain gene dependencies estimated for each gene and cell line using the CERES algorithm10. RNAi dependency data were derived from Novartis’ Project DRIVE11, and were reprocessed using the DEMETER2 algorithm32, which can be downloaded from the DEMETER2 figshare repo33. For some analyses (e.g. Extended Data Figs. 1e, 2c, d, 5g) we computed aggregate WRN dependency scores for each cell line by averaging together RNAi and CRISPR dependency scores (which are both normalized so that the median score of pan-essential genes is set at −1)10,34. For Extended Data Figs. 1c, 2a, 5g, 9b, the lower and upper hinges correspond to first and third quartiles (25th and 75th percentiles). The upper and lower whiskers extend to the largest value within 1.5*IQR (inter-quartile range) from the hinge. Gene dependency scores are normalized such that a value of 0 represents the median dependency score of negative control genes and −1 represents the median dependency score of sgRNAs targeting pan-essential genes.
Genomics Data:
Cancer cell line genomic data used in the analysis, including gene-level mRNA expression, gene-level relative copy number, and mutation calls, were taken from the DepMap 18Q4 data release12,34. RPPA protein abundance data were taken from the Cancer Cell Line Encyclopedia (CCLE)10,12,34. All cell line omics data can be downloaded at depmap.org. For Extended Data Figs. 2b, the lower and upper hinges correspond to first and third quartiles (25th and 75th percentiles). The upper and lower whiskers extend to the largest value within 1.5*IQR (inter-quartile range) from the hinge.
Cell Line Annotations:
Annotations of primary disease site for each cell line can found in the DepMap 18Q4 data release (https://depmap.org). The functional status of TP53 in 966 cell lines was annotated based on a combination of cell lines’ nutlin-3 sensitivity (GDSC - http://www.cancerrxgene.org) and Cancer Target Discovery and Development (CTD2 - https://ocg.cancer.gov/programs/ctd2/data-portal) datasets, along with a p53 target gene expression signature computed from CCLE data35.
Microsatellite classification:
MSI classifications were obtained from Phase II of the CCLE project12. These classifications were based on the total number of deletions detected in each cell line, and the fraction of deletions in microsatellite (MS) regions, using several different data sources (CCLE WES, CCLE WGS, CCLE hybrid capture, and Sanger WES). These features were then used to classify each cell line as MSI, MSS, or indeterminate. Unless otherwise indicated, our analysis excluded cell lines classified as ‘indeterminate’. When plotting the number of MS deletions and fraction of deletions in MS regions (Fig. 1B, Extended Data Fig. 1a), we averaged these values across the data sources available for each cell line after normalizing for systematic differences between data sources. Specifically, we used linear regression models to estimate and remove scale and offset differences between data sources so that the normalized number of deletions (and number of deletions in MS regions) measured in each data source was equal on average. These normalized average number of MS deletions and fraction of deletions in MS regions are provided in Supplementary Table 1.
MMR Status:
MMR status was determined based on omics data for the genes MSH2, MSH6, MLH1, and PMS2. For each gene we determined whether it was mutated (any detected mutation classified as deleterious), deleted (relative log2 copy number < −1), or lowly expressed (log2 TPM mRNA expression < 1). A gene was classified as inactivated if any of the above criteria were met, and cell lines where any of these MMR genes were inactivated were classified as having ‘MMR loss’. The MMR status for cell lines where we did not have either gene expression or copy number data available were classified as “NA”. In addition, we annotated MSI cell lines as having low protein expression of MSH2 and MSH6 if they had protein levels < −1 in the RPPA data (Supplementary Table 1). RPPA data were not used for calling MMR loss however, as we were missing RPPA data for many cell lines, and MMR loss was detectable from other omics data in most cases. We also classified cell lines’ POLE mutation status as either ‘damaging’, ‘hotspot-missense’, or ‘other’ using the “Variant_Annotation” column of the CCLE mutation file.
Differential dependency analysis:
Genes that were preferentially dependent in MSI compared to MSS cell lines were identified using linear modeling performed in parallel across genes using the R package Limma36. We estimated the difference in mean dependency between MSS and MSI cell lines for each gene, and associated P values were derived from empirical-Bayes moderated t-statistics. Q values were computed using the Benjamini-Hochberg method37.
Dependency and biomarker analysis:
To compute the predictivity of gene dependencies from different biomarkers, we first called each cell line as dependent or not, by thresholding the average of the CRISPR- and RNAi-based dependency scores at a value of −0.5. We then computed the positive predictive value (PPV) and sensitivity for each biomarker/dependency relationship. WRN dependency was predicted using MSI status either across all cell lines, or within common-MSI lineages only. For comparison analyses, we performed equivalent analysis on several canonical biomarker/dependency relationships: KRAS dependency predicted by KRAS hotspot missense mutations, BRAF dependency predicted by BRAF hotspot missense mutations, MDM2 dependency predicted by TP53 wild-type vs mutant (including ‘damaging’, ‘hotspot-missense’, and ‘other’ non-silent mutations), PIK3CA dependency predicted by PIK3CA hotspot missense mutations, ERBB2 dependency predicted by ERBB2 amplification (log2 relative copy number > 2), NRAS dependency predicted by NRAS hotspot missense mutations, CTNNB1 dependency predicted by APC damaging mutations.
Assessing potential WRN synthetic lethality:
To assess whether loss of function of any particular gene could account for WRN dependency, we determined the functional status of each gene (loss or not) in the same way as described above for MMR gene loss. For each gene, we then used a linear regression model to assess the contribution of both MSI status and loss of the gene to predicting WRN dependency (average of CRISPR and RNAi dependency scores). In Extended Data Fig. 9a, we plot the linear model coefficients, and associated P values, for MSI status accounting for loss of each gene.
mRNA-sequencing:
Cas9-expressing cells (SW48, and OVK18) were lentivirally transduced with the following sgRNAs: sgCh2–2, sgWRN2, and sgWRN3 (sequences provided below). Cells were selected with puromycin and RNA was purified 72 hours after transduction. This was performed in duplicate prior to cDNA library preparation and subsequent RNA-sequencing via the Illumina NextSeq 500 performed by the Molecular Biology Core Facilities at the Dana-Farber Cancer Institute (DFCI). This experiment was performed once with 2 biological replicates.
Differential expression analysis:
We first excluded genes which had less than 1 count per million in more than half of the samples. The weighted trimmed mean of M-values38 method was used to normalize the library size of each sample, using the calcNormFactors function from the R package: edgeR39. To estimate the log-fold change (LFC) effect of WRN knockout on each gene in each cell line we used the R package Limma36. Specifically, we fit a linear model for the expression of each gene, using cell line and sgRNA (WRN vs. control) as covariates. Read counts data were transformed using the Limma function ‘voom’ prior to model fitting, in order to model the mean-variance relationship of the log-counts data40. We then extracted LFC effect sizes and empirical-Bayes moderated t-statistics for the WRN knockout effect for each gene and cell line. Gene set enrichment analysis (GSEA)41 was run to test for gene sets that were up- or down-regulated in each cell line after WRN knockout. In particular, we used the R package fgsea42 to estimate normalized enrichment statistics, and associated P values, for each gene set in the Hallmark Collection from the Molecular Signatures Database43. The GSEA algorithm was run using t-statistics as the gene-level statistics, 1 million random permutations for each cell line tested, and a “GSEA parameter” of 1.
Cell Line and Reagents:
ES2, OVK18, SW620, SW837, KM12, SW48, GCIY, SNU1, HEC50B, and SNGM were collected by the CCLE prior to distribution for our use. The sources of the aforementioned cell lines can be found at depmap.org and are as follows. ES2, SW620, SW837, SNU1, and SW48 were originally obtained from the American Type Culture Collection (ATCC). KM12 was originally obtained from an academic lab and can be obtained as part of the NCI-60 cell lines. GCIY and OVK18 were originally obtained from the RIKEN Cell Bank. SNGM and HEC50B were originally obtained from the Health Science Research Resources Bank (HSRRB). Their identities were confirmed by SNP microarray. HCT116 and its various derivatives were generously provided by Drs. Richard Boland, Ajay Goel and Minoru Koi22. The aforementioned cell lines can be obtained from their respective sources. All cell lines were grown in media supplemented with 10% fetal bovine serum (FBS), penicillin (100 µg/mL) / streptomycin (100 µg/mL) / L- glutamine (292 µg/mL; Gibco) unless otherwise stated. KM12, SW48, SW837, ES2, and SNU1 were cultured in RPMI-1640 (Gibco); OVK18 was cultured in MEMɑ; GCIY was cultured in MEMɑ supplemented with 15% FBS; SW620 was cultured in Leibovitz’s L-15 (Gibco); SNGM was cultured in Ham’s F12 with 20% FBS (Gibco); HEC50B was cultured in EMEM (ATCC) supplemented with 15% FBS; HCT116 was cultured in McCoy’s 5A (Gibco). Stable Streptococcus pyogenes Cas9-expressing cell lines generated by lentiviral transduction of the pXPR_BRD111 construct were from Project Achilles10. pXPR_BRD111 is available from Addgene (plasmid #78166).
CCLF_CORE_0001_T, was obtained from a 58 year old female patient with stage II MSI-H (determined by IHC loss of MLH1/PMS2 with MLH1 promoter methylation). All samples were obtained with patients’ informed consents at the DFCI. All procedures were conducted under an DFCI Institutional Review Board approved protocol. Samples were collected by translational research staff and labeled with a unique identifier prior to samples being processed and analyzed in the lab. Per the protocol, the link to protected health information was maintained within a database with access limited to select research staff. Samples were handled according to the medical ethical guidelines described by the Dana-Farber/Harvard Cancer Center (DF/HCC) Office for Human Research Studies. Patient tumor resections were placed in a sterile conical tube containing DMEM media (Thermo Fisher Scientific, cat #11995073) with 10% FBS (Sigma Aldrich, cat. #F8317), 1% penicillin-streptomycin (Thermo Fisher Scientific,cat. #15140163), 10ug/ml of gentamicin and 250 ng/ml fungizone on wet ice during transport from the operating room to the research laboratory. Resections were placed in a 15ml conical flask with 5 ml DMEM media, 10% FBS, 1% penicillin-streptomycin, and the digestion enzymes regular collagenase 1 ml (StemCell #07912) and dispase 1 ml (StemCell Technologies #07913). The flask was placed on a rotator and incubated at 37°C for 1 hour. The cells were then centrifuged at 1,000 rpm for 5 min. Cell pellets were resuspended and later embedded into Matrigel (Corning #356231) as per the previous published protocol44. CRC organoids were passaged using iced-cold PBS and Gibco TrypLE Express (Thermo Fisher Scientific # 12604039) when the cells reached 80–90% confluence. CCLF_CORE_0001_T will be deposited to a third-party distributor at a later date.
All cell lines tested negative for mycoplasma.
Generation of ectopic WRN cDNA expressing cell lines:
The catalytically active version, exonuclease-dead (E84A), helicase-dead (K577M), and dually exonuclease and helicase-dead (E84A/K577M) versions of WRN cDNA were a gift from Raymond Monnat (Addgene plasmids # 46038, 46036, 46035, and 46037, respectively). The missense mutant forms of WRN have been previously demonstrated to lack their indicated enzymatic activity14. The WRN sequence was cloned into a modified lentiviral expression vector, pLX_TRC209, under an EF1a promoter and modified to contain a neomycin selectable marker. Sanger sequencing of the vectors and genomic DNA after integration were performed to confirm sequence identity. Lentivirus was produced as described below and transduced into dually Cas9/Firefly-luciferase expressing KM12 to create stable ectopic WRN cDNA expressing cell lines.
Lentiviral production:
Lentiviral production was performed using HEK293Ts as described on the GPP portal (https://portals.broadinstitute.org/gpp/public/).
sgRNAs:
sgRNAs used in the validation studies were designed using the Broad Institute Genetic Perturbation Platforms sgRNA Designer (https://portals.broadinstitute.org/gpp/public/analysis-tools/sgrna-design). sgRNAs targeting WRN include sgWRN1 (target sequence GTAAATTGGAAAACCCACGG), sgWRN2 (ATCCTGTGGAACATACCATG), sgWRN3 (GTAGCAGTAAGTGCAACGAT). sgRNA targeting the exon-intron junction (sgWRN-EIJ) were designed using the DESKGEN Cloud tool (https://www.deskgen.com/landing/cloud.html). The target sequence for sgWRN-EIJ is AGCACGTACATAAGCATCAG. Two negative controls targeting intergenic sites on chromosome 2 were utilized: sgCh2–2 (GGTGTGCGTATGAAGCAGTG) and sgCh2–4 (GCAGTGCTAACCTTGCATTG). Two pan-essential controls targeting POLR2D (AGAGACTGCTGAGGAGTCCA) and MYC (ACAACGTCTTGGAGCGCCAG) were used. sgRNAs were inserted in the pXPR_BRD003 lentiviral vector and inserts were verified by Sanger sequencing. sgRNAs targeting MLH1 include sgMLH1–1 (TTTGGCCAGCATAAGCCATG) and sgMLH1–2 (GCCAGCACATGGTTTAGGAG). sgRNAs targeting MLH1 were inserted in the pXPR_BRD051 lentiviral all-in-one vector which also expresses Cas9.
shRNAs:
shRNA targeting WRN were chosen from Project DRIVE. shRNA targeting WRN include shWRN1 (CAGCACTGCCAATGGTTCCAA) and shWRN2 (GCCTTAACAGTCTGGTTAAAC). Positive pan-essential controls include shPSMD2 ( CGCCAGTTAGCTCAATATCAT) and shRPS6 (CCGCCAGTATGTTGTAAGAAA). shRFP (CTCAGTTCCAGTACGGCTCCA), shWRN1-C911 (CAGCACTGGGTATGGTTCCAA) and shWRN2-C911 (GCCTTAACTCACTGGTTAAAC) were used as negative controls. These shRNAs were inserted into pLKO.1 puro (Addgene #8453) for constitutive expression and pRSITEP-U6Tet-(xx)-EF1-TetRep-2A-Puro (Cellecta #SVSHU6TEP-L) for doxycycline-inducible shRNA expression. All in vitro experiments used 0.2 μg/mL of doxycycline for induction of shRNAs.
Immunoblotting:
For immunoblotting, cells were lysed in RIPA buffer (Sigma) supplemented with complete Protease Inhibitor Cocktail (Roche, 11697498001) and a Halt Phosphatase Inhibitor Cocktail (Thermo Fischer Scientific, 78428). For etoposide and hydroxyurea treatment (Fig. 4a), cells were treated with 10 µM etoposide and 1 mM hydroxyurea, respectively, 6 hours before harvesting. Lysates were fractionated in 4–12% Bis-Tris gels (Invitrogen), which was then transferred to PVDF membranes (Immobilon-FL PVDF Millipore, IPFL00010) and blocked for an hour with Odyssey Blocking Buffer (PBS) (LI-COR Biosciences, 927–40000). Types of primary antibodies and the dilutions used for immunoblotting were as follows: anti-phospho-Chk2 [T68] (R&D Systems, AF1626, 1:400); anti-(total) Chk2 (Cell Signaling Technology, 3440, 1:1000); anti-ɣH2AX (Cell Signaling Technology, 9718, 1:1000); anti-GAPDH (Cell Signaling Technology, 5174, 1:1000); anti-MLH1 (Cell Signaling Technology, 3515, 1:1000); anti-MSH3 (BD Biosciences, 611390, 1:400); anti-WRN (Novus Biologicals, nb100–472, 1:1000). We used the following secondary antibodies: Goat anti-Rabbit IRDye 800CW (LI-COR, 926–32211, 1:5000), Goat anti-Rabbit IRDye 680LT (LI-COR 926–68021), and Goat anti-Mouse IRDye 800CW (LI-COR, 926–32210). Subsequent steps of immunoblotting were conducted using Near Infrared (NIR) Western Blot Detection system (LI-COR Biosciences) as per manufacturer’s recommendations. We performed the immunoblots three times except for Figs. 2e, 4a and Extended Data Figs. 7e, 10b, d which were performed twice. Shown are representative results from one experiment.
Immunofluorescence:
Immunofluorescence (IF) was conducted essentially as described previously45 (except for the double staining for WRN and fibrillarin; see below). Briefly, 2 days after lentiviral transduction, cells were seeded either on an 8-Well Lab-Tek Chamber Slide (Thermo Fisher Scientific, 177402) or on a 96-Well Clear Bottom Black Polystyrene Microplate (Thermo Fisher Scientific, 3904). The numbers of cells seeded per well were following: 1×10⁶ (5×10⁵), 1.2×10⁶ (6×10⁵), 1.6×10⁶ (8×10⁵), 6×10⁵ (3×10⁵), and 8×10⁵ (4×10⁵) cells for SW620, KM12, SW48, ES2, and OVK18 cells, respectively [numbers represent seeding densities for 8-well chamber (96-well plate)]. Cells were fixed and stained 2 days later. Micrographic images were acquired using either epifluorescence microscopy (for Figs. 3b; Extended Data Figs. 5a, c, e) or confocal microscopy (for Fig. 4b; Extended Data Figs. 6b, e, g, 7a, c), which were performed on an Axio Observer.Z1 microscope equipped with an Axiocam 506 mono camera and Apoptome.2 (Carl Zeiss) and a Zeiss LSM 700 laser scanning confocal system equipped with Axio Observer (Carl Zeiss), respectively. These confocal microscopy images represent maximum intensity projections of 5 consecutive planes with a step size of 0.08 µm. For image quantification, images were acquired using an Opera Phenix High-Content Screening System (PerkinElmer, HH14000000) and analyzed on Harmony High Content Imaging and Analysis Software (PerkinElmer, HH17000001). For phospho-p53-, p21-, ɣH2AX- and phospho-ATM-staining, signal intensities in the nucleus of at least 1000 cells/sample were scored on background-subtracted images and presented as box plots. The lower and upper limits of the box plot represent 25th and 75th percentiles, respectively and the bar in the middle of the box represent the median value. The low and high error bars represent 1st and 99th percentiles, respectively. Outliers are represented as dots. To score the patterns of nuclear staining, cells exhibiting mean signal intensity of 12000 or higher (for ɣH2AX; all cell types) [20,000 or higher for phospho-ATM, except for KM12 and SW48, for which ‘40,000 or higher’ and ‘10,000 or higher’ were used to identify cells with pan-nuclear phosphor-ATM staining patterns, respectively] were first separated as cells with ‘pan-nuclear’ pattern of staining. For the rest of the cells, the number of foci within the nucleus was scored using a spot-detection program in the software. The relative abundance of cells exhibiting pan-nuclear staining and that of cells harboring specific number of foci were plotted. The number of nuclear foci observed in cells expressing the Apple-53BP1-trunc fluorescent marker were scored similarly (Extended Data Figs. 6f, h). To assess differences between the effects of WRN knockout on IF intensity values in MSI versus MSS cell lines, we used a linear model approach. Specifically, linear models were fit to the log-intensity values with guide and cell line intercept terms. Comparisons of the change in log-intensity after WRN knockout between cell lines were then obtained using the ‘contrast’ function of the R package lsmeans46.
IF for WRN and fibrillarin was performed as previously described47. Images were obtained via the Zeiss LSM510 Upright Confocal System for Extended Data Figs. 8b, c. Weighted Pearson co-localization coefficients were calculated by obtaining Z-stacks of 5 representative high-powered fields at 63x magnification and scored via the Zeiss Zen Blue software. Significance was calculated by two-tailed t-test for MSI cell lines compared to lineage-matched MSS cells (Extended Data Fig. 8d).
Types of primary antibodies and the dilutions used for immunofluorescence were as follows: anti-ɣH2AX (Millipore Sigma, 05–636, 1:400); anti-p21 (Santa Cruz Biotechnology, sc-6246, 1:100); anti-phospho ATM [S1981] (Millipore Sigma, 05–740, 1:200); anti-phospho Chk2 [T68] (R&D Systems, AF1626, 1:100); anti-fibrillarin (Abcam, ab5821, 1:500); anti-phospho p53 [S15] (Cell Signaling Technology, 9284, 1:100); anti-WRN (Sigma, W0393, 1:200).
For all IF experiments except for the double staining for WRN and fibrillarin, the secondary antibody was Goat anti-rabbit IgG, Alexa Fluor 488 (Thermo Fisher Scientific, A11008) and Goat anti-mouse IgG, Alexa Fluor 488 (Thermo Fisher Scientific, A11001), which were used at a 1:200 dilution. For WRN and fibrillarin IF, Goat anti-mouse IgG, Alexa Fluor 488 (Thermo Fisher Scientific, A-11001) and Goat anti-rabbit IgG, Alexa Fluor 555 (Thermo Fisher Scientific, A-21428) were used at 1:1000 dilution. Following secondary antibody treatment, the nuclei were counterstained with 4′,6-Diamidine-2′-phenylindole dihydrochloride (DAPI [Sigma, S9542]; 1 µg/ml). All IF experiments were performed twice. Shown are representative results from one experiment.
Cell Viability Assay:
Cas9-expressing versions of the following cell lines were seeded in 100 µL of media in 96-well plates (Corning 3904) excluding edge wells at the following densities: ES2 103 cells/well, OVK18 1.5×10³ cells/well, SW620 2×10³ cells/well, KM12 2×10³ cells/well, SW837 2.5×10³ cells/well, SW48 2.5×10³ cells/well, GCIY 2×10³ cells/well, SNU1 1.5×10³ cells/well, HEC50B 1.75×10³ cells/well, SNGM 1.5×10³ cells/well. All cell lines except SNU1 were seeded the day prior to transduction. SNU1 (suspension line) was seeded on the day of transduction with 4 µg/ml polybrene. For the adherent cell lines, media was changed to media containing 4 µg/ml polybrene. Viral concentrations were pre-determined to achieve > 90% infection efficiency. Experiments were performed in triplicate by adding the appropriate volume of lentivirus to integrate vectors encoding the desired sgRNA and the plates were spun at 931 RCF for 2 hours at 30°C. The media was changed the next day and every 3 days thereafter. Cell viability was assayed using CellTiter-Glo (Promega G7572) at 33 µL per well. Luminescence was read using PerkinElmer EnVision 2105. Values were normalized to the average values from the negative control sgRNAs for each cell line. Experiments were performed three times. Shown are the triplicate results of one representative experiment. Two-way ANOVA was used to test differences between the set of sgWRNs or shWRNs and negative control(s), while modeling individual sg/sh differences (Figs. 2a, 4f, Extended Data Fig. 10c).
For CCLF_CORE_0001_T, 5×10⁴ cells were seeded into 40 μL Matrigel domes in a 24 well plate in quadruplicate, with two wells with and two wells without 0.2 μg/mL of doxycycline. Media was refreshed every 2–3 days. Nine days after doxycycline treatment, cell viability was assayed by first aspirating the media, adding 300μL of CellTiter-Glo 3D (Promega G9681), and incubating at room temperature for 45 mins on a shaker. 90μL x 3 were taken from each well were transferred to a 96 well plate (Corning 3904) for three technical replicates each from two biological replicates. Luminescence was read as above. Values are presented as the mean ratio of luminescence signal from the dox treated condition compared to the no dox condition with error bars representing the standard error unless otherwise stated. Two-tailed t-test was performed between each shWRN and its corresponding seed control shRNA (Fig. 2g). This experiment was performed twice and we presented data from one experiment.
Luciferase Competitive Growth Assay:
Dual Cas9/Firefly-luciferase and Renilla-expressing cells were generated by transduction of Firefly-luciferase cDNA and Renilla-luciferase cDNA, respectively, in a pLX_TRC313 lentiviral expression vector containing a hygromycin-resistance gene. After selection, these two versions of a cell line were co-seeded in a 96 well plate at the following densities per well for each version: ES2 2×10³ cells/well, OVK18 3×10³ cells/well, SW620 4×10³ cells/well, KM12 4×10³ cells/well. The following day, transduction was performed in sextuplicate and media was changed to include puromycin the day after transduction. Cells were split and assayed with the Dual-Glo Luciferase Assay System (Promega) per the manufacturer’s recommendations every 3–4 days. Luminescence was determined by the Perkin Elmer EnVision 2105. Values are presented as the ratio of firefly to renilla luciferase luminescence signal per condition and normalized to the mean of the corresponding negative control sgRNAs for each cell line. Fig. 2c and Extended Data Fig. 3b were performed thrice. Two-tailed t-test was performed when comparing single sgRNAs (Fig. 2c). Two-way ANOVA was performed when multiple WRN sgRNAs were compared to negative controls (Extended Data Fig. 3b).
Clonogenic assay:
Cells were transduced with lentivirus expressing indicated shRNAs. 24 hours later, medium was replaced with medium containing 2 µg/mL puromycin. After 24 hours of puromycin selection, lentivirally-infected cells were detached with trypsin and reseeded onto a 24 well plate. The number of cells seeded per well were following: 3×10³, 4×10³, 6×10³, 1×10⁴, 8×10³, 8×10³, and 1.2×10⁴ cells for ES2, OVK18, SW620, SW837, KM12, SW48 and HCT116 cells, respectively. Cells were subsequently propagated for 2 weeks in puromycin-free media, which was changed every 3 days. For crystal violet staining, cells were fixed with 10% formalin for 30 min at room temperature (RT) and subsequently stained with 250 µL/well of 0.1% crystal violet in 70% ethanol for 30 min at RT with constant shaking. To remove unbound crystal violet, cells were washed with deionized water 3 times each for 5 min. Quantification was performed by extracting the crystal violet dye with 250µL of 10% acetic acid. 50 µL were transferred into a 96-well format in triplicate. The experiment was performed three times for Extended Data Figs. 3c, d and two times for Extended Data Fig.10e, f. Crystal violet absorbance was determined by the Perkin Elmer EnVision 2105. Shown are the results of one representative experiment with quantification demonstrating repeat measurements from a single experiment. Two-way ANOVA was performed for Extended Data Fig. 10f, where HCT116 Ch3+5 sgCh2–2 was compared to HCT116 Ch2 + sgCh2–2 and HCT116 Ch3+5 sgMLH1s were compared to HCT116 Ch3+5 sgCh2–2.
Cell Cycle Analysis:
Cas9-expressing cell lines were lentivirally transduced to deliver the desired sgRNAs or shRNAs. Media was changed the next day to allow for antibiotic selection. Four and seven days after the lentiviral transduction, cells were labeled with EdU, harvested, and stained as per the Click-iT™ Plus EdU Flow Cytometry Assay Kit recommendations. Stained cells were then examined with flow cytometry and results analyzed with FlowJo v10. Shown is a representative result of two independent experiments, each of which was conducted in triplicates. Statistical analysis of the proportion of cells in S-phase versus sgCh2–2 was calculated by two-way ANOVA (Extended Data Fig. 4b).
Apoptosis Assay:
Cas9-expressing cell lines were lentivirally transduced to deliver vectors encoding the desired sgRNAs or shRNAs. Media was changed the next day without antibiotic selection. Cells were split 4 days post transduction. Seven days post-transduction, cells were harvested to allow for Annexin V-FITC and Propidium Iodide staining. Stained cells were then examined with flow cytometry and results analyzed with FlowJo. Shown is a representative result of two independent experiments, each of which was conducted in triplicates. Significance was calculated for the sum of the proportions of cells in early apoptosis, late apoptosis and nonapoptotic death categories; vs. sgCh2–2 (control sgRNA) by two-way ANOVA (Extended Data Figs. 4c, d).
In vivo xenograft studies:
Studies were approved by the Broad Institute’s Institutional Animal Care and Use Committee (IACUC) under animal protocol 0194–01-18. IACUC guidelines on the ethical use and care of animals were followed. For growth curves, 106 KM12-shWRN1 or KM12-shWRN1-C911 cells were inoculated subcutaneously into right hind flank of ~8 week old female SCID Hairless Outbred (SHO) mice obtained from Charles River Laboratories. Tumors were measured twice weekly with calipers and the tumor volumes were calculated using the formula pi/6 x (width2 x length). When primary tumors reached ~100 mm3, the mice were randomized onto Control Teklad Global 18% Protein Rodent Diet or Teklad Global 18% Protein Rodent Diet containing 625 mg/kg doxycycline hyclate. Mice remained on their respective diets throughout the remainder of the study. Animal body weights were recorded twice weekly during the course of the study for body condition scoring. For the growth curves, n = 5 (4 from d15–18), 5, 4, 4 for shWRN1/Dox(−), shWRN1/Dox(+), shWRN1-C911/Dox(−), shWRN1-C911/Dox(+), respectively. One KM12 shWRN1/Dox(−) mouse was euthanized before day 15 due to tumor ulceration. No experiments exceeded the maximal tumor volumes of 2000 mm3 set forth by the IACUC. This study was not blinded. Sample size calculation was not performed. For target engagement, one mouse per time point was inoculated in the right and left hand flanks. To compare xenograft tumor growth curves across experimental conditions we used a linear mixed model describing the % increase in tumor volume as a linear function of time, with random slope terms per mouse, and an interaction term between growth rate and experimental condition. Maximum likelihood models were fit using the R package lme448. Reported P values assessing the significance of interactions between growth rate and experimental conditions were derived using a likelihood ratio-test. Tumors were harvested at the indicated time points. Fig. 2d. was conducted once. The IB for this experiment (Fig. 2e) was performed twice from the same protein lysates.
Telomere PNA-FISH of metaphase spreads:
3×10⁶ cells were plated in 10cm dishes in the absence of dox. For cells treated with dox, 0.2μg/ml of dox was added and refreshed every 48 hours. After 96 hours after adding doxycycline, cells were treated with 10 ug/ml of colcemid for 3 hours and then detached with trypsin. Half of the cell pellet was saved for immunoblot analysis. The other half of the cell pellet was treated with a hypotonic solution (60mM KCl) and fixed with a 3:1 ratio of Methanol:Acidic Acid. Metaphases were spread onto a slide and fixed with 3% formalin. The PNA-FISH probe [(CCCTAA)3 PNA-probe (PNA Bio)] was applied onto the slides and denatured at 850C for 3min. The slides were washed with washing solution I (70% Formamide, 0.1% Tween-20, 0.1% BSA in 10mM Tris buffer, pH 7.5) twice and three times with washing solution II (150mM NaCl, 0.1% Tween-20, 0.1% BSA in 50mM Tris buffer, pH 7.5). Cy5-ATTCGTTGGAAACGGGA was used to label centromeres. Images were captured with a Nikon Eclipse 80i microscope and processed with software NIS-Elements BR. 30 to 60 metaphases were analyzed for cells of the indicated conditions. Two-tailed t-test was performed (Fig. 4e). These experiments were performed twice.
Fluorescence-based Multiplexed Host Cell Reactivation (FM-HCR) assays:
These assays to assess MMR impairment in isogenic HCT116 cells were carried out as previously described49. SW620, SW837, HCT116 and its derivatives were harvested as a subconfluent population (<85%) and electroporated with FM-HCR reporter plasmids (50ng pmaxOrange_GG for mismatch repair with 50ng pmax_mPlum as transfection control or 50ng pmax_mOrange as undamaged control and 50ng pmax_mPlum as transfection control) and carrier DNA in a 10 μLvolume using the ThermoFisher Neon transfection system (1200V, 20ms, 2 pulses). Percentage reporter expression was calculated as previously reported for MMR reporters49. Approximately 2×10⁵ transfected cells were seeded into 12 well culture plates and analyzed by flow cytometry at 24 hours post-transfection. These experiments were performed three times. Two-tailed t-test was performed when comparing HCT116 parental to HCT116 Ch2 and HCT116 parental to HCT116 Ch3+5. Two-way ANOVA was performed when comparing HCT116 3+5 + sgCh2–2 to HCT116 Ch3+5 sgMLH1–1 and HCT116 Ch3+5 sgMLH1–2 (Extended Data Fig. 10a).
Code/Data Availability
Source data for Figs. 2a–g, 3c, 4a, c, e, f, and Extended Data Figs. 3a, b, d, 4b–d, 5b, d, f, 6a, c, d, f, h, 7b, d, e, 8d, 10a–d, f are provided with the paper. mRNA-seq data (shown in Fig. 3a) have been deposited in the Gene Expression Omnibus (GEO) repository under accession number GSE126464. DepMap omics and dependency data used in analysis are available as a Figshare repository: Cancer Data Science. DepMap Datasets for WRN manuscript. (2019). doi:10.6084/m9.figshare.7712756.v1.
Code used for analysis can be found at https://github.com/cancerdatasci/WRN_manuscript. All materials can be accessed at https://depmap.org/WRN
Extended Data
Extended Data Fig. 1. Functional genomic screening identifies WRN as a selective dependency with MSI.
a, Screened cell lines plotted by number of deletions and fraction of deletions occurring in microsatellite (MS) regions. Loss of genes involved in MMR are indicated by color. b, Using PCR-based MSI phenotyping, the FDR-adjusted Q values (Benjamini–Hochberg procedure) were plotted against the mean difference of dependency scores between MSI and MSS cell lines for Projects Achilles (n = 19 MSI, 291 MSS) and Project DRIVE (n = 23 MSI, 252 MSS). c, Dependency scores for each RecQ helicase plotted for MSI and MSS cell lines from Projects Achilles and DRIVE (n = as per b). Q values (Wilcoxon rank-sum test) for Achilles/DRIVE = 5.0×10⁻⁸/1.7×10−8; 0.73/0.52; 0.73/0.85; 0.25/0.73; 0.08/NA for WRN, REQL, BLM, RECQL5, and RECQL4, respectively. Lower, upper hinges: 25th, 75th percentiles, respectively. Lower, upper whiskers: lowest, largest value within 1.5*IQR (inter-quartile range) from the hinge, respectively. d, Sensitivity and positive predictive value of indicated biomarker/genetic dependency relationship. e, Dependency score distributions and associated biomarkers for example biomarker/dependency relationships. Colored regions represent density estimates. Horizontal dashed line: threshold used to separate dependent and non-dependent cell lines. n = 120/546 KRAS hotspot mutants/other; 65/601 BRAF hotspot mutants/other; 86/580 PIK3CA hotspot mutants/other.
Extended Data Fig. 2. MSI cells from MSI-predominant lineages possess greater mutational burden and WRN dependency.
a, WRN dependency scores plotted by lineage, sub-classified by MSI and MSS status. Lower, upper hinges: 25th, 75th percentiles, respectively. Lower, upper whiskers: lowest, largest value within 1.5*IQR (inter-quartile range) from the hinge, respectively. b, MS deletions in cell lines classified as MSS (n = 541), MSI from an infrequent MSI lineage (n = 45), or MSI from an MSI-predominant lineage (n = 54). P value = 1.7×10⁻⁹ (*), Wilcoxon signed-rank test. Lower and upper hinges: 25th and 75th percentiles, respectively. Lower, upper whiskers: lowest and largest value within 1.5*IQR (inter-quartile range) from the hinge, respectively. c, MSI cell lines plotted by their average WRN dependency and number of MS deletions. Lineages are color-labeled. d, MSI cell lines from MSI-predominant lineages are plotted by their average WRN dependency and number of MS deletions. Lineages are color-labeled.
Extended Data Fig. 3. WRN depletion preferentially impairs MSI cell viability.
a, IB. WRN, GAPDH levels 4 days following sgRNA transduction. b, Relative viability following sgRNA transduction in a competitive growth assay. Center values: means ± SEM (n = 6 biological replicates). P values (two-way ANOVA) between sgWRNs and negative controls at day 10: 0.37 (∗), 1.2×10⁻⁷ (†), 0.23 (‡), 2.7×10⁻¹⁹ (§). c, Clonogenic assay following sgRNA transduction. Non-targeting negative control (shRFP), pan-essential control (shPSMD2), and 2 shRNAs targeting WRN (shWRN1, shWRN2). d, Relative staining intensity of the clonogenic assay. Data shown: means ± SEM (n = 3 technical replicates). For Extended Data Fig. 3, representative data from one experiment are shown. All experiments were performed three times.
Extended Data Fig. 4. WRN depletion preferentially induces cell cycle arrest and apoptosis in MSI cells.
a, Gating strategy. For cell cycle analyses (top), debris and dead cells were excluded based on forward scatter-area (FSC-A) and side scatter-area (SSC-A) profiles. Subsequently, singlets were identified based on FSC-A and forward scatter-height (FSC-H) profiles. These singlets were then analyzed for DAPI (DNA content) and EdU-Alexa Fluor 647 (EdU-647) staining intensities. EdU-647-positive cells (cells exhibiting higher staining intensity than unstained cells) were classified as ‘S-phase’. EdU647-negative cells were classified either as ‘G1-phase’ or ‘G2/M-phase’ based on their DNA content. For apoptosis analyses (bottom), debris were excluded based on FSC-A and SSC-A profiles. The remaining samples were analyzed for Annexin V-FITC and propidium iodide (PI) staining intensities. Subsequently, Annexin V-FITC-positive cells and PI-positive cells (cells exhibiting higher staining intensity than unstained cells) were identified. Based on the positivity of these markers, cells were classified into either of the following three categories: Viable (Annexin V-negative, PI-negative), Early Apoptosis (Annexin V-positive, PI-negative), and Late Apoptosis/Nonapoptotic death (PI-positive). b, Cell cycle evaluation 4 days after sgRNA transduction. P values (two-way ANOVA) comparing sgCh2–2 vs sgWRNs for % S-phase cells: 0.16 (∗), 0.67 (†), 6.1×10⁻⁷ (‡), 3.5×10⁻⁴ (§) 0.69 (||), 2.6×10⁻⁶ (¶). c, Annexin V/propidium iodide (PI) staining evaluating early apoptosis and late apoptosis/non-apoptotic cell death 7 days following sgRNA transduction. P values (two-way ANOVA between sgCh2–2 and sgWRNs for % dying/dead cells): 0.10 (∗), 0.41 (†), 3.4×10⁻³ (‡); 3.6×10⁻⁴ (§), 0.57 (||), 3.6×10⁻⁵ (¶). d, Annexin V/PI staining 4 and 8 days following shRNA transduction. P values (two-way ANOVA comparing shRFP and shWRNs): 1.3×10⁻³ (SW837 day 4), 1.6×10⁻² (SW837 day 8), 1.2×10⁻⁶ (KM12 day 4), 4.3×10⁻⁹ (KM12 day 8). Three biological replicates are presented in tandem for b, c, d. For Extended Data Fig. 4, representative data from one experiment are shown. All experiments were performed twice.
Extended Data Fig. 5. WRN depletion activates a p53 response in MSI cells.
a, Phospho-p53 (S15) IF following sgRNA transduction in ovarian cell lines (50 µm scale bar). b, Nuclear phospho-p53 (S15) staining intensity per cell following WRN knockout compared to control sgRNA. Mean log fold-change: 0.059 (OVK18), −0.037 (ES2). Difference in log fold-change between OVK18 and ES2; P value (contrast test of least-squares means) < 2×10-16. n = (# cells with sgCh2–2, sgWRN2, sgWRN3) for OVK18 (3982, 1143, 2740), ES2 (4916, 3072, 3690). c, p21 IF following sgRNA transduction in colon cell lines (50 µm scale bar). KM12 is a p53-impaired MSI cell line. d, Nuclear p21 staining per cell. Mean log fold-change following WRN knockout compared to control in SW48 cells compared to either SW620 (P value < 2×10⁻¹⁶; contrast test of least-squares means) or KM12 cells (P value < 2×10⁻¹⁶; contrast test of least-squares means). Mean log fold-change: 0.13 (SW48), −0.016 (SW620), −0.032 (KM12). n = for SW48 (16203, 7617, 13257), SW620 (7278, 13768, 11576), KM12 (16117, 14200, 11301). e, p21 IF following sgRNA transduction in ovarian cell lines (50 µm scale bar). f, Nuclear p21 staining intensity per cell. Mean log fold-change following WRN knockout compared to control in OVK18 compared to ES2; P value (contrast test of least-squares means) < 2×10-16. Mean log-fold change: 0.157 (OVK18), −0.010 (ES2). n = for OVK18 (3436, 5876, 8275), ES2 (9117, 6834, 11576). g, WRN dependency for cells lines classified as MSS (n = 514), MSI from an infrequent MSI lineage (n = 6, 8 for p53-intact and impaired), or MSI from an MSI-predominant lineage (n = 23, 13 for p53-intact and impaired) and further sub-classified by p53 status. For b, d, f; lower error bar, box lower limit, bar, box upper limit, upper error bar, dots: 1st, 25th percentiles, median, 75th, 99th percentiles, outliers. For g, lower and upper hinges: 25th and 75th percentiles, respectively. Lower, upper whiskers: lowest and largest value within 1.5*IQR (inter-quartile range) from the hinge, respectively. For Extended Data Fig. 5, representative data from one experiment are shown. All experiments (a–f) were performed twice.
Extended Data Fig. 6. WRN depletion preferentially induces double strand breaks in MSI cells.
a, Nuclear ɣH2AX foci per cell following sgRNA transduction in colon cell lines. b, ɣH2AX IF following sgRNA transduction in ovarian cell lines. c, Nuclear ɣH2AX staining intensity per cell following sgRNA transduction. Difference in log fold-change between OVK18 and ES2; P value (contrast test of least-squares mean) < 2×10-16. Mean log fold-change: 0.147 (OVK18), 0.055 (ES2). n = (# cells with sgCh2–2, sgWRN2, sgWRN3) for OVK18 (2612, 4823, 6164), ES2 (6429, 6469, 6388). Lower error bar, box lower limit, bar, box upper limit, upper error bar, dots: 1st, 25th percentiles, median, 75th, 99th percentiles, outliers. d, Nuclear ɣH2AX foci per cell following sgRNA transduction in ovarian cell lines. e, Fluorescence of Apple-53BP1 foci in colon cell lines exogenously expressing Apple-53BP1(truncated). f, Nuclear Apple-53BP1 foci per cell following sgRNA transduction in colon cell lines. g, Fluorescence of Apple-53BP1 foci following sgRNA transduction in ovarian cell lines exogenously expressing Apple-53BP1(truncated). h, Nuclear Apple-53BP1 foci per cell in ovarian cell lines. For Extended Data Fig. 6, representative data from one experiment are shown. All experiments were performed twice.
Extended Data Fig. 7. WRN depletion preferentially induces double-strand break responses in MSI cells.
a, Phospho-ATM (S1981) IF following sgRNA transduction in colon cell lines. b, Nuclear phospho-ATM (S1981) foci per cell following sgRNA transduction in colon cell lines. c, Phospho-ATM (S1981) IF following sgRNA transduction in ovarian cell lines. d, Nuclear phospho-ATM (S1981) foci per cell following sgRNA transduction in ovarian cell lines. e, ɣH2AX, phospho-Chk2, total-Chk2, WRN, GAPDH levels following shRNA transduction. For Extended Data Fig. 7, representative data from one experiment are shown. All experiments were performed twice.
Extended Data Fig. 8. WRN protein is preferentially recruited to DNA in MSI cells.
a, Telomere PNA-FISH of metaphase spreads ± dox-induction of shWRN1. Hollow triangles: chromosomal breaks. Filled triangles: chromosomal fragments. b, WRN IF following shWRN1 or control shRNA (shWRN1-C911). c, WRN IF (20 µm scale bar). d, Analyses of WRN co-localization to the nucleolar marker, fibrillarin, by Pearson’s co-localization coefficients. Data shown: means ± SEM (n = 5 biological replicates). P values (two-tailed t-test): 1.0×10⁻³ (∗), 4.3×10⁻⁵ (†); 0.014 (‡). For Extended Data Fig. 8, representative data from one experiment are shown. All experiments were conducted twice.
Extended Data Fig. 9. Paralog dependencies and hypermutation alone cannot explain the WRN/MSI relationship.
a, Estimated association between WRN dependency and MSI status after controlling for loss of indicated genes (linear model effect size estimates plotted against significance). If loss of a gene can fully account for the MSI/WRN relationship, the difference in dependency and significance would be 0. Genes whose loss are typically associated with insertion/deletion (indel) mutations (> half of loss events) are highlighted in red. n = 51 MSI, 541 MSS. b, Average WRN dependency score for MSS and MSI lines stratified by POLE status (n = 4, 5, 35, 497, 2, 12, 5, 10, 22 cell lines per category in order of left to right). Lower and upper hinges: 25th and 75th percentiles, respectively. Lower and upper whiskers: lowest and largest value within 1.5*IQR (inter-quartile range) from the hinge, respectively.
Extended Data Fig. 10. MMR deficiency contributes to WRN dependency.
a, Flow-cytometric host cell reactivation assay measuring the ability of the indicated cell lines to repair a G:G mismatch on plasmid reporter, thereby activating the fluorescence reporter and measuring MMR activity. P values (two-tailed t-test): 5.5×10⁻² (∗), 2.3×10⁻³ (†). P values (two-way ANOVA): 3.6×10⁻⁸ (‡). Data shown: means ± SEM from three independent experiments. b, IB. ɣH2AX, WRN, MLH1, MSH3, GAPDH levels following shRNA transduction in HCT116 ± MMR restoration. c, Relative viability of HCT116 derivatives 7 days following sgRNA transduction. P values (two-way ANOVA): 5.7×10⁻²⁰ (∗ vs †), 3.3×10⁻¹² († vs ‡), 1.6×10⁻¹⁶ († vs §). Data shown: means ± SEM (n = 6 biological replicates). c, IB. ɣH2AX, WRN, MLH1, MSH3, GAPDH levels following shRNA transduction in HCT116 derivatives. d, Fifteen-day clonogenic assay following shRNA transduction. e, Relative staining intensity of the clonogenic assay. P values (two-way ANOVA) comparing 3.6×10⁻⁶ (∗ vs †), 8.5×10⁻⁸ († vs ‡), 2.8×10⁻⁸ († vs §). Data shown: means ± SEM (n = 3 biological replicates). For b–f, representative data from one experiment are shown. All experiments were conducted twice except a, which was conducted thrice.
Supplementary Material
Acknowledgments:
We thank C.R. Boland, A. Goel, M. Koi, R.J. Monnat, and R. Weissleder for reagents; A. Tang for graphical assistance; and Phil Montgomery for the website. This work was funded by The Carlos Slim Foundation/Slim Initiative for Genomic Medicine, Broad Institute, Team MG, NIH(2T32CA009172–42A1 to E.M.C.).
Footnotes
These authors jointly supervised this work: Francisca Vazquez and Adam J. Bass
Competing Interest
A.J.B. receives research funding from Merck and Novartis. D.E.R. receives research funding from the Functional Genomics Consortium (Abbvie, Jannsen, Merck, Vir) and is a director of Addgene. A.T. consults for Tango Therapeutics. T.R.G. has advised Foundation Medicine, Glaxo SmithKline, Sherlock Biosciences, Forma Therapeutics. A.D.A. consults for Lilly Oncology, EMD Serono, Intellia Therapeutics, Sierra Oncology, Formation Biologics, Cyteir Therapeutics, consults and holds stock in Ideaya, and co-founded and holds stock in Cedilla Therapeutics. G.G. receives research funding from IBM and Pharmacyclics and is an inventor on multiple patent applications related to bioinformatic tools, including applications related to MuTect, ABSOLUTE, MSMuTect, MSMutSig and MSIClass. Y.E.M. is an inventor on patent applications related to the bioinformatic tools, MSMuTect, MSMutSig and MSIClass. The Broad Institute filed a US patent application related to the target described in this manuscript.
Contributor Information
Edmond M. Chan, Department of Medical Oncology, Dana-Farber Cancer Institute, Harvard Medical School, Boston, Massachusetts, USA., Broad Institute of Harvard and MIT, Cambridge, Massachusetts, USA
Tsukasa Shibue, Broad Institute of Harvard and MIT, Cambridge, Massachusetts, USA.
James M. McFarland, Broad Institute of Harvard and MIT, Cambridge, Massachusetts, USA
Benjamin Gaeta, Broad Institute of Harvard and MIT, Cambridge, Massachusetts, USA.
Mahmoud Ghandi, Broad Institute of Harvard and MIT, Cambridge, Massachusetts, USA.
Nancy Dumont, Broad Institute of Harvard and MIT, Cambridge, Massachusetts, USA.
Alfredo Gonzalez, Broad Institute of Harvard and MIT, Cambridge, Massachusetts, USA.
Justine S. McPartlan, Broad Institute of Harvard and MIT, Cambridge, Massachusetts, USA
Tianxia Li, Department of Medical Oncology, Dana-Farber Cancer Institute, Harvard Medical School, Boston, Massachusetts, USA.
Yanxi Zhang, Department of Medical Oncology, Dana-Farber Cancer Institute, Harvard Medical School, Boston, Massachusetts, USA.
Jie Bin Liu, Department of Medical Oncology, Dana-Farber Cancer Institute, Harvard Medical School, Boston, Massachusetts, USA.
Jean-Bernard Lazaro, Department of Medical Oncology, Dana-Farber Cancer Institute, Harvard Medical School, Boston, Massachusetts, USA., Department of Radiation Oncology, Dana-Farber Cancer Institute, Harvard Medical School, Boston, Massachusetts, USA.
Peili Gu, Departments of Laboratory Medicine, Pathology, and Molecular Biophysics and Biochemistry Yale University School of Medicine, New Haven, Connecticut, USA.
Cortt G. Piett, Department of Environmental Health. Harvard T.H. Chan School of Public Health, Boston, Massachusetts, USA
Annie Apffel, Broad Institute of Harvard and MIT, Cambridge, Massachusetts, USA.
Syed O. Ali, Broad Institute of Harvard and MIT, Cambridge, Massachusetts, USA., Department of Medical Oncology, Dana-Farber Cancer Institute, Harvard Medical School, Boston, Massachusetts, USA
Rebecca Deasy, Broad Institute of Harvard and MIT, Cambridge, Massachusetts, USA.
Paula Keskula, Broad Institute of Harvard and MIT, Cambridge, Massachusetts, USA.
Raymond W.S. Ng, Broad Institute of Harvard and MIT, Cambridge, Massachusetts, USA., Department of Medical Oncology, Dana-Farber Cancer Institute, Harvard Medical School, Boston, Massachusetts, USA
Emma A. Roberts, Department of Radiation Oncology, Dana-Farber Cancer Institute, Harvard Medical School, Boston, Massachusetts, USA
Elizaveta Reznichenko, Department of Radiation Oncology, Dana-Farber Cancer Institute, Harvard Medical School, Boston, Massachusetts, USA.
Lisa Leung, Broad Institute of Harvard and MIT, Cambridge, Massachusetts, USA.
Maria Alimova, Broad Institute of Harvard and MIT, Cambridge, Massachusetts, USA.
Monica Schenone, Broad Institute of Harvard and MIT, Cambridge, Massachusetts, USA.
Mirazul Islam, Broad Institute of Harvard and MIT, Cambridge, Massachusetts, USA., Department of Medical Oncology, Dana-Farber Cancer Institute, Harvard Medical School, Boston, Massachusetts, USA.
Yosef E. Maruvka, Massachusetts General Hospital Cancer Center, Boston, Massachusetts, USA
Yang Liu, Broad Institute of Harvard and MIT, Cambridge, Massachusetts, USA., Department of Medical Oncology, Dana-Farber Cancer Institute, Harvard Medical School, Boston, Massachusetts, USA.
Jatin Roper, Department of Medicine, Division of Gastroenterology, Duke University, Durham, North Carolina, USA.
Srivatsan Raghavan, Broad Institute of Harvard and MIT, Cambridge, Massachusetts, USA., Department of Medical Oncology, Dana-Farber Cancer Institute, Harvard Medical School, Boston, Massachusetts, USA.
Marios Giannakis, Broad Institute of Harvard and MIT, Cambridge, Massachusetts, USA., Department of Medical Oncology, Dana-Farber Cancer Institute, Harvard Medical School, Boston, Massachusetts, USA.
Yuen-Yi Tseng, Broad Institute of Harvard and MIT, Cambridge, Massachusetts, USA.
Zachary D. Nagel, Broad Institute of Harvard and MIT, Cambridge, Massachusetts, USA., Department of Environmental Health. Harvard T.H. Chan School of Public Health, Boston, Massachusetts, USA
Alan D’Andrea, Department of Radiation Oncology, Dana-Farber Cancer Institute, Harvard Medical School, Boston, Massachusetts, USA.
David E. Root, Broad Institute of Harvard and MIT, Cambridge, Massachusetts, USA
Jesse S. Boehm, Broad Institute of Harvard and MIT, Cambridge, Massachusetts, USA
Gad Getz, Broad Institute of Harvard and MIT, Cambridge, Massachusetts, USA., Massachusetts General Hospital Cancer Center, Boston, Massachusetts, USA.
Sandy Chang, Departments of Laboratory Medicine, Pathology, and Molecular Biophysics and Biochemistry Yale University School of Medicine, New Haven, Connecticut, USA.
Todd R. Golub, Department of Pediatric Oncology, Dana-Farber Cancer Institute, Harvard Medical School, Boston, Massachusetts, USA., Howard Hughes Medical Institute, Chevy Chase, Maryland, USA
Aviad Tsherniak, Broad Institute of Harvard and MIT, Cambridge, Massachusetts, USA.
Francisca Vazquez, Broad Institute of Harvard and MIT, Cambridge, Massachusetts, USA; Department of Medical Oncology, Dana-Farber Cancer Institute, Harvard Medical School, Boston, Massachusetts, USA.
Adam J. Bass, Broad Institute of Harvard and MIT, Cambridge, Massachusetts, USA., Department of Medical Oncology, Dana-Farber Cancer Institute, Harvard Medical School, Boston, Massachusetts, USA
References
- 1.Chan DA & Giaccia AJ Harnessing synthetic lethal interactions in anticancer drug discovery. Nat. Rev. Drug Discov 10, 351 (2011). [DOI] [PMC free article] [PubMed] [Google Scholar]
- 2.Ivy SP, de Bono J & Kohn EC The ‘Pushmi-Pullyu’ of DNA REPAIR: Clinical Synthetic Lethality. Trends Cancer 2, 646–656 (2016). [DOI] [PMC free article] [PubMed] [Google Scholar]
- 3.Brown JS, Kaye SB & Yap TA PARP inhibitors: the race is on. Br. J. Cancer 114, 713–715 (2016). [DOI] [PMC free article] [PubMed] [Google Scholar]
- 4.Kim TM et al. , The Landscape of Microsatellite Instability in Colorectal and Endometrial Cancer Genomes. Cell 155, 858–868 (2013). [DOI] [PMC free article] [PubMed] [Google Scholar]
- 5.The Cancer Genome Atlas Research, N., Comprehensive molecular characterization of gastric adenocarcinoma. Nature 513, 202 (2014). [DOI] [PMC free article] [PubMed] [Google Scholar]
- 6.Kunitomi H, et al. , New use of microsatellite instability analysis in endometrial cancer. Oncol Lett 14, 3297–3301 (2017). [DOI] [PMC free article] [PubMed] [Google Scholar]
- 7.Pal T, et al. , Systematic Review and Meta-analysis of Ovarian Cancers: Estimation of Microsatellite-High Frequency and Characterization of Mismatch Repair Deficient Tumor Histology. Clin. Cancer Res 14, 6847–6854 (2008). [DOI] [PMC free article] [PubMed] [Google Scholar]
- 8.Le DT, et al. , Mismatch-repair deficiency predicts response of solid tumors to PD-1 blockade. Science 357, 409–413 (2017). [DOI] [PMC free article] [PubMed] [Google Scholar]
- 9.Overman MJ, et al. , Durable Clinical Benefit With Nivolumab Plus Ipilimumab in DNA Mismatch Repair–Deficient/Microsatellite Instability–High Metastatic Colorectal Cancer. J. Clin. Oncol 36, 773–779 (2018). [DOI] [PubMed] [Google Scholar]
- 10.Meyers RM, et al. , Computational correction of copy number effect improves specificity of CRISPR–Cas9 essentiality screens in cancer cells. Nat. Genet 49, 1779 (2017). [DOI] [PMC free article] [PubMed] [Google Scholar]
- 11.McDonald ER, et al. , Project DRIVE: A Compendium of Cancer Dependencies and Synthetic Lethal Relationships Uncovered by Large-Scale, Deep RNAi Screening. Cell 170, 577–592 (2017). [DOI] [PubMed] [Google Scholar]
- 12.Barretina J, et al. , The Cancer Cell Line Encyclopedia enables predictive modelling of anticancer drug sensitivity. Nature 483, 603–307 (2012). [DOI] [PMC free article] [PubMed] [Google Scholar]
- 13.Iorio F, et al. , A Landscape of Pharmacogenomic Interactions in Cancer. Cell 166, 740–754 (2016). [DOI] [PMC free article] [PubMed] [Google Scholar]
- 14.Swanson C, et al. , The Werner syndrome protein has separable recombination and survival functions. DNA Repair 3, 475–482 (2004). [DOI] [PubMed] [Google Scholar]
- 15.Rossi ML, Ghosh AK, & Bohr VA, Roles of Werner Syndrome Protein in Protection of Genome Integrity. DNA repair 9, 331–344 (2010). [DOI] [PMC free article] [PubMed] [Google Scholar]
- 16.Buehler E, Chen YC, & Martin S, C911: A Bench-Level Control for Sequence Specific siRNA Off-Target Effects. PLoS One 7, e51942 (2012). [DOI] [PMC free article] [PubMed] [Google Scholar]
- 17.Loughery J, Cox M, Smith LM & Meek DW, Critical role for p53-serine 15 phosphorylation in stimulating transactivation at p53-responsive promoters. Nucleic Acids Res 42, 7666–7680 (2014). [DOI] [PMC free article] [PubMed] [Google Scholar]
- 18.Shiloh Y & Ziv Y The ATM protein kinase: regulating the cellular response to genotoxic stress, and more. Nat. Rev. Mol. Cell Biol 14, 197 (2013). [PubMed] [Google Scholar]
- 19.Nowsheen S & Yang ES The Intersection Between DNA damage Response and Cell Death Pathways. Exp. Oncol 34, 243–254 (2012). [PMC free article] [PubMed] [Google Scholar]
- 20.Bendtsen KM, et al. , Dynamics of the DNA repair proteins WRN and BLM in the nucleoplasm and nucleoli. Eur Biophys J 43, 509–516 (2014). [DOI] [PMC free article] [PubMed] [Google Scholar]
- 21.Billingsley CC et al. Polymerase ɛ (POLE) mutations in endometrial cancer: Clinical outcomes and implications for Lynch syndrome testing. Cancer 121, 386–394 (2014). [DOI] [PMC free article] [PubMed] [Google Scholar]
- 22.Haugen AC, et al. , Genetic Instability Caused by Loss of MutS Homologue 3 in Human Colorectal Cancer. Cancer Res 68, 8465 (2008). [DOI] [PMC free article] [PubMed] [Google Scholar]
- 23.Sidorova JM, Roles of the Werner syndrome RecQ helicase in DNA replication. DNA repair 7, 1776–1786 (2008). [DOI] [PMC free article] [PubMed] [Google Scholar]
- 24.Spies M & Fishel R, Mismatch Repair during Homologous and Homeologous Recombination. Cold Spring Harb. Perspect. Biol 7, 3 (2015). [DOI] [PMC free article] [PubMed] [Google Scholar]
- 25.Opresko PL, Sowd G, and Wang H, The Werner Syndrome Helicase/Exonuclease Processes Mobile D-Loops through Branch Migration and Degradation. PLoS One 4, e4825 (2009). [DOI] [PMC free article] [PubMed] [Google Scholar]
- 26.Myung K, et al. , SGS1, the Saccharomyces cerevisiae homologue of BLM and WRN, suppresses genome instability and homeologous recombination. Nature Genet 27, 113–6 (2001). [DOI] [PubMed] [Google Scholar]
- 27.Aggarwal M, et al. , Targeting an Achilles’ heel of cancer with a WRN helicase inhibitor. Cell Cycle 12, 3329–3335 (2013). [DOI] [PMC free article] [PubMed] [Google Scholar]
- 28.Lebel M & Monnat RJ, Werner syndrome (WRN) gene variants and their association with altered function and age-associated diseases. Ageing Res. Rev 41, 82–97 (2018). [DOI] [PubMed] [Google Scholar]
- 29. Reference to the Sanger Institute manuscript.
- 30.Tsherniak A et al. Defining a Cancer Dependency Map. Cell 170, 564–576 (2017). [DOI] [PMC free article] [PubMed] [Google Scholar]
- 31.Broad DepMap Achilles (2018) figshare. fileset https://figshare.com/articles/DepMap_Achilles_18Q4_public/7270880
- 32.McFarland JM, et al. , Improved estimation of cancer dependencies from large-scale RNAi screens using model-based normalization and data integration. Nat. Commun 9, 4610 (2018). [DOI] [PMC free article] [PubMed] [Google Scholar]
- 33.Cancer Data Science (2018): DEMETER2 data. figshare. fileset 10.6084/m9.figshare.6025238.v4 [DOI]
- 34.Cancer Cell Line Encyclopedia Consortium, and Genomics of Drug Sensitivity in Cancer Consortium. Pharmacogenomic Agreement between Two Cancer Cell Line Data Sets. Nature 528, 84–87 (2015). [DOI] [PMC free article] [PubMed] [Google Scholar]
- 35.Giacomelli AO, et al. , Mutational processes shape the landscape of TP53 mutations in human cancer. Nat. Genet 50, 1381–1387 (2018). [DOI] [PMC free article] [PubMed] [Google Scholar]
- 36.Ritchie ME, et al. , limma powers differential expression analyses for RNA-sequencing and microarray studies. Nucleic Acids Res 43, e47–e47 (2015). [DOI] [PMC free article] [PubMed] [Google Scholar]
- 37.Benjamini Y & Hochberg Y, Controlling the False Discovery Rate: A Practical and Powerful Approach to Multiple Testing. J. R. Stat. Soc. Series B Methodol 57, 289–300 (1995). [Google Scholar]
- 38.Robinson MD & Oshlack A, A scaling normalization method for differential expression analysis of RNA-seq data. Genome Biol 11, R25 (2010). [DOI] [PMC free article] [PubMed] [Google Scholar]
- 39.Robinson MD, McCarthy DJ, & Smyth GK, edgeR: a Bioconductor package for differential expression analysis of digital gene expression data. Bioinformatics 26, (2010). [DOI] [PMC free article] [PubMed] [Google Scholar]
- 40.Law CW, Chen Y, Shi W, & Smyth GK, voom:Precision weights unlock linear model analysis tools for RNA-seq read counts. Genome Biol 15, R29 (2014). [DOI] [PMC free article] [PubMed] [Google Scholar]
- 41.Subramanian A, et al. , Gene set enrichment analysis: a knowledge-based approach for interpreting genome-wide expression profiles. Proc. Natl. Acad. Sci. U.S.A 102, 15545–50 (2005). [DOI] [PMC free article] [PubMed] [Google Scholar]
- 42.Sergushichev A, An algorithm for fast preranked gene set enrichment analysis using cumulative statistic calculation. bioRxiv (2016).
- 43.Liberzon A, et al. , The Molecular Signatures Database Hallmark Gene Set Collection. Cell Systems 1, 417–425.49 (2015). [DOI] [PMC free article] [PubMed] [Google Scholar]
- 44.Boj SF, et al. Organoid models of human and mouse ductal pancreatic cancer. Cell 160, 324–38 (2015). [DOI] [PMC free article] [PubMed] [Google Scholar]
- 45.Shibue T, et al. , The outgrowth of micrometastases is enabled by the formation of filopodium-like protrusions. Cancer Discov 2, 706–721 (2012). [DOI] [PMC free article] [PubMed] [Google Scholar]
- 46.Lenth RV, Least-Squares Means: The R Package Ismeans. J. Stat. Softw 69, 1–33 (2016). [Google Scholar]
- 47.Dejmek J, Iglehart JD, Lazaro JB, DNA-Dependent Protein Kinase (DNA-PK) Dependent Cisplatin-Induced Loss of Nucleolar Facilitator of Chromatin Transcription (FACT) and Regulation of Cisplatin Sensitivity by DNA-PK and FACT. Mol. Cancer Res 7, 581 (2009). [DOI] [PubMed] [Google Scholar]
- 48.Bates D, et al. , Fitting Linear Mixed-Effects Models Using lme4. J.Stat. Softw 67, 1–48 (2015). [Google Scholar]
- 49.Nagel ZD, et al. , Multiplexed DNA repair assays for multiple lesions and multiple doses via transcription inhibition and transcriptional mutagenesis. Proc. Natl. Acad. Sci. U.S.A 111, E1823–32 (2014). [DOI] [PMC free article] [PubMed] [Google Scholar]
Associated Data
This section collects any data citations, data availability statements, or supplementary materials included in this article.


