

Abstract
Several studies have examined the link between the cannabinoid CB1 receptor and several neuropsychiatric illnesses, including schizophrenia. As such, there is a need for in vivo imaging tracers so that the relationship between CB1 and schizophrenia (SZ) can be further studied. In this paper, we present our first human studies in both healthy control patients and patients with schizophrenia using the novel PET tracer, [11C]OMAR (JHU 75528), we have shown its utility as a tracer for imaging human CB1 receptors and to investigate normal aging and the differences in the cannabinoid system of healthy controls versus patients with schizophrenia. A total of ten healthy controls and nine patients with schizophrenia were included and studied with high specific activity [11C]OMAR. The CB1 binding (expressed as the distribution volume; VT) was highest in the globus pallidus and the cortex in both controls and patients with schizophrenia. Controls showed a correlation with the known distribution of CB1 and decline of [11C]OMAR binding with age, most significantly in the globus pallidus. Overall, we observed elevated mean binding in patients with schizophrenia across all regions studied, and this increase was statistically significant in the pons (p<0.05), by the students t-test. When we ran a regression of the control subjects VT values with age and then compared the patient data to 95% prediction limits of the linear regression, three patients fell completely outside for the globus pallidus, and in all other regions there were at least 1-3 patients outside of the prediction intervals. There was no statistically significant correlations between PET measures and the individual Brief Psychiatry Rating Score (BPRS) subscores, but there was a significant correlation between VT and the ratio of the BPRS psychosis to withdrawal score in the frontal lobe (r=0.49), (r=0.60), and middle and posterior cingulate regions (r=0.71 and r=0.79 respectively). In conclusion, we found that [11C] OMAR can image human CB1 receptors in normal aging and schizophrenia. In additon, our initial data in subjects with schizophrenia seem to suggest an association of elevated binding specific brain regions and symptoms of the disease.
Introduction
Cannabis sativa, that is known as marijuana has been used by people as a drug of abuse and medication throughout history.(Mechoulam, 1986) Δ9-Tetrahydrocannabinol (Δ9-THC), the principal component of marijuana, is known to activate cannabinoid receptors. (Pertwee, 2008) The cannabinoid receptors belong to GPCR-superfamily and currently two subtypes of cannabinoid receptors have been identified (Howlett et al., 2002): CB1-subtype that is primarily found in brain and neuronal tissue and CB2-subtype that is mainly found in immune tissue and, in lower concentration, in normal nervous tissue (Onaivi et al., 2008). Central CB1 receptors are involved in various brain functions and disorders including schizophrenia1 and depression, drug addiction and alcoholism (Mouslech and Valla, 2009). Even though the chemistry and pharmacology research of cannabinoids has reached enormous proportions(Hanus, 2009) the exact role of cannabinoid receptors in normal state and disease remains elusive.
Multiple lines of evidence show that cannabis and CB1 receptors play a role in psychotic illness and particularly in SZ (Andreasson et al., 1987; Arseneault et al., 2002; Chavarria-Siles et al., 2008; D'Souza, 2007; D'Souza et al., 2005; D′Souza et al., 2009; Giuffrida et al., 2004; Henquet et al., 2005; Leweke et al., 1999; Ujike et al., 2002; van Os et al., 2002; Zammit et al., 2002).
Studies with post-mortem brain in patients with SZ have showed a 25% increase of the binding of [3H]CP55,940, a non-subtype selective CB1/CB2 agonist, in the superficial layers of the posterior cingulate cortex (Newell et al., 2006) and a 64% increase of the binding of CB1 selective cannabinoid antagonist [3H]SR141716A in the anterior cingulate cortex (Zavitsanou et al., 2004). Dean and collaborators (Dean et al., 2001) found increased binding of a cannabinoid agonist [3H]CP55,940 in the dorsolateral prefrontal cortex (DLPFC) in SZ patients (independent of cannabis use prior to their death), while the increased numbers in the caudate-putamen was thought to be the result of cannabis use. In this study no change was observed in the hippocampus compared to normal controls. In contrast to these radiotracer in vitro binding studies, reduced cortical CB1 receptor messenger RNA and protein expression have been found post-mortem in DLPFC of subjects with SZ (Eggan et al., 2008), while another immunohistochemical study (Koethe et al., 2007) showed no alteration of density of CB1 receptor immunopositive cells in the brains of subjects with SZ. A more recent study demonstrated that immunodensity of CB1 receptors in the frontal cortex was significantly decreased (71±7%) in antipsychotic-treated subjects with schizophrenia but not in drug-free subjects (104±13%) (Uriguen et al., 2009).
The most advanced technique for studying central receptors in the living human and animal brain is PET. Until recently the quantitative PET imaging of CB1 receptors has been hampered by the lack of suitable radioligands. PET imaging of CB1 receptors will help to study the role of the CB1 in many CNS diseases, including schizophrenia. Better understanding of the fundamental mechanisms of the cannabinoid receptor system could direct the development of medications to treat these disorders. A preliminary PET study of CB1 in a subject with schizophrenia with [124I]AM281 suggested a feasibility of such investigation, but a poor signal-to-noise ratio of the radioligand was an obstacle for a further research including comparison of CB1 receptors in normal controls and subjects with SZ (Berding et al., 2006).
During the last two years, advances in medicinal radiochemistry have led to the development of radiolabeled CB1 PET probes with better imaging characteristics than those of [124I]AM281. Quantitative PET of the CB1 receptor has now become possible (Burns et al., 2007; Horti et al., 2006; Terry et al., 2009; Van Laere et al., 2009; Van Laere et al., 2008b; Yasuno et al., 2008) and studies with several classes of new CB1 radiotracers are in progress (see for review (Horti and Van Laere, 2008)). Our new radioligand, [11C]OMAR ([11C]JHU75528 (Fan et al., 2006)), exhibited good results for quantification of CB1 receptors in the mouse and baboon brain (Horti et al., 2006) and control human subjects (Horti et al., 2007; Wong et al., 2008b). In this report we are presenting the results of PET imaging of CB1 receptors with [11C]OMAR in healthy human controls and patients affected by SZ (Wong et al., 2008a), which demonstrate the utility of [11C]OMAR to image CB1 receptors.
Materials and Methods
Radioligand for human studies
[11C]OMAR ([11C]JHU75528) is a CB1 selective PET radioligand (Fan et al., 2006) was synthesized here for human studies via the previously published procedure (Horti et al., 2006) under the cGMP guideline (2005). The radioligand was synthesized in high radiochemical purity (>99%) and specific radioactivity (266±78 GBq/μmol, n=16). The precursor for the radiosynthesis was purchased from IsoSciences (King of Prussia, PA). Toxicology and radiation dosimetry studies were carried out and demonstrated safety and tolerability. These safety and toxicology studies were consistent with local IRB approval (see Appendix Description 1).
Study Design
To examine the distribution of CB1 receptors in the human brain, in both healthy controls and patients affected by SZ, we conducted a single-center PET study. In this study control human subjects were initially compared with a single cohort of 10 subjects with SZ.
Study participants
Healthy adult control subjects were recruited via advertisements in local newspapers, word of mouth, and announcements at local universities. Adult subjects with SZ were recruited from the outpatient clinic of the Department of Psychiatry at Johns Hopkins Hospital.
All subjects received thorough medical and psychiatric screenings, which specifically examined current and earlier medications. All control subjects were free of neuroleptic, cannabinoid, serotonergic, and dopaminergic drugs at the time of PET scanning, and had been treatment-free for a period of at least 6 months before the start of the study.
Study procedures were conducted in accordance with the Declaration of Helsinki Principle of 2004. The Institutional Review Board of The Johns Hopkins University School of Medicine approved the studies and the informed consent documents. All participants gave their written informed consent.
The control cohort consisted of ten healthy males, with a mean age of 33± 11 years, ranging from ages 21-51 and comprised 8 African-Americans, 1 Asian and 1 Caucasian. The SZ cohort consisted of 9 males and 1 female, with a mean age of 42 ± 9 years, ranging from ages 30-54 and comprise 7 African-Americans, 1 Indian and 2 Caucasians. (see Appendix Table 1, 2)
Inclusion criteria for the controls included: BMI between 18 and 28 kg/m2, smoking consumption of less than 5 cigarettes a day and also the ability to stop smoking while participating in the study, and finally; all controls had to be deemed to be healthy by a detailed medical history and complete physical examination. Potential subjects were also excluded if there had a history or presence of drug or alcohol abuse (alcohol consumption > 40 grams/day).
The subjects with schizophrenia all had a DSM-IV-TR (Disorders, 2000) diagnosis of schizophrenia, and were treated with olanazapine or risperidone monotherapy for at least 2 months prior to screening. They did not differ significantly in terms of duration of illness.
We excluded any of the schizophrenia subjects if they had a 1) BPRS hallucinatory behavior, unusual thought content, suspiciousness or conceptual disorganization item scores > 4 (moderately severe) on any single item; 2) CDSS total score > 10 (depression) or a score of > 0 on item 8 (suicidality); 3) SAS score > 0.6 (6 total); and 4) Barnes Akathisia Scale global score > 3.
Study Procedures
Dynamic PET scans of 90 minutes followed a slow-bolus injection of [11C]OMAR (mean total dose = 703 MBq; specific radioactivity = 222 - 296 GBq/μmole).
All PET scans were carried out on the second-generation High-Resolution Research Tomograph (ECAT HRRT); CPS Innovations, Inc.), an LSO-based, 2.5mm-resolution, dedicated brain PET scanner (Sossi et al., 2005).
For co-registration with the PET data to enhance anatomical definitions, each participant received a volumetric MRI scan acquired using a spoiled GRASS (gradient recalled acquisition in steady state) (SPGR) sequence on a GE 1.5T Signa Camera (GE Healthcare, Chalfont St Giles, UK).
PET Scan Procedures
An intravenous catheter was inserted to the antecubital vein for ligand injection and an arterial catheter was inserted in the radial artery at wrist on the other hand to obtain blood samples. A thermoplastic mask was custom-made for each subject to reduce head motion during the scan. At 15 minutes before ligand injection, the subject was positioned in the scanner. A 6-min attenuation scan was performed using a rotating Cs-137 point source. The 90-min emission scan started with a slow bolus injection (over one minute) of radioligand about 20 mCi (range; 19.53 to 20.43 mCi) in a 3-D list mode. Small amounts of arterial blood (∼2ml) were sampled every 5 seconds initially and at prolonging intervals toward the end of the scan. Radioactivity in plasma samples were measured with a gamma counter and corrected for physical decay to the injection time. Large amounts of arterial blood (∼5 ml) were sampled at 0, 5, 10, 30, 60 and 90 min for determination of [11C]OMAR and its radioactive metabolites in plasma as described elsewhere (Hilton et al., 2000; Horti et al., 2006).
Reconstruction of emission scan
PET images were reconstructed using the iterative ordered-subset expectation-maximization (OSEM) algorithm correcting for attenuation, normalization, scatter, randoms and dead-time (Jones et al., 2006; Rahmim et al., 2005). The following frame schedule was used: Four 15-sec, four 30-sec, three 1-min, two 2-min, five 4-min, and twelve 5-min frames, or a total of 30 frames for the 90 min scan. The radioactivity was corrected for physical decay to the injection time. Each PET frame consisted of 256 (left-to-right) by 256 (nasion-to-inion) by 207 (neck-to-cranium) voxels.
Data analysis
Volumes of Interest
VOIs were generated by spatially normalizing (Ashburner and Friston, 2007a) a standard VOI template(Tzourio-Mazoyer et al., 2002) to each individual subject's MRI and was then edited manually for errors associated with spatial normalization. The cingulate cortex VOI, the region of particular interest, was divided into anterior, middle, and posterior cingulate VOIs by the anterior and posterior commissure planes (Plane A and B). The U-shaped anterior cingulate VOI was further divided into dorsal, rostral, and sub-callosal subdivisions by a coronal plane that passed through the anterior tip of corpus callosum (Plane C) (Bush et al., 2000; Fornito et al., 2006; Fornito et al., 2008; Vogt et al., 2003; Vogt and Laureys, 2005). The classification process was performed in the Talairach-oriented MRI space (i.e., anterior and posterior commissure pointes were on the Y axis, and mid-sagittal plane was one the YZ plane) (Talairach and Tornoux, 1988). Finally, the VOIs were transferred to PET space using MRI-to-PET coregistration parameters(Ashburner and Friston, 2007b) and applied to individual PET frames to obtain TAC.
Radioactive Plasma and Radiolabeled Metabolite Data
The radioactive metabolites in blood were analyzed by HPLC under the same conditions that we used previously in baboon [11C]OMAR studies (Horti et al., 2006). The HPLC analysis demonstrated no substantial difference between radioactive metabolites in the baboon and human blood (data are not presented). The average parent ligand in plasma was 41% at 60 minutes by HPLC. The radioactive metabolites were assumed not to enter the brain because of weak lipophilicity, as has been shown in our previous rodent and baboon studies (Horti et al., 2006). The time profiles of total metabolites were fitted by a sum of exponential functions (zero derivative at time 0) to separate the total radioactivity into [11C]OMAR and metabolites. Metabolite-corrected plasma TAC were used in the model parameter estimation, with the exception of the total plasma TAC, which was used for the calculation of the radioactivity in the tissue vasculature when applicable.
Derivation of outcome variables
The distribution of volume of [11C] OMAR VT was obtained for each region by plasma reference graphical analysis (PRGA (Logan et al., 1990)). In a preliminary study, PRGA showed more robust estimates of VT than the two-compartment model, as measured with time-dependency (i.e., PET frames used for data analysis) of estimates and the magnitude of inter-subject variability. Because of the lack of a reliable reference region for [11C]OMAR (See Discussion), we concluded that the BPND (Innis et al., 2007) is not appropriate for quantification of this radioligand.
Head motion correction
Head motions during the emission scan were not corrected in this analysis because apparent head motions were not detected on visual inspections of TACs in each subject. In addition, VT estimates without and with head motion correction (HMC) were essentially identical for PRGA (VT [HMC] = 1.01·VT [noHMC] - 0.004; R2 = 0.989).
Behavioral analysis
We carried out a correlational analysis of these summary categories and the regional VT. We particularly focused on the summary categories of psychotic and withdrawal symptoms, as these are representative of the most prominent symptoms in SZ.
Results and Discussion
Based on safety and tolerability studies (see Appendix Description 1), we elected to inject a mass approximately 0.14 μg/kg during each radiotracer injection. The radiation dosimetry estimates in mice provided an effective dose of 10 – 20 mCi (370 – 740 MBq). There were no significant adverse experiences reported during the studies, in either the healthy control subjects of subjects with SZ.
Outcome variable of the [11C]OMAR human studies
The pons showed the lowest accumulation of the radioactivity among brain regions. However, inter-subject variations (as measured by standard deviation across subjects) increased from a 10% range for VT to a 20% range for BP when the pons was used as a reference region. Therefore, it is likely that VT estimates within the pons maybe uncertain because of its relatively small size (∼10 ml) compared to typical reference regions (e.g., ∼90 ml for cerebellum, ∼50 ml for occipital cortex) as well as the low counts in this region. In addition, it has been noted that one of the highest reductions in VT occurred in the pons in the monkey brain as measured with [11C]MePPEP, a separate CB1 receptor ligand, after pretreatment with Rimonabant (3.0 mg/kg i.v.). Other researchers (Burns et al., 2007; Yasuno et al., 2008) have suggested that white matter (centrum semiovale) may be used as a reference region for [18F]MK-9470, another CB1 receptor radioligand. However, in our study, white matter TAC continued to increase for the 90 min period for [11C]OMAR even when white matter VOIs were limited to voxels that were less affected by the partial volume effect (i.e., pure white matter voxels). Thus, we suggest that [11C]OMAR showed different kinetics in cerebellum than cortical regions and/or partial volume effects may not be completely eliminated even for HRRT. For all the above reasons, we concluded that pons and white matter may not be used as a reference region for calculation of BPND, and that BPND may not be accessible for [11C]OMAR. Therefore, we used VT as the main outcome variable instead of BPND.
[11C]OMAR binding and brain regional distribution in control subjects
The brain time-activity curves of [11C]OMAR peaked at approximately 20 minutes post injection (% SUV ranged from 136 to 207% in the putamen) and decreased gradually thereafter to reach a SUV between 80 and 117% at 90 min. (Figure 1). In all 10 control subjects the VT values ranged from 0.79 to 1.82 across multiple cortical and subcortical regions. Because of the high resolution of the HRRT PET scanner we were able to assess relatively small regions including the globus pallidus and subdivisions of cingulate cortex.
Figure 1.
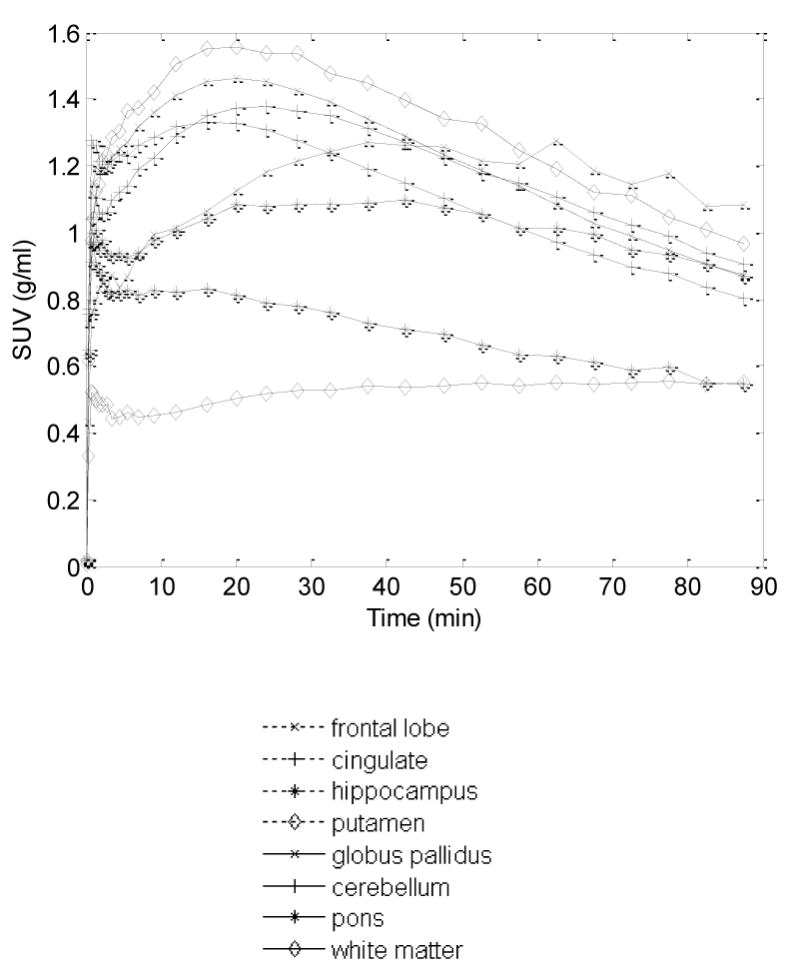
Time (radio-)activity curves (TACs) of selected brain regions shown as mean standard uptake values (SUV; g/ml) across 10 healthy subjects.
Within the controls, the globus pallidus showed the highest VT, with a mean of 1.47 +/- 0.25 (SD), with a range of 0.95 to 1.82 in individual subjects (Figure 2,3). The cingulate cortex (mean 1.23 +/- 0.16(SD), range of 1.01 – 1.49) and the putamen (mean 1.32 +/- 0.20(SD), range of 1.05 – 1.63) also showed high binding. The intermediate uptake was in the hippocampus, cerebellum and cortex. The lowest accumulation of the [11C]OMAR radioactivity was seen in white matter, the pons and thalamus. It is noteworthy that the previous autoradiography study with cannabinoid agonist [3H]CP55,940 (Glass et al., 1997; Herkenham et al., 1990) demonstrated the highest binding in the hippocampus and frontal cortex and intermediate binding in the globus pallidus and putamen, whereas [11C]OMAR manifests highest accumulation of radioactivity in the basal ganglia, including the globus pallidus and putamen (Figures 3). However, the in vivo regional distribution of [11C]OMAR in the human brain (Figure 4) is consistent with the PET human data from other CB1 selective PET radioligands including [18F]MK-9470 (Burns et al., 2007; Van Laere et al., 2008a), [11C]MePPEP (Terry et al., 2009) and [124I]AM281 (Berding et al., 2006). The differences between in vivo and in vitro CB1 binding have been discussed by other researchers (Burns et al., 2007; Van Laere et al., 2008a) who concluded that there could be a number of reasons for the differences, including a limited availability of the hippocampus CB1 receptors for in vivo binding given this ∼85% of these receptors are located in intracellular vesicles (Burns et al., 2007; Coutts et al., 2001).
Figure 2.
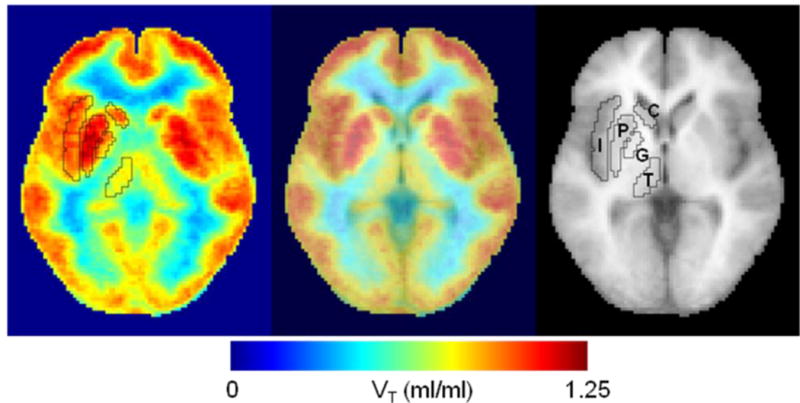
Trans-axial images of distribution volume (VT) of [11C}OMAR, mean of 10 healthy subjects in a standard space (left panel), a standard MRI (right), and merged image (middle). Volumes of interest of selected structures in the standard space are shown on the VT image and MRI. Regions are insula (I), putamen (P), glubus pallidus (G), thalamus (T), and caudate nucleus (C).
Figure 3.

Brain regional total volume of distributions (mean VT ± SD, n=10) in the control cohort in the PET studies with [11C]OMAR.
Figure 4.

Correlation of PET regional volumes of distribution of [11C]OMAR in controls(VT, mean ± SD, n=10) with post-mortem autoradiographic CB1 density of binding [3H]CP55,940 in the adult human brain (Bmax). The regional Bmax values were calculated here as means of all sub-regions that are presented in the autoradiography paper (Glass et al., 1997).
Effect of aging on the [11C] OMAR binding in controls and subjects with schizophrenia
We also correlated the [11C]OMAR regional volume of distribution (VT) with age. Within the control group we found a significant age-associated decline of [11C]OMAR VT in the globus pallidus (r = -0.66, p < 0.05), the region with the highest uptake of [11C] OMAR. Other regions of intermediate to high [11C] OMAR uptake, such as the putamen and cortex also showed a decline with age, but this trend was not statistically significant. This supports results from previous studies that found no significant trend of the CB1 radioligand [18F]MK-9470 uptake in the hippocampus formation with aging within a group of normal male controls (range = 18-70 year old) (Van Laere et al., 2008a), although an age related increase of [18F]MK-9470 uptake in the entorhinal cortex/amygdala was observed in female controls.
Within the cohort with SZ, there was no significant association with age in any region. Furthermore, when the patients with SZ were plotted against the regression of the controls with age, at least one to several of the schizophrenia data points fell outside of the 95% prediction interval of the regression line. This was the case in the globus pallidus, where we saw a significant decline with age in controls, as well as in all other regions. Figure 5 shows the regression with age in several regions, including globus pallidus.
Figure 5.

Effect of aging on the binding of [11C]OMAR (VT) in the various brain regions. Among the controls only, regression analysis of[11C]OMAR VT with aging was done (solid black lines, dotted lines indicated 95% prediction interval). Data from subjects with schizophrenia was then plotted against this regression (red triangles).
These PET results are consistent with an autoradiography study that demonstrated a substantially larger binding of [3H]CP55,940 in the basal ganglia of the neonatal brain (BmaxPutamen=86 fmol/mg, BmaxGlobus pallidus=118 fmol/mg) versus the human adult brain (BmaxPutamen=44 fmol/mg, BmaxGlobus pallidus=82 fmol/mg) (Glass et al., 1997), but the PET data contradict to another [3H]CP55,940 autoradiography study that found that the CB1 binding in a gender-mixed set of human brains increases progressively from fetus and early prenatal stages to adulthood(Mato et al., 2003). We are not aware of the post-mortem CB1 binding studies within the aging human brain.
[11C]OMAR PET imaging of subjects with schizophrenia
A comparison of [11C]OMAR binding in the control subjects and subjects with SZ demonstrated a higher VT values in all brain regions of subjects with SZ (Figure 6), and this increase was significant in the pons by t-test (p < 0.05). The data did contain one outlier with extremely low CB1 binding (potentially a plasma input function problem), but all other psychological and demographic variables were within the group means. There was indeed an increase (15-22%) in binding in the most brain regions of the subjects with SZ, compared to controls, but the difference was not significant. However, in the pons the increase (23%) of VT in subjects with SZ compared to controls was significant (SZ VT GP = 0.93 ± 0.27; controls VTGP = 0.72 ± 0.07). Previous autoradiography data in schizophrenia demonstrated an increase of the [3H]SR141716 binding in the anterior cingulate cortex (Zavitsanou et al., 2004) and [3H]CP55,940 binding in the posterior cingulate cortex (Newell et al., 2006). We measured the VT values of [11C]OMAR in sub-regions of the cingulate cortex of SZ and control subjects (Figure 7), and found a non-significant increase of [11C]OMAR binding in all subdivisions of the cingulate cortex in subjects with SZ.
Figure 6.

Regional total volume of distributions (mean VT ± SEM) of [11C]OMAR are greater in SZ subjects than in controls. VT was signficantly higher in SZ in the Pons (PO), p < 0.05.
Figure 7.

Correlation of [11C]OMAR VT in the brain regions versus BPRS withdrawal scores (SZ group).
In order to examine even more rigorous subject matching, we used a t-test to compare the VT values of [11C]OMAR in the two SZ and control subjects matched by age, educational level and also parental SES, and found a significantly higher mean value for some regions such as the occipital cortex (mean VT=1.21(sd=0.05) c.f. mean VT=0.92(sd=0.05); p=0.029) and the putamen (mean VT=1.42(sd=0.06) c.f. mean VT=1.08(sd=0.04); p=0.015). However, as this subsample contained only a very small number of subjects, these findings are supportive but must be replicated. We would suggest that future studies should consider utilizing matching criteria that include racial group and educational level (Dickinson et al., 2007; Resnick, 1992) in larger samples.
All patients with SZ that we studied were taking the antipsychotic drugs olanzapine or risperidone, so there is a chance that these drugs may have affected the CB1 binding, as there have been a number of recent reports on this matter. Thus, it was found that risperidone treatment increased CB1 binding in the rat caudate nucleus, hippocampus and amygdala (Secher et al., 2009). In addition, ex vivo experiments in Sprague rats have demonstrated that olanzapine significantly decreases CB1 binding in the dorsal vagal complex of the brainstem in rats (Weston-Green et al., 2008). However, no evidence of binding of antipsychotic drugs clozapine, olanzapine and haloperidol at CB1 receptor was found in vitro (Theisen et al., 2007). Other antipsychotic drugs such as aripriprazole and haloperidol have been shown to have little effect on the CB1 binding ex vivo (Weston-Green et al., 2008). Experiments with rats that were chronically treated with various antipsychotic drugs demonstrated (Sundram et al., 2005) that clozapine decreases CB1 binding ([3H]CP55,940) in the nucleus accumbens while other regions (cortex, hippocampus and striatum) showed no change. However, the same study (Sundram et al., 2005) showed no effect with haloperidol, chlorpromazine or olanzapine. Overall, the existing body of research suggests that most antipsychotic drugs do not bind with CB1 receptor in vitro and do not change the CB1 radiotracer binding in the cortex and striatum (the regions with highest density of the CB1 receptor), but may decrease the CB1 radiotracer binding in the brainstem and amygdala, or, in case of risperidone, may increase the CB1 binding in the hypothalamus, hippocampus and amygdala. Risperidone and olanzapine seem to show the opposite effect on the CB1 binding of radiotracers in rodents. Because all of the SZ patients were prescribed olanzapine or riperidone we compared the [11C]OMAR binding in both subgroups, but found no significant difference (Appendix Figure 1).
[11C]OMAR PET binding and relationship of behavioral sub scores (BPRS for subjects with schizophrenia
The elevated binding of [11C]OMAR in subjects with SZ (Figure 6, 7) suggests that CB1 binding might correlate with type and severity of clinical symptoms of schizophrenia. However, we found no correlation between total score on the brief psychiatric rating scale (BPRS) and [11C]OMAR VT. In addition, there was no obvious association between the VT values and BPRS subscores, although there was a trend for the BPRS withdrawal symptom scores, whose severity showed a trend level with a decline of VT in the cortical brain regions (Figure 7). However, when we examined the difference and ratio between BPRS sub scores for positive symptoms (psychosis-type symptoms) to negative symptoms (withdrawal-type symptoms), we found some significant results. The SZ subjects (when examining 9 of the patients with SZ, excluding the outlier mentioned above) with the highest psychosis to withdrawal scores ratio, had the highest elevated CB1 receptors, suggesting a possible interaction between positive and negative symptoms and CB1 receptors (Figure 8). We found a significant correlation between the psychosis to withdrawal scores ratio and VT values in a number of different brain regions, including the frontal lobe (r = 0.49, p = 0.05), and the middle and posterior cingulate (r=0.71 p = 0.03, and r=0.79, p = 0.004 respectively). These results suggest that CB1 receptor binding in the subjects with SZ increases with severity of the positive symptoms and decreases with severity of negative symptoms.
Figure 8.

Correlation of [11C]OMAR VT in the brain regions of SZ subjects and severity of symptoms: VT vs. Positive/Negative symptoms.
Conclusions
[11C]OMAR readily enters human brain and shows a regional brain distribution that is consistent with that of cannabinoid receptors subtype 1 (CB1). The imaging properties of [11C]OMAR are sufficient for studying CB1 receptors in the human brain, including in those with neuropsychiatric disorders such as schizophrenia. It has reversible kinetics during the 90 minute PET scan. There were no significant safety issues with [11C] OMAR at high specific activity.
The total volume of distribution VT values of [11C]OMAR in the male control subjects show little age dependence in most brain regions, with low to intermediate binding that is consistent with the observations of other researchers that have utilized the CB1 tracer [18F]MK-9470. However, [11C]OMAR binding does appear to decline with increasing age in the healthy controls in the globus pallidus and putamen, the regions with highest values of VT.
Having demonstrated the feasibility and safety of [11C] OMAR in humans, our initial studies applied to a patient group, demonstrated elevated VT values in a small cohort of subjects with schizophrenia compared to normal controls. This VT difference was significant in the globus pallidus when examining all controls vs. all patients and also when the subjects with SZ were compared with age-matched controls. The age-matched cohort was a small group of 6 controls and 6 patients. Lastly, there were significant differences in the occipital lobe and putamen when additional matching criteria including racial group and education level were incorporated. Within patients with SZ, the VT values in certain brain regions correlated with positive and inversely with negative symptoms, suggesting that it may be possible to characterize the CB1 VT as it relates to type and severity of clinical symptoms in SZ. It may well be that accounting for the negative, as well as the positive symptoms of the disorder may help our further understanding of the role of the CB1 cannabinoid receptors in SZ. We recognize the ratio and differences of BPRS subscores has not been widely cited, and that this study involved a small sample. However this preliminary finding suggests a potential relationship between behavioral characteristics and CB1 binding, and is provocative. If supported with large numbers could provide neurochemical clues to CB1 involvement in schizophrenia. It is possible that subjects with SZ who have an inherent tendency to a particular symptomatology have abnormal VT values. It may be even possible that VT values may help predict those that are at greater risk of early decline into the negative syndrome of SZ, and thus these important initial findings warrant greater investigation.
Supplementary Material
Acknowledgments
Sanofi-Aventis, NIH grants DA000412, MH079017, Dean F. Wong
Footnotes
SZ=schizophrenia; PET=positron-emission tomography; BMI=Body mass index; BPRS=Brief Psychiatric Rating Scale; CDSS=Calgary Depression Scale for Schizophrenia; SAS=Simpson Angus Scale; MRI=magnetic resonace imaging; VOI=volume of interest; TAC=time-activity curves; BPND=binding potential; VT=total distribution volume; CB1= Cannabinoid receptor type 1; Fr=frontal cortex, Tp=temporal cortex, Pa=parietal cortex, Oc=occipital cortex, Fs=fusiform gyrus, Cg=cingulate cortex, PH=parahippocampus, Hp=hippocamus, In=insula, Pu=putamen, CN=caudate nucleus, GP=globus pallidus, Th=thalamus, Cb=cerebellum; vAC=ventral anterior cingulate, aAC=anterior anterior cingulate, dAC=dorsal anterior cingulate, mCg=middle cingulate, pCg=posteriorcingulate
Publisher's Disclaimer: This is a PDF file of an unedited manuscript that has been accepted for publication. As a service to our customers we are providing this early version of the manuscript. The manuscript will undergo copyediting, typesetting, and review of the resulting proof before it is published in its final citable form. Please note that during the production process errors may be discovered which could affect the content, and all legal disclaimers that apply to the journal pertain.
References
- 1.Current Good Manufacturing Practice for Positron Emission Tomography. Administration, DoHaHSFaD (Ed), 21 CFR, Parts 210, 211 and 212 2005 [Google Scholar]
- 2.Andreasson S, Allebeck P, Engstrom A, Rydberg U. Cannabis and schizophrenia. A longitudinal study of Swedish conscripts. Lancet. 1987;2:1483–1486. doi: 10.1016/s0140-6736(87)92620-1. [DOI] [PubMed] [Google Scholar]
- 3.Arseneault L, Cannon M, Poulton R, Murray R, Caspi A, Moffitt TE. Cannabis use in adolescence and risk for adult psychosis: longitudinal prospective study. BMJ. 2002;325:1212–1213. doi: 10.1136/bmj.325.7374.1212. [DOI] [PMC free article] [PubMed] [Google Scholar]
- 4.Ashburner JT, Friston KJ. Non-linear registration. In: Friston KJ, Ashburner JT, Kiebel SJ, Nichols TE, editors. Statistical Parametric Mapping: The Analysis of Functional Brain Images. Academic Press; 2007a. pp. 63–80. [Google Scholar]
- 5.Ashburner JT, Friston KJ. Rigid body registration. In: Friston KJ, Ashburner JT, Kiebel SJ, Nichols TE, editors. Statistical Parametric Mapping: The Analysis of Functional Brain Images. Academic Press; 2007b. pp. 49–62. [Google Scholar]
- 6.Berding G, Schneider U, Gielow P, Buchert R, Donnerstag F, Brandau W, Knapp WH, Emrich HM, Muller-Vahl K. Feasibility of central cannabinoid CB1 receptor imaging with [124I]AM281 PET demonstrated in a schizophrenic patient. Psychiatry Research. 2006;147:249–256. doi: 10.1016/j.pscychresns.2006.02.002. [DOI] [PubMed] [Google Scholar]
- 7.Burns HD, Van Laere K, Sanabria-Bohorquez S, Hamill TG, Bormans G, Eng WS, Gibson R, Ryan C, Connolly B, Patel S, Krause S, Vanko A, Van Hecken A, Dupont P, De Lepeleire I, Rothenberg P, Stoch SA, Cote J, Hagmann WK, Jewell JP, Lin LS, Liu P, Goulet MT, Gottesdiener K, Wagner JA, de Hoon J, Mortelmans L, Fong TM, Hargreaves RJ. [18F]MK-9470, a positron emission tomography (PET) tracer for in vivo human PET brain imaging of the cannabinoid-1 receptor. Proceedings of the National Academy of Sciences of the United States of America. 2007;104:9800–9805. doi: 10.1073/pnas.0703472104. [DOI] [PMC free article] [PubMed] [Google Scholar]
- 8.Bush G, Luu P, Posner MI. Cognitive and emotional influences in anterior cingulate cortex. Trends Cogn Sci. 2000;4:215–222. doi: 10.1016/s1364-6613(00)01483-2. [DOI] [PubMed] [Google Scholar]
- 9.Chavarria-Siles I, Contreras-Rojas J, Hare E, Walss-Bass C, Quezada P, Dassori A, Contreras S, Medina R, Ramirez M, Salazar R, Raventos H, Escamilla MA. Cannabinoid receptor 1 gene (CNR1) and susceptibility to a quantitative phenotype for hebephrenic schizophrenia. Am J Med Genet B Neuropsychiatr Genet. 2008;147:279–284. doi: 10.1002/ajmg.b.30592. [DOI] [PubMed] [Google Scholar]
- 10.Coutts AA, Anavi-Goffer S, Ross RA, MacEwan DJ, Mackie K, Pertwee RG, Irving AJ. Agonist-induced internalization and trafficking of cannabinoid CB1 receptors in hippocampal neurons. Journal of Neuroscience. 2001;21:2425–2433. doi: 10.1523/JNEUROSCI.21-07-02425.2001. [DOI] [PMC free article] [PubMed] [Google Scholar]
- 11.D'Souza DC. Cannabinoids and psychosis. International Review of Neurobiology. 2007;78:289–326. doi: 10.1016/S0074-7742(06)78010-2. [DOI] [PubMed] [Google Scholar]
- 12.D'Souza DC, Abi-Saab WM, Madonick S, Forselius-Bielen K, Doersch A, Braley G, Gueorguieva R, Cooper TB, Krystal JH. Delta-9-tetrahydrocannabinol effects in schizophrenia: implications for cognition, psychosis, and addiction. Biological Psychiatry. 2005;57:594–608. doi: 10.1016/j.biopsych.2004.12.006. [DOI] [PubMed] [Google Scholar]
- 13.D'Souza DC, Sewell RA, Ranganathan M. Cannabis and psychosis/schizophrenia: human studies. European Archives of Psychiatry and Clinical Neuroscience. 2009;259:413–431. doi: 10.1007/s00406-009-0024-2. [DOI] [PMC free article] [PubMed] [Google Scholar]
- 14.Dean B, Sundram S, Bradbury R, Scarr E, Copolov D. Studies on [3H]CP-55940 binding in the human central nervous system: regional specific changes in density of cannabinoid-1 receptors associated with schizophrenia and cannabis use. Neuroscience. 2001;103:9–15. doi: 10.1016/s0306-4522(00)00552-2. [DOI] [PubMed] [Google Scholar]
- 15.Dickinson D, Ramsey ME, Gold JM. Overlooking the obvious: a meta-analytic comparison of digit symbol coding tasks and other cognitive measures in schizophrenia. Archives of General Psychiatry. 2007;64:532–542. doi: 10.1001/archpsyc.64.5.532. [DOI] [PubMed] [Google Scholar]
- 16.Disorders, APADaSMoM. Fourth. American Psychiatric Association; Washington, DC: 2000. [Google Scholar]
- 17.Eggan SM, Hashimoto T, Lewis DA. Reduced cortical cannabinoid 1 receptor messenger RNA and protein expression in schizophrenia. Archives of General Psychiatry. 2008;65:772–784. doi: 10.1001/archpsyc.65.7.772. [DOI] [PMC free article] [PubMed] [Google Scholar]
- 18.Fan H, Ravert HT, Holt DP, Dannals RF, Horti AG. Synthesis of 1-(2,4-dichlorophenyl)-4-cyano-5-(4-[11C]methoxyphenyl)-N-(piperidin-1-yl)-1H-pyrazole-3-carboxamide ([11C]JHU75528) and 1-(2-bromophenyl)-4-cyano-5-(4-[11C]methoxyphenyl)-N-(piperidin-1-yl)-1H-pyrazole-3-carboxamide ([11C]JHU75575) as potential radioligands for PET imaging of cerebral cannabinoid receptor. Journal of Labelled Compounds and Radiopharmaceuticals. 2006;49:1021–1036. [Google Scholar]
- 19.Fornito A, Whittle S, Wood SJ, Velakoulis D, Pantelis C, Yucel M. The influence of sulcal variability on morphometry of the human anterior cingulate and paracingulate cortex. Neuroimage. 2006;33:843–854. doi: 10.1016/j.neuroimage.2006.06.061. [DOI] [PubMed] [Google Scholar]
- 20.Fornito A, Yucel M, Wood SJ, Adamson C, Velakoulis D, Saling MM, McGorry PD, Pantelis C. Surface-based morphometry of the anterior cingulate cortex in first episode schizophrenia. Human Brain Mapping. 2008;29:478–489. doi: 10.1002/hbm.20412. [DOI] [PMC free article] [PubMed] [Google Scholar]
- 21.Giuffrida A, Leweke FM, Gerth CW, Schreiber D, Koethe D, Faulhaber J, Klosterkotter J, Piomelli D. Cerebrospinal anandamide levels are elevated in acute schizophrenia and are inversely correlated with psychotic symptoms. Neuropsychopharmacology. 2004;29:2108–2114. doi: 10.1038/sj.npp.1300558. [DOI] [PubMed] [Google Scholar]
- 22.Glass M, Dragunow M, Faull RL. Cannabinoid receptors in the human brain: a detailed anatomical and quantitative autoradiographic study in the fetal, neonatal and adult human brain. Neuroscience. 1997;77:299–318. doi: 10.1016/s0306-4522(96)00428-9. [DOI] [PubMed] [Google Scholar]
- 23.Hanus LO. Pharmacological and therapeutic secrets of plant and brain (endo)cannabinoids. Medicinal Research Reviews. 2009;29:213–271. doi: 10.1002/med.20135. [DOI] [PubMed] [Google Scholar]
- 24.Henquet C, Krabbendam L, Spauwen J, Kaplan C, Lieb R, Wittchen HU, van Os J. Prospective cohort study of cannabis use, predisposition for psychosis, and psychotic symptoms in young people. BMJ. 2005;330:11. doi: 10.1136/bmj.38267.664086.63. [DOI] [PMC free article] [PubMed] [Google Scholar]
- 25.Herkenham M, Lynn AB, Little MD, Johnson MR, Melvin LS, de Costa BR, Rice KC. Cannabinoid receptor localization in brain. Proceedings of the National Academy of Sciences of the United States of America. 1990;87:1932–1936. doi: 10.1073/pnas.87.5.1932. [DOI] [PMC free article] [PubMed] [Google Scholar]
- 26.Hilton J, Yokoi F, Dannals RF, Ravert HT, Szabo Z, Wong DF. Column-switching HPLC for the analysis of plasma in PET imaging studies. Nuclear Medicine and Biology. 2000;27:627–630. doi: 10.1016/s0969-8051(00)00125-6. [DOI] [PubMed] [Google Scholar]
- 27.Horti AG, Fan H, Kuwabara H, Hilton J, Ravert HT, Holt DP, Alexander M, Kumar A, Rahmim A, Scheffel U, Wong DF, Dannals RF. 11C-JHU75528: a radiotracer for PET imaging of CB1 cannabinoid receptors. Journal of Nuclear Medicine. 2006;47:1689–1696. [PubMed] [Google Scholar]
- 28.Horti AG, Fan H, Ravert HT, Holt DP, Hilton J, Kumar A, Alexander M, Rahman A, Hoffman A, Lupica C, Kuwabara H, Wong DF, Dannals RF. [11C]JHU75528 a PET radioligand for imaging of cerebral cannabinoid CB1 receptors. 39-th meeting of European Brain and Behaviour Society; Trieste, Italy. 2007. [Google Scholar]
- 29.Horti AG, Van Laere K. Development of Radioligands for In Vivo Imaging of Type 1 Cannabinoid Receptors (CB1) in Human Brain. Current Pharmaceutical Design. 2008 doi: 10.2174/138161208786549380. in press. [DOI] [PubMed] [Google Scholar]
- 30.Howlett AC, Barth F, Bonner TI, Cabral G, Casellas P, Devane WA, Felder CC, Herkenham M, Mackie K, Martin BR, Mechoulam R, Pertwee RG. International Union of Pharmacology. XXVII. Classification of cannabinoid receptors. Pharmacological Reviews. 2002;54:161–202. doi: 10.1124/pr.54.2.161. [DOI] [PubMed] [Google Scholar]
- 31.Innis RB, Cunningham VJ, Delforge J, Fujita M, Gjedde A, Gunn RN, Holden J, Houle S, Huang SC, Ichise M, Iida H, Ito H, Kimura Y, Koeppe RA, Knudsen GM, Knuuti J, Lammertsma AA, Laruelle M, Logan J, Maguire RP, Mintun MA, Morris ED, Parsey R, Price JC, Slifstein M, Sossi V, Suhara T, Votaw JR, Wong DF, Carson RE. Consensus nomenclature for in vivo imaging of reversibly binding radioligands. Journal of Cerebral Blood Flow and Metabolism. 2007;27:1533–1539. doi: 10.1038/sj.jcbfm.9600493. [DOI] [PubMed] [Google Scholar]
- 32.Jones JP, Rahman A, Sibomana M, Crabb AH, Burbar Z, Cavanaugh CB, Michel C, Wong Dean F. Data processing methods for a high throughput brain imaging PET research center. IEEE Medical Imagaging Conference 2006 [Google Scholar]
- 33.Koethe D, Llenos IC, Dulay JR, Hoyer C, Torrey EF, Leweke FM, Weis S. Expression of CB1 cannabinoid receptor in the anterior cingulate cortex in schizophrenia, bipolar disorder, and major depression. Journal of Neural Transmission. 2007;114:1055–1063. doi: 10.1007/s00702-007-0660-5. [DOI] [PubMed] [Google Scholar]
- 34.Leweke FM, Giuffrida A, Wurster U, Emrich HM, Piomelli D. Elevated endogenous cannabinoids in schizophrenia. Neuroreport. 1999;10:1665–1669. doi: 10.1097/00001756-199906030-00008. [DOI] [PubMed] [Google Scholar]
- 35.Logan J, Fowler JS, Volkow ND, Wolf AP, Dewey SL, Schlyer DJ, Macgregor RR, Hitzemann R, Bendriem B, Gatley SJ. Graphical analysis of reversible radioligand binding from time-activity measurements applied to [N- 11 C-methyl]-(-)-cocaine PET studies in human subjects. Journal of Cerebral Blood Flow and Metabolism. 1990;10:740. doi: 10.1038/jcbfm.1990.127. [DOI] [PubMed] [Google Scholar]
- 36.Mato S, Del Olmo E, Pazos A. Ontogenetic development of cannabinoid receptor expression and signal transduction functionality in the human brain. European Journal of Neuroscience. 2003;17:1747–1754. doi: 10.1046/j.1460-9568.2003.02599.x. [DOI] [PubMed] [Google Scholar]
- 37.Mechoulam R. Interview with Prof. Raphael Mechoulam, codiscoverer of THC. Interview by Stanley Einstein. International Journal of the Addictions. 1986;21:579–587. doi: 10.3109/10826088609083542. [DOI] [PubMed] [Google Scholar]
- 38.Mouslech Z, Valla V. Endocannabinoid system: An overview of its potential in current medical practice. Neuro Endocrinol Lett. 2009;30:153–179. [PubMed] [Google Scholar]
- 39.Newell KA, Deng C, Huang XF. Increased cannabinoid receptor density in the posterior cingulate cortex in schizophrenia. Exp Brain Res. 2006;172:556–560. doi: 10.1007/s00221-006-0503-x. [DOI] [PubMed] [Google Scholar]
- 40.Onaivi ES, Ishiguro H, Gong JP, Patel S, Meozzi PA, Myers L, Perchuk A, Mora Z, Tagliaferro PA, Gardner E, Brusco A, Akinshola BE, Hope B, Lujilde J, Inada T, Iwasaki S, Macharia D, Teasenfitz L, Arinami T, Uhl GR. Brain neuronal CB2 cannabinoid receptors in drug abuse and depression: from mice to human subjects. PLoS ONE. 2008;3:e1640. doi: 10.1371/journal.pone.0001640. [DOI] [PMC free article] [PubMed] [Google Scholar]
- 41.Pertwee RG. Ligands that target cannabinoid receptors in the brain: from THC to anandamide and beyond. Addict Biol. 2008;13:147–159. doi: 10.1111/j.1369-1600.2008.00108.x. [DOI] [PubMed] [Google Scholar]
- 42.Rahmim A, Cheng JC, Blinder S, Camborde ML, Sossi V. Statistical dynamic image reconstruction in state-of-the-art high-resolution PET. Physics in Medicine and Biology. 2005;50:4887–4912. doi: 10.1088/0031-9155/50/20/010. [DOI] [PubMed] [Google Scholar]
- 43.Resnick SM. Matching for education in studies of schizophrenia. Archives of General Psychiatry. 1992;49:246. doi: 10.1001/archpsyc.1992.01820030078011. [DOI] [PubMed] [Google Scholar]
- 44.Secher A, Husum H, Holst B, Egerod KL, Mellerup E. Risperidone Treatment Increases CB(1) Receptor Binding in Rat Brain. Neuroendocrinology. 2009 doi: 10.1159/000245220. [DOI] [PubMed] [Google Scholar]
- 45.Sossi V, De Jong M, Barker W, Bloomfield P, Burbar Z, Camborde ML, Comtat C, Eriksson LA, Houle S, Houle S, Keator D, Knob C, Krais R, Lammertsma AA, Rahmim A, Sibomana M, Teras M, Thompson CJ, Trebossen R, Votaw J, Walker MJ, Wienhard K, Wong DF. The second generation HRRT: a multi-centre scanner performance investigation. IEEE Nucl Sci Symp Conf. 2005:2195–2199. [Google Scholar]
- 46.Sundram S, Copolov D, Dean B. Clozapine decreases [3H] CP 55940 binding to the cannabinoid 1 receptor in the rat nucleus accumbens. Naunyn Schmiedebergs Arch Pharmacol. 2005;371:428–433. doi: 10.1007/s00210-005-1074-2. [DOI] [PubMed] [Google Scholar]
- 47.Talairach Tornoux. Co-planar stereotaxic atlas of the human brain. Thieme Medical Publishers; New York: 1988. [Google Scholar]
- 48.Terry GE, Liow JS, Zoghbi SS, Hirvonen J, Farris AG, Lerner A, Tauscher JT, Schaus JM, Phebus L, Felder CC, Morse CL, Hong JS, Pike VW, Halldin C, Innis RB. Quantitation of cannabinoid CB(1) receptors in healthy human brain using positron emission tomography and an inverse agonist radioligand. Neuroimage. 2009 doi: 10.1016/j.neuroimage.2009.06.059. [DOI] [PMC free article] [PubMed] [Google Scholar]
- 49.Theisen FM, Haberhausen M, Firnges MA, Gregory P, Reinders JH, Remschmidt H, Hebebrand J, Antel J. No evidence for binding of clozapine, olanzapine and/or haloperidol to selected receptors involved in body weight regulation. Pharmacogenomics J. 2007;7:275–281. doi: 10.1038/sj.tpj.6500418. [DOI] [PubMed] [Google Scholar]
- 50.Tzourio-Mazoyer N, Landeau B, Papathanassiou D, Crivello F, Etard O, Delcroix N, Mazoyer B, Joliot M. Automated anatomical labeling of activations in SPM using a macroscopic anatomical parcellation of the MNI MRI single-subject brain. Neuroimage. 2002;15:273–289. doi: 10.1006/nimg.2001.0978. [DOI] [PubMed] [Google Scholar]
- 51.Ujike H, Takaki M, Nakata K, Tanaka Y, Takeda T, Kodama M, Fujiwara Y, Sakai A, Kuroda S. CNR1, central cannabinoid receptor gene, associated with susceptibility to hebephrenic schizophrenia. Molecular Psychiatry. 2002;7:515–518. doi: 10.1038/sj.mp.4001029. [DOI] [PubMed] [Google Scholar]
- 52.Uriguen L, Garcia-Fuster MJ, Callado LF, Morentin B, La Harpe R, Casado V, Lluis C, Franco R, Garcia-Sevilla JA, Meana JJ. Immunodensity and mRNA expression of A2A adenosine, D2 dopamine, and CB1 cannabinoid receptors in postmortem frontal cortex of subjects with schizophrenia: effect of antipsychotic treatment. Psychopharmacology. 2009;206:313–324. doi: 10.1007/s00213-009-1608-2. [DOI] [PubMed] [Google Scholar]
- 53.Van Laere K, Goffin K, Bormans G, Casteels C, Mortelmans L, de Hoon J, Grachev I, Vandenbulcke M, Pieters G. Relationship of type 1 cannabinoid receptor availability in the human brain to novelty-seeking temperament. Archives of General Psychiatry. 2009;66:196–204. doi: 10.1001/archgenpsychiatry.2008.530. [DOI] [PubMed] [Google Scholar]
- 54.Van Laere K, Goffin K, Casteels C, Dupont P, Mortelmans L, de Hoon J, Bormans G. Gender-dependent increases with healthy aging of the human cerebral cannabinoid-type 1 receptor binding using [(18)F]MK-9470 PET. Neuroimage. 2008a;39:1533–1541. doi: 10.1016/j.neuroimage.2007.10.053. [DOI] [PubMed] [Google Scholar]
- 55.Van Laere K, Koole M, Sanabria Bohorquez SM, Goffin K, Guenther I, Belanger MJ, Cote J, Rothenberg P, De Lepeleire I, Grachev ID, Hargreaves RJ, Bormans G, Burns HD. Whole-body biodistribution and radiation dosimetry of the human cannabinoid type-1 receptor ligand 18F-MK-9470 in healthy subjects. Journal of Nuclear Medicine. 2008b;49:439–445. doi: 10.2967/jnumed.107.047290. [DOI] [PubMed] [Google Scholar]
- 56.van Os J, Bak M, Hanssen M, Bijl RV, de Graaf R, Verdoux H. Cannabis use and psychosis: a longitudinal population-based study. American Journal of Epidemiology. 2002;156:319–327. doi: 10.1093/aje/kwf043. [DOI] [PubMed] [Google Scholar]
- 57.Vogt BA, Berger GR, Derbyshire SW. Structural and functional dichotomy of human midcingulate cortex. European Journal of Neuroscience. 2003;18:3134–3144. doi: 10.1111/j.1460-9568.2003.03034.x. [DOI] [PMC free article] [PubMed] [Google Scholar]
- 58.Vogt BA, Laureys S. Posterior cingulate, precuneal and retrosplenial cortices: cytology and components of the neural network correlates of consciousness. Progress in Brain Research. 2005;150:205–217. doi: 10.1016/S0079-6123(05)50015-3. [DOI] [PMC free article] [PubMed] [Google Scholar]
- 59.Weston-Green K, Huang XF, Han M, Deng C. The effects of antipsychotics on the density of cannabinoid receptors in the dorsal vagal complex of rats: implications for olanzapine-induced weight gain. Int J Neuropsychopharmacol. 2008;11:827–835. doi: 10.1017/S1461145708008560. [DOI] [PubMed] [Google Scholar]
- 60.Wong DF, Kuwabara H, Horti A, Kumar A, Brasic J, Ye W, Alexander M, Raymont J, Galecki J, Charlotte M, Cascella N. PET imaging of cannabinoid CB1 type receptors in healthy humans and patients with schizophrenia using [11C]OMAR. NeuroReceptor Mapping. 2008a;41:T51. [Google Scholar]
- 61.Wong DF, Kuwabara H, Horti AG, Kumar A, Brasic J, Ye W, Alexander M, Hilton J, Williams V, Ravert HT, Dannals RF. Imaging of Human Cannaboid CB1 Type Human Receptors with [11C]OMAR. 55th Annual Meeting of the Society of Nuclear Medicine; New Orleans, Louisiana. 2008b. [Google Scholar]
- 62.Yasuno F, Brown AK, Zoghbi SS, Krushinski JH, Chernet E, Tauscher J, Schaus JM, Phebus LA, Chesterfield AK, Felder CC, Gladding RL, Hong J, Halldin C, Pike VW, Innis RB. The PET radioligand [11C]MePPEP binds reversibly and with high specific signal to cannabinoid CB1 receptors in nonhuman primate brain. Neuropsychopharmacology. 2008;33:259–269. doi: 10.1038/sj.npp.1301402. [DOI] [PubMed] [Google Scholar]
- 63.Zammit S, Allebeck P, Andreasson S, Lundberg I, Lewis G. Self reported cannabis use as a risk factor for schizophrenia in Swedish conscripts of 1969: historical cohort study. BMJ. 2002;325:1199. doi: 10.1136/bmj.325.7374.1199. [DOI] [PMC free article] [PubMed] [Google Scholar]
- 64.Zavitsanou K, Garrick T, Huang XF. Selective antagonist [3H]SR141716A binding to cannabinoid CB1 receptors is increased in the anterior cingulate cortex in schizophrenia. Prog Neuropsychopharmacol Biol Psychiatry. 2004;28:355–360. doi: 10.1016/j.pnpbp.2003.11.005. [DOI] [PubMed] [Google Scholar]
Associated Data
This section collects any data citations, data availability statements, or supplementary materials included in this article.