

SUMMARY
Candida albicans is a gut commensal and opportunistic pathogen. The transition between yeast and invasive hyphae is central to virulence but has unknown functions during commensal growth. In a mouse model of colonization, yeast and hyphae co-occur throughout the gastrointestinal tract. However, competitive infections of C. albicans homozygous gene disruption mutants revealed an unanticipated, inhibitory role for the yeast-to-hypha morphogenesis program on commensalism. We show that the transcription factor Ume6, a master regulator of filamentation, inhibits gut colonization, not by effects on cell shape, but by activating the expression of a hypha-specific pro-inflammatory secreted protease, Sap6, and a hyphal cell surface adhesin, Hyr1. Like a ume6 mutant, strains lacking SAP6 exhibit enhanced colonization fitness, whereas SAP6-overexpression strains are attenuated in the gut. These results reveal a tradeoff between fungal programs supporting commensalism and virulence in which selection against hypha-specific markers limits the disease-causing potential of this ubiquitous commensal-pathogen.
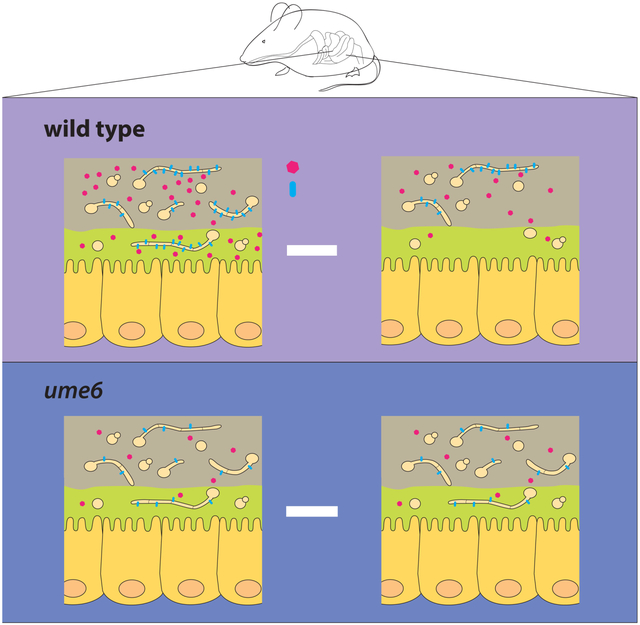
Graphical Abstract
eTOC PARAGRAPH
C. albicans is a fungal commensal-pathogen of mammals. Witchley, Penumetcha et al. show that a filamentation program that promotes fungal virulence inhibits commensal fitness in the gut. This effect is mediated, not by cell morphology, but by expression of hypha-specific virulence factors that appear to trigger negative selection.
INTRODUCTION
As the most common fungal pathogen of humans, Candida albicans causes hundreds of millions of symptomatic infections each year (Bongomin et al., 2017; Brown et al., 2012; Pfaller and Diekema, 2007). Diseases range from superficial infections of the skin and mucous membranes to highly morbid, invasive infections of internal organs (Brown et al., 2012; Odds, 1987; Pfaller and Diekema, 2007). However, the vast majority of C. albicans-host interactions are asymptomatic, as this fungus is a normal component of human gut microbiota. Most individuals are colonized in childhood, and infecting fungal clones are thought to persist quiescently over a lifetime (Odds et al., 2006). Colonization may even benefit the host; for example, commensal C. albicans can stimulate development of the mucosal immune system in gnotobiotic mice (Atarashi et al., 2015). How this organism mediates such diverse interactions with mammalian hosts is an area of ongoing investigation.
The transition from yeast to hyphal cell morphology plays a central role in C. albicans pathogenesis (Noble et al., 2017). Whereas yeast predominate under standard culture conditions, hyphae can be induced by exposure to host-associated cues in vitro or to animal models of disease. Round-to-oval-shaped yeast separate after cell division, whereas highly elongated hyphal cells remain attached and produce complex, branching, filamentous networks. Hyphae are naturally invasive, able to penetrate through agar-based media in vitro and epithelial and endothelial barriers in the host. Hyphae also express cell type-specific virulence factors such as degradative enzymes (e.g., the Sap family of secreted aspartyl proteases), cell surface adhesins (e.g., Als3, Hwp1, and Hyr1), and the pore-forming toxin, Candidalysin (Carlisle et al., 2009; Carlisle and Kadosh, 2013; Kadosh and Johnson, 2005; Lane et al., 2001; Moyes et al., 2016; Nantel et al., 2002). The yeast-to-hypha transition is controlled by the hyphal gene regulatory network, an environmentally-responsive gene regulatory cascade. Mutants that disrupt this network are generally defective in animal models of virulence (Lo et al., 1997; Lu et al., 2013; reviewed in Mayer et al., 2013).
The roles of hyphae and yeast in commensalism are less well-defined. The mammalian digestive tract is replete with signals that trigger yeast-to-hypha morphogenesis in the laboratory, including hypoxia (Lu et al., 2013; Saltzman and Sieker, 1968; Zheng et al., 2015), hypercarbia (Kalantar-Zadeh et al., 2018; Lu et al., 2013; Rune and Henriksen, 1969), and N-acetylglucosamine (reviewed in Tailford et al., 2015; Castilla et al., 1998; Naseem and Konopka, 2015; Simonetti et al., 1974). Consistent with the presence of hyphae in this niche, hypha-associated transcripts have been detected in animal models of gut colonization (Rosenbach et al., 2010; White et al., 2007). However, based on direct visualization of organisms washed from intestines of colonized mice, two groups reported that yeast compose more than 90% of the commensal fungal population (Vautier et al., 2015; White et al., 2007). A third group recently reported that hypha-like shapes predominate (~70%) in the sectioned intestines of conventionally reared animals after colonization with C. albicans, whereas yeast-like shapes predominate (~90%) in animals that had been reared under gnotobiotic conditions (Perez et al.). To date, no studies have quantified C. albicans yeast and hyphae in situ (e.g. by FISH or immunostaining) or in relationship to host anatomy.
To gain insight into commensal interactions between C. albicans and mammalian hosts, we performed competitive infections of ~650 C. albicans homozygous gene disruption mutants in a mouse model of stable gastrointestinal (GI) colonization. Four mutants lacking transcriptional activators of the hyphal gene regulatory network displayed hypercompetitive phenotypes, suggesting an unanticipated role for this program in inhibiting commensalism. Similarly, disruption of UME6, which encodes a ‘master regulator’ of filamentation, conferred enhanced commensal fitness, whereas overexpression of UME6 produced a commensal defect. To determine whether these fitness changes are associated with changes in cell morphology, we developed a fluorescence in situ hybridization (FISH) technique to visualize C. albicans in the host digestive tract. Wild type was found to colonize as a mixed population of yeast and hyphae, with yeast predominating in the stomach and small intestines and hyphae predominating more distally. Surprisingly, ume6 colonized with a near identical pattern of yeast and hyphae, in striking contrast to its filamentation defect under in vitro conditions. These results indicate that Ume6 is dispensible for morphogenesis in the gut, and that a variable other than cell morphology fosters the hypercommensal phenotype of the ume6 null mutant. Using mRNA-Seq, we performed comparative transcriptomics of commensally-propagated wild-type and ume6 strains to identify ~50 hypha-associated genes that require Ume6 for normal expression in the gut. Remarkably, disruption of one of these genes, encoding a hypha-specific secreted aspartyl protease that is known to elicit pro-inflammatory responses from host immune cells (Sap6; Gabrielli et al., 2015; Gabrielli et al., 2016; Pietrella et al., 2013; Pietrella et al., 2010), confers a commensal fitness advantage similar to that of ume6, whereas overexpression attenuates fitness. Thus, expression of Sap6 and other hypha-specific genes, an asset for tissue invasion, is a liability for successful commensalism. We propose that this antagonistic relationship is central to the balance achieved by C. albicans between commensal and pathogenic infection of mammals.
RESULTS
Identification of four Candida albicans mutants with enhanced commensal fitness
We previously reported the construction of >650 C. albicans homozygous gene disruption strains (Homann et al., 2009; Noble et al., 2010). Because the genome is diploid, two selectable markers (Candida dubliniensis HIS1, Candida maltosa LEU2) were used to replace the two alleles of each target ORF. Individual mutants were also barcoded with one of 48 oligonucleotide sequences to allow for quantitation of strains in competition experiments. The number of barcodes was selected based on the number of mutants that could be successfully co-infected in a mouse tail vein model of virulence.
To facilitate screens of larger pools of mutants, we recently developed a protocol to sequence stretches of genomic DNA that abut C. dubliniensis HIS1 marker. Because this marker replaces the disrupted ORF in each mutant, adjacent genomic sequences are unique and can serve as functional ‘barcodes.’ As described in the Methods, the relevant genomic sequences are amplified by linear PCR, following by high-throughput sequencing. The relative abundance of each mutant in a pool is calculated from the reads of its ORF-flanking sequence compared to all sequencing reads.
We used this method to quantify the competitive fitness of ~650 C. albicans mutants in a mouse model of persistent GI commensalism (Figure 1A). Mutants and an isogenic wild-type control were propagated individually in liquid fungal medium (YPD), then pooled, washed, and introduced directly into three BALB/c mice by gavage. Because commensally colonized animals remain healthy, the progress of each competition experiment could be monitored through serial analysis of feces. Samples of the inocula (“I”) and feces recovered (“R”) after 3-5 and 10 days of colonization were plated on Sabouraud agar (with ampicillin and gentamicin), followed by purification of genomic DNA and preparation of sequencing libraries, as described above. The competitive index of each strain was defined as a log(2) function of relative strain abundance in the recovered pool compared to the inoculum.
Figure 1. Activators of C. albicans filamentation inhibit gut commensalism.

A) Schematic of commensalism screens. ~650 C. albicans mutants and wild type (WT, SN250) were gavaged into BALB/c mice (n= 2-3 animals/inoculum). Feces was sampled after 3-5 and 10 days, and strains recovered by plating. Sequencing libraries were prepared from genomic DNA abutting the disrupted ORFs (mutants) or C.a.LEU2 gene (WT). Competitive indexes (CI) were calculated as the log2 function of (R/I), based on samples recovered from the host (R) and the inoculum (I). See also Tables S1, S2, and S3. B) Results from one animal after 10 days. efg1 (red) outcompeted WT (black) and all other mutants (gray). C) Hypercompetitive mutants were recovered from three commensalism screens. Screen 1 tested all mutant and WT; Screen 2 excluded efg1; Screen 3 excluded efg1, brg1, and rob1. Each data points indicate the CI for the indicated strain in one animal. Bars indicate the mean. D) Hyphal gene regulatory circuit (note that not all regulators are shown). Efg1, Brg1, Rob1, Tec1, and Ume6 activate expression of genes required for morphogenesis and genes that are upregulated in hyphae. Efg1 has been shown to activate UME6 by epistasis analysis and ChIP-Seq (Banerjee et al., 2013; Zeidler et al., 2009). Brg1 and Tec1 have been shown to bind to the UME6 promoter by ChIP-Seq (Childers and Kadosh, 2015; Nobile et al., 2012).
Results of the initial screen (Screen 1) are presented in Figures 1B, 1C, and Table S1A. Figure 1B depicts the competitive indexes of all strains in a single, representative animal. Here, efg1 (shown in red) outcompeted every other mutant (gray) and wild-type C. albicans (WT, black). As shown in Figure 1C, this result was reproduced in all three test animals (Figure 1C). efg1 has previously been reported to exhibit enhanced commensalism in smaller studies (Pande et al., 2013; Pierce et al.; Pierce and Kumamoto). To identify additional fungal commensalism factors, we repeated the screen using an inoculum containing every strain except for efg1. To our surprise, two additional hyperfit mutants, brg1 and rob1, were identified in the second screen (Screen 2; Figure 1C and Table S1B). The recovery of three enhanced fitness mutants in our commensalism screen contrasts with previous screens of the same mutants in a disseminated infection model, in which only loss-of-fitness mutants were obtained (Noble et al., 2010; Perez et al.). The presence of hyperfit strains distorts the abundance of other strains in a pool, thereby precluding the ability to identify loss-of-fitness mutants. We reasoned that, if efg1, brg1, and rob1 are the only hypercommensal mutants in our collection, then testing the remaining strains might reveal attenuated strains that lack activators or effectors of commensalism. However, as shown in Figure 1C and Table S1C, a third screen (Screen 3) of every mutant except for efg1, brg1, and rob1 identified tec1 as a fourth hyperfit mutant. These results suggest that C. albicans expresses multiple factors that restrain its own capacity for gut colonization.
Transcriptional activators of filamentation inhibit commensalism in the gut
Remarkably, the four mutants identified in our commensalism screens affect transcription factors with previously described roles in C. albicans morphogenesis (Braun and Johnson, 2000; Doedt et al., 2004; Du et al., 2012; Homann et al., 2009; Lo et al., 1997; Lu et al., 2012; Nobile et al., 2012; Ramage et al., 2002; Schweizer et al., 2000; Stoldt et al., 1997) and virulence (Du et al., 2012; Lo et al., 1997; Schweizer et al., 2000). As shown in the schematic in Figure 1D, Efg1, Rob1, Brg1, and Tec1 activate the expression of genes associated with yeast-to-hypha morphogenesis (Lassak et al., 2011; Leng et al., 2001; Lu et al., 2012; Nobile et al., 2012). In addition, Efg1, Brg1, and Tec1 promote filamentation indirectly by activating expression of the ‘master regulator’, Ume6 (Lassak et al., 2011; Nobile et al., 2012; Nobile and Mitchell, 2005). Null mutants targeting EFG1, RBG1, ROB1, TEC1, and UME6 are defective for filamentation in vitro (Banerjee et al., 2008; Braun and Johnson, 2000; Du et al., 2012; Homann et al., 2009; Lo et al., 1997; Schweizer et al., 2000), and efg1, brg1, tec1, and ume6 exhibit virulence defects in animal models of disseminated infection (Banerjee et al., 2008; Du et al., 2012; Lo et al., 1997; Schweizer et al., 2000).
The recovery of four key components of the hyphal gene regulatory network in our gut colonization screens suggested a potential role for this network in the control of fungal commensalism. To validate the primary screens, we retested two independent isolates of each transcription factor mutant in 1:1 commensal competitions with wild type (Figure 2A). As shown in Figure 2B-E and Figure S1A-D, all four mutants reproduced their original hyperfit phenotypes.
Figure 2. efg1, brg1, rob1, tec1, and ume6 exhibit enhanced commensal fitness, while UME6OE has reduced fitness.

A) Schematic of competition experiments. Mice were gavaged with 1:1 mixtures of WT and each commensalism mutant, strain abundance in feces was monitored for ≥25-days using qPCR. B-G) Results for: (B) WT (ySN226) vs. efg1 (ySN119), (C) WT (ySN425) vs. brg1 (ySN1180), (D) WT (ySN250) vs. rob1 (ySN1440), (E) WT (ySN250) vs. tec1 (ySN1442), (F) WT (ySN250) vs. ume6 (ySN1479), (G) WT (ySN1556) vs. UME6OE (ySN1558). Bars represent the mean. Significance was determined using the paired student’s t-test: n.s. not significant, *p<0.05, **p<0.01, ***p<0.001, ****p<0.0001. Additional results are presented in Figures S1, S2, and S3.
Following euthanasia of the animals, we also evaluated strain abundance in samples recovered directly from the digestive tract. Results were virtually identical regardless of whether feces, gut tissue, or luminal contents were analyzed (Figure S2), supporting our use of feces as a proxy for the gut.
As the terminal transcriptional activator of the hyphal gene regulatory network (Figure 1D), Ume6 is considered most specific to morphogenesis. To further explore the relationship between gut commensalism and the filamentation program, we generated ume6 null and UME6-overexpression (UME6OE) strains for testing in the GI colonization model. Two independent isolates of ume6 exhibited hypercompetitive phenotypes (Figure 2F and Figure S1E), whereas UME6OE exhibited reduced commensal fitness (Figure 2G and Figure S1F). Of note, competition experiments can expose fitness differences that may not be apparent when strains are tested separately. This is the case for ume6 and wild-type C. albicans, which accumulate to similar levels in individually colonized animals (Figure S3). Taken together, our findings support an inhibitory role for the hyphal gene regulatory network towards C. albicans fitness in the mammalian gut.
C. albicans colonizes the GI tract as a mixed population of yeast and hyphae
Given previous reports that C. albicans yeast predominate in the murine digestive tract (Vautier et al., 2015; White et al., 2007), we hypothesized that mutants with morphogenesis defects may possess a fitness advantage in this niche. In other words, if yeast are superior colonizers of the gut, then strains ‘locked’ into yeast morphology might outcompete strains that transition between yeast and hyphae. To test this hypothesis, we adapted a fluorescence in situ hybridization (FISH) protocol (Earle et al., 2015; Johansson and Hansson, 2012) to visualize fungal morphology in the gut. The stomachs, small intestines, ceca, and large intestines of animals colonized for ten days with C. albicans were fixed in methacarn, a solution that preserves the architecture of luminal contents. Sectioned tissues were hybridized to a Cy3-coupled DNA oligonucleotide against C. albicans 28S rRNA, which is distributed throughout the fungal cytoplasm. Examples of FISH-stained yeast and hyphae are presented in Figure 3A. Gut specimens were additionally treated with 4’,6-diamidino-2-phenylindole (DAPI) to stain host epithelial cells and FITC-coupled lectins (UEA-1 from Ulex europaeus, WGA-1 from Triticum vulgaris) to stain mucus.
Figure 3. C. albicans colonizes the gut as a mixed population of yeast and hyphae.

A)Examples of FISH-stained wild-type C. albicans (SN425 or SN250) yeast and hyphae in the mouse cecum (left) and in vitro (Spider medium, 37°C, right). A Cy3-coupled fungal -specific oligonucleotide (red) was hybridized to C. albicans 28S rRNA. Yellow arrowheads indicate hyphae. Scale bar denotes 15 μm. B) WT (SN250) and ume6 (SN1479, SN1478) in different GI compartments after 10 days of colonization. “Epithelium” indicates cross sectional region near the mucosa, “Lumen” indicates region near the center of the GI compartment. Mucus (green) was stained with a FITC-coupled lectin (UEA-1 +/− WGA-1), host epithelial cell nuclei (blue) were stained with DAPI. Scale bar indicates 20 μm. C) Quantification of C. albicans yeast and hyphae. 30 fields of view were scored per GI compartment per animal colonized with WT (n=6 animals) and ume6 (n=9 animals). Data represent the mean ±SEM. Significance was determined using the unpaired student’s t-test. See Figure S4 for ume6 morphology in vitro and Figure S5 for FISH staining of other transcription factor mutants in the gut.
Our findings for wild-type C. albicans are presented in Figure 3B and 3C. Consistent with previous reports (Vautier et al., 2015; White et al., 2007), we observed a preponderance of yeast in murine stomachs (~60% yeast) and small intestines (~80% yeast; Figure 3B-C). However, hyphal forms predominated in the ceca (~60% hyphae) and large intestines (~60% hyphae). In retrospect, differences in the choice of gut compartment may account for some of the discrepancies in previously reported commensal cell morphology (e.g. distal ileum in White et al., 2007 vs. large intestines in Bohm et al., 2017). Our results suggest that yeast and hyphae both inhabit the mammalian digestive tract, with hyphae more numerous in distal compartments that contain are enriched in hypha-inducing signals such as hypoxia (reviewed in Zheng et al., 2015), hypercarbia (Kalantar-Zadeh et al., 2018; Rune and Henriksen, 1969), and N-acetylglucosamine (Naseem and Konopka, 2015; Tailford et al., 2015).
Results the for ume6 mutant are also presented in Figure 3. In contrast to our expectation, the distribution of ume6 yeast and hyphae was nearly identical to that of wild type. Yeast predominated in the stomach (~60% yeast) and small intestines (~80% yeast), whereas hyphae were enriched in the cecum (~55% hyphae) and large intestines (~60% hyphae). The preserved ability of ume6 to undergo morphogenesis in the mammalian GI tract contrasts with its filamentation defect in the laboratory (Banerjee et al., 2008).
To verify that our ume6 mutant is comparable to previously published strains, we profiled it in four types of hypha-inducing media and under hypha-inducing anaerobic conditions. As shown in Figure S4 (upper panels), our isolate formed filamentous structures under several hypha-inducing conditions; however, these structures were short and misshapen compared to the true hyphae formed by wild type. Likewise, colonies formed by ume6 (Figure S4, lower panels) contained fewer surface wrinkles (indicating a lower proportion of hyphae) and exhibited less agar invasion than wild-type colonies. Thus, our isolate reproduced the published in vitro defects of ume6.
We next asked whether propagation in the host digestive tract also suppresses the filamentation defects of efg1, brg1, rob1, and tec1, using FISH to visualize each strain in individually colonized animals. In contrast to ume6, efg1 and rob1 colonized all evaluated compartments almost exclusively as yeast (Figure S5). brg1 formed a small number of hyphae, particularly in large intestines, whereas tec1 exhibited near wild-type proportions of yeast and hyphae. It is unclear why Ume6 and Tec1 are required for hypha formation in vitro but not in the commensal niche, but we speculate that the gut environment contains a signal or combination of signals that activate compensatory mechanisms in the fungus.
Overall, the FISH experiments revealed that 1) the mammalian GI tract is colonized by C. albicans yeast and hyphae; 2) filamentation occurs normally in this niche in the absence of Ume6; and, therefore, 3) the inhibitory activity of Ume6 on commensal fitness is likely mediated by a mechanism other than cell morphology.
NanoString reveals induction of hypha-specific genes throughout the GI tract
If commensalism is not controlled by fungal cell morphology per se, we reasoned that differences in gene expression must underlie the fitness gains of ume6, efg1, brg1, rob1, and tec1. To assess fungal transcript levels in commensally growing strains, we utilized a NanoString nCounter platform (Xu et al., 2015) that can quantify low abundance fungal transcripts amid excess host, bacterial, archaeal, and viral RNAs. We initially profiled wild-type C. albicans in different GI compartments over a 10-day time course (Figure 4A, Table S2). Total RNA was prepared from the contents of stomachs, small intestines, ceca, and large intestines after 1, 4, or 10 days of colonization (3 animals per time point). 182 previously described NanoString primer sets (Woolford et al., 2016) were used to probe the expression of genes associated with filamentation, pH-related processes, nutrient acquisition and metabolism, adhesion and cell wall structure, the cell cycle, stress response, and other processes.
Figure 4. NanoString reveals induction of hypha-associated and pH-responsive genes in commensally propagated C. albicans.

A) Schematic of NanoString experiment. Animals were colonized with wild type (ySN425) for 1, 4 and 10 days. RNA recovered from stomachs, ceca, and large intestines was analyzed with 182 NanoString primer sets. B) Heatmap of expressed hypha-associated genes. Upregulation relative to the inoculum is indicated in yellow, downregulation in blue. Final two columns indicate the −log10(adjusted p-value) of expression differences between the gut vs. laboratory conditions (Gut/YPD) or the stomach vs. distal compartments (Stomach/Distal). Significance was determined using a linear fit model. C) Heatmap of expressed pH-associated genes. The full NanoString dataset appears in Table S2.
High quality results were obtained from the stomach, cecum, and large intestines samples, but small intestines yielded insufficient fungal RNA for analysis. Overall, C. albicans gene expression remained stable over time and was similar across different GI compartments (Table S2). Genes associated with hyphae and pH-related processes were significantly regulated in the gut compared to standard in vitro conditions (Table S2, ≥5-fold difference compared to YPD; p=3.0×10⁻⁶ for hypha-associated genes, p=1.1×10⁻³ for pH-related genes). Heatmaps depicting all significantly (p<0.05) regulated genes in these two categories are presented in Figure 3B-C. In addition, a small number of genes was differentially expressed in the stomach compared to other gut compartments, including PHR2, which encodes a glycosidase that is active in low pH environments (Figure 3C; De Bernardis et al., 1998).
To determine whether Ume6 is required for gut-associated differences in fungal gene expression, we compared the NanoString profiles of wild type and ume6 after 10 days of colonization (n = 3 animals per strain). Apart from the absence of UME6 expression in the null mutant, however, we observed no significant differences between the two strains (Table S3).
mRNA-seq reveals Ume6-dependent regulation of certain hypha-specific genes in the gut
A disadvantage of NanoString is that the relatively high cost of custom primers limits the number of transcripts that can be monitored. To obtain a more global view of gene expression in commensally propagated strains, we turned to mRNA-Seq, which can theoretically quantify any cellular transcript that is expressed above a certain threshold. Animals were colonized with wild type or ume6 (n=5 animals/strain) for ten days, and RNA was recovered from large intestines, where UME6 is maximally expressed by wild type (Witchley and Noble, unpublished observations). For comparison, strains were also propagated in vitro under standard (YPD liquid, 30°C, n=3 cultures) and hypha-inducing conditions (YPD liquid plus 10% bovine serum, 37°C, n=3 cultures). From each sample, a minimum of 35 million mRNA-Seq reads mapped to the C. albicans genome (Figure 5B).
Figure 5. mRNA-Seq reveals Ume6 regulation of a subset of hypha-associated genes in the gut.

A) Schematic of mRNA-Seq experiment. PolyA RNA was recovered from WT C. albicans (ySN250) and ume6 (ySN1479) propagated under standard in vitro conditions (YPD, 30°C; n=3 cultures), filament-inducing conditions (YPD+10% serum, 37°C; n=3 cultures), or for 10 days in the GI commensalism model (n=5 animals). B) Analysis of sequencing depth and coverage. Bars represent % reads that align to C. albicans vs. mouse transcriptomes. Green numbers denote the read count (in millions) of indicated strains under each condition. C) Heat map of hypha-associated gene expression under laboratory conditions and in the host digestive tract. Values represent the log2 function of the tpm under the indicated condition divided by the tpm under standard in vitro conditions (YPD, 30°C). Final two columns represent the significance [−log10(adjusted p-value)] of expression differences between wild type propagated in the gut vs. in vitro (Gut/YPD) and ume6 vs. WT when both are propagated in the gut (ume6/WT). D) Volcano plot depicting the log2 transformed ratio of hypha-associated gene expression in commensally propagated ume6 vs. wild type (x-axis) versus significance (y-axis). Full mRNA-Seq datasets are presented in Table S4.
Using mRNA-Seq, we detected expression of 5169 C. albicans genes or roughly 85% of the predicted genome under at least one experimental condition (Table S4). Wild-type C. albicans exhibited ≥2-fold regulation of 2201 genes in large intestines compared to growth under standard in vitro conditions (p<0.05; Table S4); these include all examples of regulation detected with NanoString. GO-term analysis of the 1238 upregulated genes was unrevealing, whereas the 963 downregulated genes were associated with terms such as “oxoacid metabolic process” (p=2.68×10⁻¹⁹), “response to stimulus” (p=9.53×10⁻¹³), and “RNA export from nucleus (p=1.53×10−08). Prompted by the regulation of hypha-associated genes observed in our NanoString dataset, we focused on 334 genes that are consistently upregulated under in vitro hypha-inducing culture conditions ((≥5 independent conditions; Azadmanesh et al., 2017) and represented in our dataset (Table S4). 205 of these genes, including UME6, were upregulated by ≥2-fold in the murine model, a significant overrepresentation (p=9.69×10−52, hypergeometric test).
To identify genes that require Ume6 for normal expression in the gut, we compared the transcriptomes of commensally propagated wild-type and ume6 strains. Besides UME6 itself, 409 genes were differentially expressed by 2-fold or more in the ume6 mutant (p<0.05, Table S4). Seeking a smaller number of regulatory targets to test in animals, we focused on the 52 Ume6-dependent genes that are associated with hyphae (Figure 5C and Table S4; Azadmanesh et al., 2017). A volcano plot of all hypha-associated genes in our mRNA-Seq dataset is presented in Figure 5D, with relative expression in ume6 vs. wild type plotted on the x-axis and significance on the y-axis. From this analysis, SAP6 and HYR1 emerged as the two best-characterized genes exhibiting strong and significant dependence on Ume6: SAP6 expression is reduced by 15-fold (p=2.1×10⁻⁶) in the mutant, and HYR1 expression is reduced 10-fold (2.0×10⁻⁶). Sap6 is a hypha-specific secreted aspartyl protease that is required for virulence in a mouse corneal infection model (Jackson et al., 2007). Hyr1 is a GPI-anchored hyphal cell wall protein (Bailey et al., 1996).
To test the hypothesis that decreased expression of SAP6 and/or HYR1 contributes to the enhanced commensal fitness of ume6, we profiled sap6 and hyr1 null mutants in the GI colonization model. As shown in Figure 6A, sap6 strongly outcompeted wild type in the mouse GI colonization model (Figure 2F), and exhibited slightly higher colonization efficiency in individually colonized animals (Figure S3). The hyr1 mutant exhibited a weaker gain-of-fitness phenotype (Figure 6B). Restoration of a single copy of SAP6 to the sap6Δ/sap6Δ null mutant reduced the enhanced fitness of this strain (Figure 6C), whereas overexpression (SAP6OE) produced a strong loss-of-fitness phenotype (Figure 6D).
Figure 6. Hypha-associated secreted and cell surface proteins inhibit GI commensalism.

The commensal fitness of mutants affecting SAP6 and HYR1 was determined in 1:1 competition with wild-type C. albicans, as in Figure 2. A) WT (SN250) vs. sap6 (SN1664); B) WT (SN250) vs. hyr1 (SN511); C) WT (SN250) vs. sap6+SAP6 gene addback strain (SN1796, note that a single copy of SAP6 was restored to a sap6Δ/sap6Δ strain lacking both natural alleles); D) WT (SN235) v. SAP6OE (SN1798). Significance was determined using the paired student’s t-test; ns not significant, *p<0.05, **p<0.01, ***p<0.001. E) sap6 has normal morphology in the gut. sap6 (SN1664 and m886) was visualized using FISH (left panels), as in Figure 3. The plot on the right indicates the mean percentages (±SEM) of hyphae in stomachs, small intestines, ceca, and large intestines of six animals after ten days. SAP6 expression levels in transcription factor mutants is shown in Figure S6.
To verify that our sap6 strain does not impair yeast-to-hypha morphogenesis, we examined it under hypha-inducing conditions in vitro and in the murine commensalism model. As was previously reported (Chen et al., 2002), sap6 exhibited normal morphogenesis under multiple in vitro hypha-inducing conditions (Figure S4). Likewise, sap6 exhibited a wild-type pattern of yeast and hyphae within the murine digestive tract (compare Figure 6E and Figure 3B). These results suggest that the abundance of the Sap6 gene product, rather than cell morphology, determines C. albicans fitness in the gut. Finally, we asked whether decreased expression of SAP6 might contribute to the enhanced commensal fitness displayed by efg1, rob1, tec1 and brg1. RT-qPCR was used to quantify the level of SAP6 mRNA in cells recovered from individually colonized animals. Whereas SAP6 was expressed to variable levels by commensally propagated wild-type C. albicans, its expression was significantly downregulated in each of the hyperfit mutants (Figure S6). These results demonstrate that the hypha-associated gene, SAP6, is a potent inhibitor of C. albicans fitness in its commensal niche.
DISCUSSION
The rules governing microbial colonization of mammalian hosts are poorly understood, particularly in the case of fungal commensals. In this study, we identified five C. albicans transcription factors that decrease its fitness in a murine model of gut colonization. Iterative screens were required to identify these gain-of-fitness strains, since each infection was dominated by one or two mutants with the strongest phenotype(s), and no loss-of-fitness mutants were recovered. The identification of multiple C. albicans mutants that outperform wild type raises the question of why an organism would encode factors that inhibit its own fitness.
Prior to this study, the roles played by C. albicans yeas and hyphae in the host digestive tract have been controversial. In particular, two observations have been difficult to reconcile: 1) C. albicans colonizes the GI tract primarily in the yeast form (Vautier et al., 2015; White et al., 2007); and 2) certain hypha-associated genes, including ones encoding virulence factors, are expressed in this niche (Rosenbach et al., 2010). To clarify these observations, we developed a FISH protocol for direct visualization of C. albicans in the gut. Our detailed, quantitative analysis of fungal morphology provides clear evidence for the presence of both yeast and hyphae throughout the GI tract. The changes in relative abundance of the two fungal cell types in different gut compartments can be rationalized in light of known triggers of yeast-to-hypha morphogenesis. For example, under in vitro conditions, acidic pH promotes yeast morphology by inhibiting a Rim101-dependent pro-filamentation signaling pathway (Davis et al., 2000; Gomez-Raja, 2012; Li et al., 2004; Wolf et al., 2010), whereas hypoxia, hypercarbia, and N-acetylglucosamine promote hypha formation via the Ofd1-, cAMP-, and Ras1/Cst1 MAPK-dependent signaling pathways, respectively (Bockmuhl et al., 2001; Castilla et al., 1998; Klengel et al., 2005; Leberer et al., 2001; Lu et al., 2013; Rocha et al., 2001; Xu et al., 2008). If these pathways function similarly within the host, then the acidic environment of the stomach may elicit yeast morphology, whereas higher concentrations of CO2 and N-acetylglucosamine (part of the bacterial cell wall and host mucin) and a lower concentration of O2 in the cecum and large intestines may favor hypha formation in the distal gut.
Given the well-documented filamentation defects of ume6 null mutants under in vitro conditions (Figure S4; Banerjee et al., 2008; Childers et al., 2014), its ability undergo normal morphogenesis in the GI tract was surprising. This striking contrast in phenotypes implies that at least one host-associated signal for hypha induction is absent from existing in vitro assays. Further, at least one fungal activator of filamentation must be able to compensate for the absence of Ume6 in the gut. The presence of hyphae in all examined GI compartments and the existence of redundant mechanisms to support hypha formation in this niche suggest an important role for hyphae during commensal colonization. Whether this role is to facilitate fungal interactions with host cells, nutrient acquisition, stress resistance, and/or interactions with co-colonizing microorganisms and viruses remains to be determined.
Our finding that the hyperfit ume6 mutant maintains wild-type cell morphology (that is, a normal ratio of yeast and hyphae) in the mouse GI tract argues that cell shape per se does not determine commensal fitness. Transcriptomic analysis of commensally propagated wild-type and ume6 strains revealed that Ume6 is required for normal expression of 52 hypha-associated genes. Remarkably, disruption of one of these genes, encoding the secreted aspartyl protease Sap6, is sufficient to confer an enhanced fitness phenotype that phenocopies that of the ume6 mutant, whereas SAP6 overexpression produces a reduced fitness phenotype resembling that of UME6OE. The strong, reciprocal commensalism phenotypes displayed by sap6 and SAP6OE belie the common assumption that defects associated with secreted factors will be complemented by other strains in mixed infections. In this case, we surmise that dispersal of C. albicans within the commensal niche permits differential selection against cells in areas of higher local concentration of Sap6 protein. In addition to SAP6, we identified a second UME6 regulatory target, HYR1, with a (more subtle) effect on commensal fitness. This suggests that altered expression of multiple genes may contribute to the net phenotype of ume6.
While this manuscript was in revision, another group reported that serial passage of wild-type C. albicans through a murine commensal model resulted in enhanced commensal fitness (Tso et al., 2018). Interestingly, sequencing of 28 gut-adapted strains recovered from independent in vivo evolution experiments revealed three strains with spontaneous mutations affecting EFG1, three with mutations affecting ROB1, and 22 with mutations affecting FLO8, among additional changes in the genome. Like Efg1, Brg1, Rob1, Tec1, and Ume6, FLO8 encodes a transcription factor in the hyphal gene regulatory network (Cao et al., 2006). flo8 was absent from the libraries used for our commensalism screens (Homann et al., 2009; Noble et al., 2010). However, based on our results with other transcription factor mutants in the same pathway, we speculate that the enhanced fitness of the flo8 strains identified by Tso et al. may result at least partially from decreased expression of SAP6.
Sap6 belongs to a family of ten secreted and cell surface-associated aspartyl proteases with documented roles in C. albicans virulence (Naglik et al., 2004; Parra-Ortega et al., 2009). Individual members of the superfamily differ in pH optima, substrate specificity, and expression pattern, with certain Sap proteins expressed constitutively, and others expressed under specific environmental conditions or in a particular cell type. For example, Sap4, Sap5, and Sap6 are expressed exclusively by hyphae. Individual Sap proteins are thought to facilitate nutrient acquisition, tissue invasion, and/or immune evasion within particular host niches. Interestingly, Sap6 is one of two family members that elicit pro-inflammatory cytokine responses from host innate immune cells (Pietrella et al., 2010). Specifically, exposure of cultured murine dendritic cells or macrophages to recombinant Sap6 protein (or a catalytically inactive variant) activates the NLRP3 inflammasome, resulting in the secretion of IL-1β and other cytokines (Pietrella et al., 2013).
Based on observations reported here and in the literature, we propose a model in which colonizing C. albicans and the mammalian host engage in intense, bidirectional communication. C. albicans senses signals (pH, O2, CO2, nutrient abundance, and N-acetylglucosamine, among others) whose strength and composition vary dramatically in different GI compartments. In response to changes in these signals, the fungus remodels its cell morphology and gene expression, converting from a yeast-dominated population in the proximal gut to a hypha-dominated population more distally. On the host side, yeast may be tolerated or even cultivated as an innocuous-to-beneficial cell type (in this niche). Invasive hyphae, however, pose a risk, and we propose that hyphae are monitored indirectly through sensing of cell type-specific gene products such as Sap6 and Hyr1. When hypha-associated markers exceed a threshold level, a localized antifungal immune response may be triggered to limit the threat. Mutants such as ume6, sap6, and hyr1, which produce lower levels of the hypha-specific triggers, are able to proliferate undetected by the host and therefore outcompete wild-type C. albicans in mixed infections, although presumably these strains would be less fit in certain situations. If correct, our model implies that host curation of the fungal microbiota helps to limit the risk of opportunistic infection.
STAR Methods
Contact for Reagent and Resource Sharing
Further information and requests for reagents may be directed to, and will be fulfilled by, the corresponding author Suzanne M. Noble (Suzanne.noble@ucsf.edu).
Experimental Model and Subject Details
Mice
All procedures involving animals were approved by the UCSF Institutional Animal Care and Use Committee. We used a previously described mouse model of C. albicans commensalism (Chen et al., 2011; Pande et al., 2013), with minor modifications. 8–10 week (18-21 gram) wild-type, female BALB/c mice from Charles River Laboratories were provided with autoclaved water containing 5% glucose and antibiotics (penicillin 1500 un/ml and streptomycin 2 mg/ml) for 7-8 days prior to gavage with 108 CFUs of C. albicans, and antibiotic water was continued throughout the experiments. All animals were singly or doubly housed depending on experiment and provided autoclaved distilled water and autoclaved mouse chow (PicoLab).
Strains
Genetic screens for C. albicans commensalism factors were performed with the Noble (Noble et al., 2010) and Homann (Homann et al., 2009) collections of isogenic, barcoded, homozygous deletion mutants. Both libraries are available from the Fungal Genetics Stock Center (http://www.fgsc.net/). (Homann et al., 2009; Noble et al., 2010). All other strains are described in the Key Resources Table. ume6 (SN1478 and SN1479) were generated using a previously described fusion PCR technique (Homann et al., 2009; Noble et al., 2010; Noble and Johnson, 2005). Plasmids used to construct strains UME6OE (SN1557 and SN1558), SAP6OE (SN1798), and sap6/SAP6 (SN1796) are described is Table S4. Other plasmids used in this study are described in the Key Resources Table and primers are listed in Table S5. C. albicans strains were routinely propagated on liquid or solid YPD medium at 30°C. Filament-inducing conditions consisted of YP supplemented with 10% bovine serum (Gibco), Spider medium, Lee’s glucose pH 6.8, and Lee’s GlcNAc (N-acetylglucosamine) pH 6.8, as well as propagation under anaerobic conditions generated using a BD Anaerobe Gas Generator Pouch with Indicator.
KEY RESOURCES TABLE
| REAGENT or RESOURCE | SOURCE | IDENTIFIER |
|---|---|---|
| Antibodies | ||
| Bacterial and Virus Strains | ||
| Biological Samples | ||
| Chemicals, Peptides, and Recombinant Proteins | ||
| FITC Conjugated UEA-1 | Sigma-Aldrich | L9006-1MG |
| FITC Conjugated WGA-1 | Sigma-Aldrich | L4895-2MG |
| DAPI | EMD Millipore | 5087410001 |
| Methanol | Sigma-Aldrich | 179337-4L |
| Chloroform | Sigma-Aldrich | C2432-500ML |
| Glacial acetic acid | Macron Fine Chemicals | MK881746 |
| Ethanol | Sigma-Aldrich | E7023-500ML |
| Xylenes | Sigma-Aldrich | 214736-4L |
| Paraffin wax | Sigma-Aldrich | P3558 |
| Formamide | Sigma-Aldrich | 47671 |
| Vectashield | Vector Laboratories | H-1000 |
| Buffer RLT | Qiagen | 79216 |
| Acid phenol chloroform | Ambion | AM9722 |
| Phenol chloroform isoamyl alcohol | Ambion | AM9732 |
| Critical Commercial Assays | ||
| Dynabeads kilobase BINDER Kit | Invitrogen | 60101 |
| AccuPrime Taq | Invitrogen | 12339016 |
| CircLigase II ssDNA ligase | Epicentre | CL9021K |
| High sensitivity DNA kit for Bioanalyzer | Agilent | 5067-4626 |
| MEGAclear transcription clean-up kit | Ambion | AM1908 |
| NEB DNase I | New England Biolabs | M0303 |
| NEBNext Poly(A) mRNA Magnetic Isolation Module | New England Biolabs | E7490 |
| NEBNext Multiplex Oligos for Illumina | New England Biolabs | E7335, E7500 |
| NEBNext Ultra Directional RNA Library Prep Kit for Illumina | New England Biolabs | E7420 |
| Library quantification kit | KAPA Biosystems | KK4824 |
| SuperScript III First-Strand Synthesis kit | Invitrogen | 18080051 |
| Deposited Data | ||
| Screen data | This study | GEO Accession GSE124139 |
| RNA-seq data | This study | GEO Accession GSE124137 |
| Experimental Models: Cell Lines | ||
| Experimental Models: Organisms/Strains | ||
| Mouse: BALB/c | Charles River Laboratories | Stock No: 028 |
|
C. albicans: ySN87 |
Noble et al., 2005 | wild type (leu2Δ/leu2Δ, ura3Δ/URA3, his1Δ/his1Δ, iro1Δ/IRO1, MTLa/ MTLα) |
|
C. albicans: ySN152 |
Noble et al., 2005 | wild type (leu2Δ/leu2Δ, ura3Δ/URA3, his1Δ/his1Δ, arg4Δ/arg4Δ, iro1Δ/IRO1, MTLa/MTLα) |
|
C. albicans: ySN226 |
Noble et al., 2005 | wild type (leu2Δ∷C.d.HIS1/leu 2Δ∷C.m.LEU2 , ura3Δ/URA3, his1Δ/his1Δ, iro1Δ/IRO1, MTLa/ MTLα) |
|
C. albicans: ySN228 |
This study | wild type (leu2Δ∷C.m.LEU2/le u2Δ, ura3Δ/URA3, his1Δ/his1Δ, arg4Δ/arg4Δ, iro1Δ/IRO1, MTLa/ MTLα) |
|
C. albicans: ySN235 |
Pande et al., 2013 | wild type (leu2Δ∷C.d.HIS1/leu 2Δ, ura3Δ/URA3, his1Δ/his1Δ, arg4Δ/arg4Δ, iro1Δ/IRO1, MTLa/ MTLα) |
|
C. albicans: ySN250 |
Noble et al., 2010 | wild type (leu2Δ∷C.d.HIS1/leu 2Δ∷C.m.LEU2, ura3Δ/URA3, his1Δ/his1Δ, arg4Δ/arg4Δ, iro1Δ/IRO1, MTLa/MTLα) |
|
C. albicans: ySN425 |
Noble et al., 2010 | wild type (leu2Δ∷C.d.HIS1/leu2Δ∷C.m.LEU2, ura3Δ/URA3, his1Δ/his1Δ, arg4Δ∷C.d.ARG4/arg4Δ, iro1Δ/IRO1, MTLa/ MTLα) |
|
C. albicans: ySN1555 |
This study | wild type (leu2Δ∷C.d.HIS1-bar1/leu2Δ∷CatetR , ura3Δ/URA3, his1Δ/his1Δ, arg4Δ/arg4Δ, iro1Δ/IRO1, MTLa/ MTLα) |
|
C. albicans: ySN1556 |
This study | wild type (leu2Δ∷C.d.HIS1-bar2/leu2Δ∷CatetR , ura3Δ/URA3, his1Δ/his1Δ, arg4Δ/arg4Δ, iro1Δ/IRO1, MTLa/ MTLα) |
|
C. albicans: ySN119 |
Noble et al., 2005 | efg1 (efg1Δ∷C.d.HIS1-ST1/efg1Δ∷C.m.LEU2-ST49, leu2Δ/leu2Δ , ura3Δ/URA3, his1Δ/his1Δ, iro1Δ/IRO1, MTLa/ MTLα) |
|
C. albicans: ySN1011 |
Homann et al., 2009 | efg1 (efg1Δ∷C.d.HIS1/efg1Δ∷C.m.LEU2, leu2Δ/leu2Δ , ura3Δ/URA3, his1Δ/his1Δ, arg4Δ/arg4Δ, iro1Δ/IRO1, MTLa/ MTLα) |
|
C. albicans: ySN1106 |
Homann et al., 2009 | brg1 (brg1Δ∷ST32-C.d.HIS1/brg1Δ∷ST3 2-C.m.LEU2, leu2Δ/leu2Δ , ura3Δ/URA3, his1Δ/his1Δ, arg4Δ/arg4Δ, iro1Δ/IRO1, MTLa/ MTLα) |
|
C. albicans: ySN1107 |
Homann et al., 2009 | brg1 (brg1Δ∷ST32-C.d.HIS1/brg1Δ∷ST32-C.m.LEU2, leu2Δ/leu2Δ , ura3Δ/URA3, his1Δ/his1Δ, arg4Δ/arg4Δ, iro1Δ/IRO1, MTLa/ MTLα) |
|
C. albicans: ySN1180 |
This study | brg1; ARG4 addback (brg1Δ∷ST32-C.d.HIS1/brg1Δ∷ST32-C.m.LEU2, leu2Δ/leu2Δ , ura3Δ/URA3, his1Δ/his1Δ, arg4Δ∷C.d.ARG4/arg4Δ, iro1Δ/IRO1, MTLa/ MTLα) |
|
C. albicans: ySN1439 |
Homann et al., 2009 | rob1 (rob1Δ∷ST13-C.d.HIS1/rob1Δ∷ST1 3-C.m.LEU2, leu2Δ/leu2Δ , ura3Δ/URA3, his1Δ/his1Δ, arg4Δ/arg4Δ, iro1Δ/IRO1, MTLa/ MTLα) |
|
C. albicans: ySN1440 |
Homann et al., 2009 | rob1 (rob1Δ∷ST13-C.d.HIS1/rob1Δ∷ST13-C.m.LEU2, leu2Δ/leu2Δ , ura3Δ/URA3, his1Δ/his1Δ, arg4Δ/arg4Δ, iro1Δ/IRO1, MTLa/MTLα) |
|
C. albicans: ySN1441 |
Homann et al., 2009 | tec1 (tec1Δ∷ST23-C.d.HIS1/tec1Δ∷ST2 3-C.m.LEU2, leu2Δ/leu2Δ , ura3Δ/URA3, his1Δ/his1Δ, arg4Δ/arg4Δ, iro1Δ/IRO1, MTLa/ MTLα) |
|
C. albicans: ySN1442 |
Homann et al., 2009 | tec1 (tec1Δ∷ST23-C.d.HIS1/tec1Δ∷ST2 3-C.m.LEU2, leu2Δ/leu2Δ , ura3Δ/URA3, his1Δ/his1Δ, arg4Δ/arg4Δ, iro1Δ/IRO1, MTLa/MTLα) |
|
C. albicans: ySN1478 |
This study | ume6 (ume6Δ∷ST21-C.d.HIS1/ume6Δ∷ST 69-C.m.LEU2, leu2Δ/leu2Δ , ura3Δ/URA3, his1Δ/his1Δ, arg4Δ/arg4Δ, iro1Δ/IRO1, MTLa/MTLα) |
|
C. albicans: ySN1479 |
This study | ume6 (ume6Δ∷ST21-C.d.HIS1/ume6Δ∷ST 69-C.m.LEU2, leu2Δ/leu2Δ , ura3Δ/URA3, his1Δ/his1Δ, arg4Δ/arg4Δ, iro1Δ/IRO1, MTLa/MTLα) |
|
C. albicans: ySN1557 |
This study | tetO-Ume6 (FRT-MAL2p-FLP-SAT1-FRT-tetO-UME6/UME6 leu2Δ∷C.d.HIS1-bar4/leu2Δ∷CatetR , ura3Δ/URA3, his1Δ/his1Δ, arg4Δ/arg4Δ, iro1Δ/IRO1, MTLa/MTLα) |
|
C. albicans: ySN1558 |
This study | tetO-Ume6 (FRT-tetO-UME6/UME6 leu2Δ∷C.d.HIS1-bar8/leu2Δ∷CatetR , ura3Δ/URA3, his1Δ/his1Δ, arg4Δ/arg4Δ, iro1Δ/IRO1, MTLa/MTLα) |
|
C. albicans: m886 |
Noble et al., 2010 | sap6 (sap6Δ∷ST22-C.d.HIS1/sap6Δ∷ST22-C.m.LEU2, leu2Δ/leu2Δ , ura3Δ/URA3, his1Δ/his1Δ, arg4Δ/arg4Δ, iro1Δ/IRO1, MTLa/MTLα) |
|
C. albicans: ySN1663 |
This study | sap6 het (sap6Δ∷ST22-C.m.LEU2/SAP6, leu2Δ/leu2Δ , ura3Δ/URA3, his1Δ/his1Δ, arg4Δ/arg4Δ, iro1Δ/IRO1, MTLa/MTLα) |
|
C. albicans: ySN1664 |
This study | sap6 (sap6Δ∷ST22-C.d.HIS1/sap6Δ∷ST22-C.m.LEU2, leu2Δ/leu2Δ , ura3Δ/URA3, his1Δ/his1Δ, arg4Δ/arg4Δ,iro1Δ/IRO1, MTLa/MTLα) |
|
C. albicans: ySN510 |
Noble et al., 2010 | hyr1 (hyr1Δ∷ST7-C.d.HIS1/hyr1Δ∷ST55-C.m.LEU2, leu2Δ/leu2Δ , ura3Δ/URA3, his1Δ/his1Δ, arg4Δ/arg4Δ, iro1Δ/IRO1, MTLa/MTLα) |
|
C. albicans: ySN511 |
Noble et al., 2010 | hyr1 (hyr1Δ∷ST7-C.d.HIS1/hyr1Δ∷ST5 5-C.m.LEU2, leu2Δ/leu2Δ , ura3Δ/URA3, his1Δ/his1Δ, arg4Δ/arg4Δ, iro1Δ/IRO1, MTLa/MTLα) |
|
C. albicans: ySN1796 |
This study | sap6; SAP6 addback (sap6Δ∷SAP6-FRT/sap6Δ∷ST22-C.m.LEU2, leu2Δ/leu2Δ , ura3Δ/URA3, his1Δ/his1Δ, arg4Δ/arg4Δ, iro1Δ/IRO1, MTLa/MTLα) |
|
C. albicans: ySN1798 |
This study | SAP6 overexpression (sap6Δ∷ST22-C.d.HIS1/sap6Δ∷FRT-FLP-SAT1-FRT-TDH3prom-SAP6, leu2Δ/leu2Δ , ura3Δ/URA3, his1Δ/his1Δ, arg4Δ/arg4Δ, iro1Δ/IRO1, MTLa/MTLα) |
| Oligonucleotides | ||
| Pan Fungal Probe | Integrated DNA Technologies | 5’-Cy3-CTCTGGCTTCACCCTATTC-3’ |
| Additional oligonucleotides are described in Table S5 | ||
| Recombinant DNA | ||
| pSFS2A |
Reuss et al., 2004 | Source of FLP-SAT used in construction of pSN356, pSN363, pSN366 |
| pLC53 |
Shen et al., 2008 | Source of tetR (optimized for C. albicans) used in construction of pSN356 |
| pSN355/pJK100-tetO-Ume6 | Banerjee et al., 2012 | Introduction of tetO promoter upstream of UME6 ORF in strain SN1558 |
| pSN363 |
This study | Introduction of tetO promoter upstream of the UME6 ORF in strain SN1557 (different Flipper cassette from pJK100-tetO-Ume6 for ease of excision) |
| pSN356 |
This study | Introduce C. albicans-specific tet repressible transactivator into C.a. LEU2 locus; CaTAR amplified from pLC53 |
| pSN385 |
This study | Restoration of SAP6 ORF to SAP6 locus, used in construction of strain ySN1796 |
| pSN402 |
This study | Replacement of SAP6 promoter with TDH3 promoter for overexpression of SAP6, used n construction of strain ySN1798 |
| Software and Algorithms | ||
| Fiji/ImageJ | Schindelin et al., 2012 | https://imagej.net/Fiji/Downloads |
| kallisto | Bray et al., 2016 | https://pachterlab.github.io/kallisto/download |
| limma | Ritchie et al., 2015 | https://bioconductor.org/biocLite.R |
| bowtie | Langmead et al., 2012 | https://sourceforge.net/projects/bowtie-bio/files/bowtie/ |
| Custom script for identifying screen targets | Available upon request | |
| Other | ||
| SeraMag Speed Beads | GE Healthcare | 65152105050250 |
Method Details
Mouse Model of GI commensalism
Screens were performed with >650 C. albicans homozygous knockout mutants (Homann et al., 2009; Noble et al., 2010) and an isogenic wild-type control (SN250). Each strain was individually propagated to mid log growth in 1 ml liquid YPD in 96-well culture dishes at 30°C, prior to pooling into a mixed inoculum. Following washes and resuspension of cells in sterile 0.9% saline, cell density was determined using a hemocytometer, and 108 CFUs of each inoculum was gavaged into 2-4 animals. To minimize microbial transfer among cage mates, only one to two animals were housed per cage. Inoculum and stool samples obtained after 3-5 and 10 days of colonization were plated onto Sabouraud agar (BD) with ampicillin 50 μg/mL and gentamicin 15 μg/mL and incubated for 2 days at 30°C. CFUs were washed from plates with sterile water and collected by centrifugation. Cell pellets were stored at −80°C prior to isolation of genomic DNA.
Colonization with single strains (for NanoString and RNA-Seq analysis) or 1:1 mixtures of wild type and mutants (efg1, brg1, rob1, tec1, and hyr1 from mutant libraries, and newly constructed ume6 (SN1478, SN1479), UME6OE (SN1557 and SN1558), sap6 (SN1664), and SAP6OE (SN1798)) were performed as for the screens. Animals used for mRNA-Seq were individually housed.
For experiments involving direct evaluation of fungal populations in the host digestive tract, each GI segment was dissected immediately following euthanasia of the animal. Fungal CFUs were recovered by plating luminal contents, tissue homogenates, or both onto Sabouraud agar (BD) containing ampicillin 50 μg/mL and gentamicin 10 μg/mL.
For strain competitions in the GI commensal model, the paired student’s t-test was used to assess the difference in abundance between strains at each time point for significance.
Determination of Competitive Index
To determine the fitness of individual mutants in the commensalism screens, reads from each sequencing library were mapped to the Candida albicans genome (candidagenome.org, Assembly 21) using bowtie (Langmead et al., 2009). Reads were assigned to a given mutant based on proximity (within 200 bp) of the genomic sequence to the start or end of ORFs targeted in the deletion collections (Homann et al., 2009; Noble and Johnson, 2005). Strain abundance was calculated as the ratio of the sequencing reads for a given mutant to the total number of reads for all strains present in the same pool. Mutants with fewer than 100 reads in the inoculum library were eliminated from further analysis. Competitive index was defined as the log2 transformed ratio of the abundance of each mutant strain in feces (recovered, R) to its abundance in the inoculum (I).
To assess the commensal fitness of mutants in 1:1 competition with wild type, genomic DNA was extracted from C. albicans recovered from feces at the time points indicated in the figures. Strain abundance was determined by qPCR (SYBR Green; Bio-Rad), using strain-specific primers (Table S5) and a Roche LightCycler 480 instrument. The paired student’s t-test was used to assess the significance of observed differences.
Preparation of screen sequencing libraries
Genomic DNA from plated inocula and fecal pellets was isolated as previously described (Chen et al., 2011; Pande et al., 2013). Feces from one animal per cage was prepared for sequencing. A linear amplification-based method modified from (Carette et al., 2011) was used for selective amplification of genomic sequences flanking the Candida dubliniensis HIS1 selectable marker (Noble et al., 2010), which replaces the disrupted ORF in each mutant. Briefly, 5-20 μg aliquots of genomic DNA were used in individual AluI, BfaI, DpnII, RsaI, and TaqαI (New England Biolabs) digests overnight. Following heat inactivation of the restriction enzymes, digests of a given sample were pooled and precipitated to concentrate the DNA, and gel-free size selection was performed using a SeraMag bead mix (prepared as in (Rohland and Reich, 2012) to capture DNA of ~200-1000 bp. 1 μg of DNA was used for linear amplification by AccuPrime Taq (Invitrogen) with biotinylated primer SNO1774 for 100 cycles. Single-stranded biotinylated DNA was captured using streptavidin-coated beads provided in the Dynabeads kilobaseBINDER kit (Invitrogen) overnight and a second adapter ligation was performed with CircLigase II (Epicentre) using primer SNO1775 the next day. PCR using AccuPrime Taq and Illumina primers 1 (SNO1777) and 2 (barcoded; SNO1776, SNO1819-1829 or SNO1949-1960) was performed for 15 cycles. PCR products were separated from primers using SeraMag bead mix. 2100 Bioanalyzer (Agilent) traces were used to quantify library abundance and size distribution. Multiplexed libraries for sequencing were pooled based on Bioanalyzer traces. Sequencing (50 bp-single end) was performed using a custom sequencing primer SNO1830 at the University of California Berkeley QB3 Vincent J. Coates Genomics Sequencing Laboratory (GSL) on an Illumina HiSeq2000 or HiSeq4000, which are supported by NIH S10 Instrumentation Grants S10RR029668, S10RR027303 and OD018174.
Imaging of Candida albicans in the gut
BALB/c mice were singly or doubly housed and colonized with wild type (SN250, n=6), ume6 (SN1478, SN1479, n=9), sap6 (m886, n=3; SN1664, n=3), efg1 (SN1011, n=2), brg1 (SN1106, n=3), rob1 (SN1439, n=3), or tec1 (SN1441, n=3) as described above. After 10 days, animals were euthanized, and segments of the digestive tract (stomach, jejunum, ileum, cecum, and large intestines) were fixed in a methacarn solution (60% methanol, 30% chloroform, 10% glacial acetic acid) at room temperature for at least three hours.
Fixed tissues were processed in 100% methanol (twice for 35 minutes each), 100% ethanol (twice for 25 minutes each), and xylenes (histological grade, Sigma-Aldrich; twice for 20 minutes each), followed by transfer to melted paraffin wax (Sigma) for two hours at 70°C. Preparation of paraffin blocks was performed by the UCSF Cancer Center Immunohistochemistry and Molecular Pathology Core, and 4 μm or 8 μm sections were prepared by Nationwide Histology (Veradale, WA).
Fluorescence in situ hybridization (FISH) was performed as previously described (Johansson and Hansson, 2012) and summarized here. Slides were de-paraffinized in xylenes (twice at 60°C), followed by a 5 minute incubation in 100% ethanol at room temperature. Hybridization was performed in a hybridization buffer (20 mM Tris-HCl pH 7.4, 0.9 M NaCl, 0.1% SDS and 1% formamide) with a fungal 28S rRNA DNA oligonucleotide that is coupled to Cy3 (5’-Cy3-CTCTGGCTTCACCCTATTC-3’; Integrated DNA Technologies) for three hours at 50°C. Slides were washed for 15 minutes at 50°C in wash b uffer (20 mM Tris-HCl pH 7.4, 0.9 M NaCl) followed by two washes in PBS, pH 7.4 at room temperature. Samples were counterstained with DAPI (for epithelial cell nuclei) and FITC-conjugated UEA-1 (for mucin; Sigma), for 45 minutes at 4°C. Because staining of mucin in the small inte stine and cecal specimens was less efficient, FITC-conjugated WGA-1 (Sigma) was added for counterstaining of these sections. Slides were washed twice in PBS, pH 7.4 at room temperature and then mounted with Vectashield (Vector Laboratories). Sections were imaged on the Keyence microscope model BZ-X700 or High Speed Spinning Disk Confocal microscope (Yokogawa W1). Final images are composites of the DAPI, FITC and TRITC/Cy3 channels. Yeast and hyphae were quantified manually using the cell counter plug-in for Fiji (ImageJ) (Schindelin et al., 2012). Statistical significance was determined by the unpaired student’s t-test.
Sample collection and analysis for NanoString
BALB/c mice were colonized with a single C. albicans strain (wild-type strains SN250 or SN425, ume6 mutant SN1479), as described above. Three animals were colonized with each strain per experimental time point and housed individually. Samples of the inocula were flash frozen in liquid nitrogen and stored at −80°C. At d esignated time points, animals were euthanized, and the digestive tract was dissected aseptically. Whole GI segments (tissue + contents) were analyzed together. GI specimens were flash frozen in liquid nitrogen and stored at −80°C.
RNA extraction was performed as previously described (Xu et al., 2016) and summarized here. Tissue samples were homogenized in buffer RLT (Qiagen) with 1% β-mercaptoethanol (β-ME) with a gentleMACS dissociator (Miltenyi Biotec). Phenol:chloroform:isoamyl alcohol (25:24:1) was added to the homogenate along with zirconia beads (0.5mm) (Research Products International) and vortexed on a mini-beadbeater (Biospec Products). The aqueous phase was collected and washed on an RNeasy spin column (Qiagen), followed by elution in water.
The NanoString nCounter Analysis System was used with a previously described set of fluorescent probes for hybridization and detection (Woolford et al 2016 PLOS Genetics). Briefly, hybridization buffer combined with the codeset of interest is combined with 5 μl of total RNA and incubated at 65°C overnight. Samples were then load ed onto the prep station and incubated under the high sensitivity program for 3 hours. Following the prep station, samples were read using the NanoString digital analyzer with the high resolution option. Measured counts for individual transcripts were normalized to the average of all transcripts in the sample. Heatmaps were generated using the results for C. albicans in the digestive tract compared to inoculum grown to OD600=1.0 in liquid YPD maintained at 30°C. Raw counts b elow 20 were excluded from further analysis.
The linear fit model generated by limma using NanoString probe counts was used to determine the significance of expression differences between different conditions in the NanoString dataset. The Fisher’s exact test was used to determine the significance of functional category enrichment among genes regulated by five-fold or more. Genes were assigned pH-related, nutrient acquisition and metabolism, adhesion and cell wall structure, cell cycle, stress response, and/or “other” categories based on gene descriptions in the Candida Genome Database (Skrzypek et al., 2017). Hypha-associated genes were defined as genes that are upregulated under at least five different in vitro hypha-inducing conditions in the recent study by Azadmanesh et al. (Azadmanesh et al., 2017).
Sample collection and analysis for mRNA-seq
Colonization of animals and recovery of experimental samples were performed as described above for the NanoString experiments, with the exception that only samples of luminal contents were evaluated.
RNA extraction for mRNA-seq was performed as previously described in (Turnbaugh et al., 2009), with modifications. Dow Corning vacuum grease was used for phase separation, instead of phase-lock tubes. Three to five additional acid phenol:chloroform (Ambion) followed by three to five buffer saturated phenol:choroform:isoamyl alcohol (Ambion) extractions were added to eliminate endogenous RNases. Following precipitation and resuspension of pellets in RNase-free water, RNA was further purified using the MEGAclear transcription clean-up kit (Ambion). DNase I (NEB) treatment was performed on 10 μg RNA for 10 minutes at 37°C, then 0.5 M EDTA was used to inactivate DNase I at 75°C for 10 min. Following DNase treatment, a final acid phenol-chloroform extraction was performed. RNA was then precipitated and resuspended in RNase-free water. In vitro and in vivo samples were treated identically.
NEBNext Ultra Directional RNA Library Prep Kit for Illumina in combination with NEBNext Poly(A) mRNA Magnetic Isolation Module and NEBNext Multiplex Oligos for Illumina was used to generate mRNA-seq libraries. The protocol provided by NEB was followed precisely using 1 μg total RNA and 13 cycles in the final PCR, with the exception that Ampure XP bead mix was replaced with Sera-Mag Speed Beads (GE Healthcare) in DNA binding bead mix (Rohland and Reich, 2012). Library fragment size was determined using High Sensitivity DNA chips on a 2100 Bioanalyzer (Agilent). Library quantification was performed by qPCR with a library quantification kit from KAPA Biosystems (KK4824) on a Roche LightCycler 480. Sequencing was performed on the UCSF Center for Advanced Technology HiSeq4000.
To determine significant changes in RNA expression, reads were mapped to the current haploid C. albicans transcriptome (Assembly 21, candidagenome.org) and transcript abundances were then evaluated using kallisto (Bray et al., 2016). Statistical comparisons of transcript abundances between different conditions were performed on estimated counts using the linear fit model generated by limma with strain, environmental condition and sequencing run as factors in the design matrix as previously described (Ritchie et al., 2015). Data in heat maps where individual biological replicates are shown were made using transcript per Million mapped reads (tpm) values generated by kallisto.
GO-term analysis of processes enriched among upregulated and downregulated gene sets was performed using the CGD Gene Ontology Term Finder (Skrzypek et al., 2017).
qRT-PCR of in vivo SAP6 expression
Mice were housed two per cage, treated with antibiotics and inoculated with either wild type (ySN250), efg1 (ySN1011), brg1 (ySN1106), rob1 (ySN1439), and tec1 (ySN1441). After 10 days. For wild type, the GI tracts were used for CFU/organ studies and so fresh feces were substituted for RNA extraction. For the mutants, half of the large intestine contents was snap frozen and stored at −80°C.
RNA was prepared as described for mRNA-seq with the exception that after initial RNA extraction, for RNA purification, homemade RNA binding bead mix (1 mM trisodium citrate, 2.5 M NaCl, 20% PEG 8000, 0.05% Tween 20, pH 6.4) was used following the protocol provided for RNAClean XP mix (Beckman Coulter). RNA was eluted in RNase-free water and DNase I treated. Again, RNA was purified using RNA binding bead mix. One μg of RNA was reverse-transcribed using SuperScript III with random hexamers. 1 μL of cDNA was used per 10 μL qRT-PCR reaction with either primers to the housekeeping gene PMA1 (SNO3478 and SNO3479) or to the gene of interest SAP6 (SNO3202 and SNO3203) in triplicate.
For qPCR analysis, Roche Lightcycler 480 was used with the following program: initial melting occurred at 94°C for 30 seconds, followed by 40 cycles of annealing at 94°C for 10 seconds then extension at 60°C for 60 seconds with fluorescent measurements taken at the end of each extension. Melt curves (60°C-94°C) with continuous acquisition were generated to verify single product amplification. Ct values were generated using software provided with the Lightcycler. To produce ΔΔCt values for individual biological replicates, the following steps were taken. The average of the three technical replicates was taken and standard deviation (SD) calculated in Excel. For each biological sample, ΔCtSAP6-PMA1 (average Ct SAP6 – average Ct PMA1) and standard deviation (SDSAP6-PMA1) were calculated ((SDSAP6)2 + (SDPMA1)2)0.5. To normalize data to the average wild-type value for graphical representation, the average of all wild-type ΔCt values was taken and then subtracted from each ΔCt value. The fold change from the average wild-type value is represent as 2−ΔΔCt. Standard deviation representing technical variation was calculated from 2−ΔCt, 2−ΔΔCt+SD, and 2−ΔΔCt-SD in Excel. For comparison of SAP6 expression between wild type and transcription factor mutants, average Ct values (Ctavg) and ΔCtavg,SAP6avg,PMA1 for each biological sample were calculated then the average ΔCt(avg,SAP6-avg,PMA1),strain and SD(avg,SAP6-avg,PMA1),strain value within each group (WT, efg1, brg1, rob1, or tec1) determined in Excel. ΔΔCt values were calculated as ΔCt(avg,SAP6-avg,PMA1),strain 1-ΔCt(avg,SAP6-avg,PMA1), wild type. Significance of the fold change between biological replicates of wild type and transcription factor mutants was calculated by GraphPad Prism using the one-tailed Mann-Whitney U test.
Quantification and Statistical Analysis
Statistical parameters and statistical test type (value of n, statistical significance, dispersion and precision measures) are reported in the figure legends and method details. Significance is defined as p<0.05. All in vivo GI competitions were assessed by a paired Student’s t test. Quantification of hyphae vs. yeast in vivo was assessed by an unpaired student’s t test. Fisher’s exact test was used for NanoString gene ontology term analysis. t tests were performed using GraphPad Prism 6.0 and 7.0. The significance of differences among NanoString and mRNA-seq expression data was determined using limma.
Data and Software Availability
Raw data for the commensalism screens (Accession # GSE124139) and RNA-seq (Accession # GSE124137) are available at the GEO website (https://www.ncbi.nlm.nih.gov/geo/).
Supplementary Material
Table S1. Sequencing results for C. albicans gut commensalism screens, Related to Figure 1. A) Screen 1. Mice (n=3) were colonized with a pooled inoculum of all mutants in the Noble and Homann deletion collections. Following 3 and 10 days of colonization, C. albicans was recovered from host feces, and high-throughput sequencing libraries were generated. Results are presented as the log base 2 fold-change for the fraction of total read counts of each mutant after recovery from animals (R) compared to the inoculum (I). Analysis was performed as described in the Methods. B) Screen 2. Mice (n=3) were colonized with all mutants in the Noble and Homann deletion collections except for efg1. Following 5 and 10 days of colonization, C. albicans was recovered, sequencing libraries were generated, and analysis performed as for Screen 1. C) Screen 3. Mice (n=2) were colonized with all mutants in the Noble and Homann deletion collections except for efg1, brg1, and rob1. Following 3 and 10 days of colonization, C. albicans was recovered, sequencing libraries were generated, and analysis performed as for Screens 1 and 2.
Table S2. NanoString analysis of C. albicans in different GI compartments over time, Related to Figure 4. Mice (n = 3 per time point) were colonized with WT C. albicans (SN425) and GI segments were recovered after 1, 4, and 10 days of colonization. RNA was extracted from the tissue and luminal contents of each named compartment. Results for each evaluated transcript are presented as log base 2-transformed ratios of the counts in each sample to counts in the inoculum (YEPD, 30°C, OD600=1.0). Samples associated with <20 raw counts were removed from analysis and are represented as gray boxes. Terminal numbers indicate biological replicate. ‘Function’ denotes the seven functional categories to which each transcript could be assigned, based on the gene description in the Candida Genome Database for ‘pH-related processes’, ‘nutrient acquisition and metabolism’, ‘adhesion and cell wall structure’, ‘the cell cycle’, ‘stress response’, and ‘other processes.’ ‘Filamentation-associated’ transcripts were defined as ones that were upregulated under at least five of ten in vitro hypha-inducing conditions in the study by Azadmanesh et al. 2017 (Azadmanesh et al., 2017). Adjusted p-values were generated using the linear fit model created by limma from the probe counts for all samples.
Table S3. NanoString data for comparison of ume6 and wild-type C. albicans in different GI compartments over time, Related to Figures 3 and 5. Mice (n=3 per fungal strain) were colonized with either WT C. albicans (SN250) or ume6 (SN1479) and GI segments were recovered at day 10 post colonization. RNA extraction and data analysis was performed as in Table S2. Adjusted p-values were generated using limma and represent comparisons of results from all compartments colonized with ume6 to all compartments colonized with wild type.
Table S4. mRNA-Seq data for wild-type C. albicans and ume6 propagated under standard and hypha-inducing in vitro conditions and in a mouse model of GI colonization, Related to Figure 5. WT C. albicans (SN250) and ume6 (SN1479) were individually propagated under standard in vitro conditions (n=3, ~4.5 hours in YEPD, 30°C, to mid l og phase growth, OD600=1.0), hypha-inducing conditions (n=3, 5 hours in YEPD+10% bovine serum, 37°C), and in the murine GI colonization model (n=5 biological replicates; 10 days, with recovery from the lumen of large intestines). PolyA RNA from each sample was evaluated by mRNA-seq. Results are presented as log base 2 (fold change) for all transcripts that were detected (tpm > 10) under at least one condition. Adjusted p-values were generated using limma. ‘Upregulated in filaments’ and ‘Downregulated in filaments’ indicate whether the transcript was upregulated or downregulated under at least five hypha-inducing conditions in the study by Azadmanesh et al. 2017 (Azadmanesh et al., 2017)
Table S5. Primers used in this study, Related to Figure, Figure 2, and Figure 6
HIGHLIGHTS.
Candida albicans colonizes the gastrointestinal tract as a mixture of yeasts and hyphae
A C. albicans hyphal gene network that promotes virulence inhibits commensal fitness
Commensal fitness is inversely related to hypha-specific virulence effectors
Hosts may tolerate yeasts while restricting pathogenic hyphae in the gut
ACKNOWLEDGEMENTS
We thank Jan Carette for his protocol for linear PCR-based quantitation of genomic sequences, Justin Sonnenburg, KC Huang, and their labs for guidance with FISH, Susan Lynch for fungal ITS sequencing in murine feces, and Mark Voorhies for help with data analysis. Brittany Gianetti constructed SN1478 and SN1479. Kalyan Pande performed an initial commensalism screen. Hiten Madhani provided useful comments on the manuscript. This work was supported by US National Institutes of Health (NIH) grant R01AI108992, a Burroughs Welcome Award in the Pathogenesis of Infectious Disease, and a Pew Foundation scholarship. JNW was supported by NIH grant T32AI060537 and a UCSF Discovery Fellows Grant. PP was supported by NIH grant T32AI060537.
Footnotes
Publisher's Disclaimer: This is a PDF file of an unedited manuscript that has been accepted for publication. As a service to our customers we are providing this early version of the manuscript. The manuscript will undergo copyediting, typesetting, and review of the resulting proof before it is published in its final citable form. Please note that during the production process errors may be discovered which could affect the content, and all legal disclaimers that apply to the journal pertain.
DECLARATION OF INTERESTS
The authors declare no competing interests.
REFERENCES
- Atarashi K, Tanoue T, Ando M, Kamada N, Nagano Y, Narushima S, Suda W, Imaoka A, Setoyama H, Nagamori T, et al. (2015). Th17 Cell Induction by Adhesion of Microbes to Intestinal Epithelial Cells. Cell 163, 367–380. [DOI] [PMC free article] [PubMed] [Google Scholar]
- Azadmanesh J, Gowen AM, Creger PE, Schafer ND, and Blankenship JR (2017). Filamentation Involves Two Overlapping, but Distinct, Programs of Filamentation in the Pathogenic Fungus Candida albicans. G3 (Bethesda). [DOI] [PMC free article] [PubMed] [Google Scholar]
- Bailey DA, Feldmann PJ, Bovey M, Gow NA, and Brown AJ (1996). The Candida albicans HYR1 gene, which is activated in response to hyphal development, belongs to a gene family encoding yeast cell wall proteins. Journal of bacteriology 178, 5353–5360. [DOI] [PMC free article] [PubMed] [Google Scholar]
- Banerjee M, Thompson DS, Lazzell A, Carlisle PL, Pierce C, Monteagudo C, Lopez-Ribot JL, and Kadosh D (2008). UME6, a novel filament-specific regulator of Candida albicans hyphal extension and virulence. Mol Biol Cell 19, 1354–1365. [DOI] [PMC free article] [PubMed] [Google Scholar]
- Banerjee M, Uppuluri P, Zhao XR, Carlisle PL, Vipulanandan G, Villar CC, Lopez-Ribot JL, and Kadosh D (2013). Expression of UME6, a key regulator of Candida albicans hyphal development, enhances biofilm formation via Hgc1- and Sun41-dependent mechanisms. Eukaryotic cell 12, 224–232. [DOI] [PMC free article] [PubMed] [Google Scholar]
- Bockmuhl DP, Krishnamurthy S, Gerads M, Sonneborn A, and Ernst JF (2001). Distinct and redundant roles of the two protein kinase A isoforms Tpk1p and Tpk2p in morphogenesis and growth of Candida albicans. Molecular microbiology 42, 1243–1257. [DOI] [PubMed] [Google Scholar]
- Bohm L, Torsin S, Tint SH, Eckstein MT, Ludwig T, and Perez JC (2017). The yeast form of the fungus Candida albicans promotes persistence in the gut of gnotobiotic mice. PLoS pathogens 13, e1006699. [DOI] [PMC free article] [PubMed] [Google Scholar]
- Bongomin F, Gago S, Oladele RO, and Denning DW (2017). Global and Multi-National Prevalence of Fungal Diseases-Estimate Precision. J Fungi (Basel) 3. [DOI] [PMC free article] [PubMed] [Google Scholar]
- Braun BR, and Johnson AD (2000). TUP1, CPH1 and EFG1 make independent contributions to filamentation in candida albicans. Genetics 155, 57–67. [DOI] [PMC free article] [PubMed] [Google Scholar]
- Bray NL, Pimentel H, Melsted P, and Pachter L (2016). Near-optimal probabilistic RNA-seq quantification. Nature biotechnology 34, 525–527. [DOI] [PubMed] [Google Scholar]
- Brown GD, Denning DW, Gow NA, Levitz SM, Netea MG, and White TC (2012). Hidden killers: human fungal infections. Science translational medicine 4, 165rv113. [DOI] [PubMed] [Google Scholar]
- Cao F, Lane S, Raniga PP, Lu Y, Zhou Z, Ramon K, Chen J, and Liu H (2006). The Flo8 transcription factor is essential for hyphal development and virulence in Candida albicans. Mol Biol Cell 17, 295–307. [DOI] [PMC free article] [PubMed] [Google Scholar]
- Carette JE, Guimaraes CP, Wuethrich I, Blomen VA, Varadarajan M, Sun C, Bell G, Yuan B, Muellner MK, Nijman SM, et al. (2011). Global gene disruption in human cells to assign genes to phenotypes by deep sequencing. Nature biotechnology 29, 542–546. [DOI] [PMC free article] [PubMed] [Google Scholar]
- Carlisle PL, Banerjee M, Lazzell A, Monteagudo C, Lopez-Ribot JL, and Kadosh D (2009). Expression levels of a filament-specific transcriptional regulator are sufficient to determine Candida albicans morphology and virulence. Proc Natl Acad Sci U S A 106, 599–604. [DOI] [PMC free article] [PubMed] [Google Scholar]
- Carlisle PL, and Kadosh D (2013). A genome-wide transcriptional analysis of morphology determination in Candida albicans. Molecular biology of the cell 24, 246–260. [DOI] [PMC free article] [PubMed] [Google Scholar]
- Castilla R, Passeron S, and Cantore ML (1998). N-acetyl-D-glucosamine induces germination in Candida albicans through a mechanism sensitive to inhibitors of cAMP-dependent protein kinase. Cell Signal 10, 713–719. [DOI] [PubMed] [Google Scholar]
- Chen C, Pande K, French SD, Tuch BB, and Noble SM (2011). An Iron Homeostasis Regulatory Circuit with Reciprocal Roles in Candida albicans Commensalism and Pathogenesis. Cell Host Microbe 10, 118–135. [DOI] [PMC free article] [PubMed] [Google Scholar]
- Chen YC, Wu CC, Chung WL, and Lee FJ (2002). Differential secretion of Sap4–6 proteins in Candida albicans during hyphae formation. Microbiology 148, 3743–3754. [DOI] [PubMed] [Google Scholar]
- Childers DS, and Kadosh D (2015). Filament condition-specific response elements control the expression of NRG1 and UME6, key transcriptional regulators of morphology and virulence in Candida albicans. PloS one 10, e0122775. [DOI] [PMC free article] [PubMed] [Google Scholar]
- Childers DS, Mundodi V, Banerjee M, and Kadosh D (2014). A 5' UTR-mediated translational efficiency mechanism inhibits the Candida albicans morphological transition. Molecular microbiology 92, 570–585. [DOI] [PMC free article] [PubMed] [Google Scholar]
- Davis D, Wilson RB, and Mitchell AP (2000). RIM101-dependent and-independent pathways govern pH responses in Candida albicans. Mol Cell Biol 20, 971–978. [DOI] [PMC free article] [PubMed] [Google Scholar]
- De Bernardis F, Muhlschlegel FA, Cassone A, and Fonzi WA (1998). The pH of the host niche controls gene expression in and virulence of Candida albicans. Infect Immun 66, 3317–3325. [DOI] [PMC free article] [PubMed] [Google Scholar]
- Doedt T, Krishnamurthy S, Bockmuhl DP, Tebarth B, Stempel C, Russell CL, Brown AJ, and Ernst JF (2004). APSES proteins regulate morphogenesis and metabolism in Candida albicans. Mol Biol Cell 15, 3167–3180. [DOI] [PMC free article] [PubMed] [Google Scholar]
- Du H, Guan G, Xie J, Sun Y, Tong Y, Zhang L, and Huang G (2012). Roles of Candida albicans Gat2, a GATA-type zinc finger transcription factor, in biofilm formation, filamentous growth and virulence. PloS one 7, e29707. [DOI] [PMC free article] [PubMed] [Google Scholar]
- Earle KA, Billings G, Sigal M, Lichtman JS, Hansson GC, Elias JE, Amieva MR, Huang KC, and Sonnenburg JL (2015). Quantitative Imaging of Gut Microbiota Spatial Organization. Cell host & microbe 18, 478–488. [DOI] [PMC free article] [PubMed] [Google Scholar]
- Gabrielli E, Pericolini E, Luciano E, Sabbatini S, Roselletti E, Perito S, Kasper L, Hube B, and Vecchiarelli A (2015). Induction of caspase-11 by aspartyl proteinases of Candida albicans and implication in promoting inflammatory response. Infection and immunity 83, 1940–1948. [DOI] [PMC free article] [PubMed] [Google Scholar]
- Gabrielli E, Sabbatini S, Roselletti E, Kasper L, Perito S, Hube B, Cassone A, Vecchiarelli A, and Pericolini E (2016). In vivo induction of neutrophil chemotaxis by secretory aspartyl proteinases of Candida albicans. Virulence 7, 819–825. [DOI] [PMC free article] [PubMed] [Google Scholar]
- Gomez-Raja JD, D.A. (2012). The beta-arrestin-like protein Rim8 is hyperphosphorylated and complexes with Rim21 and Rim101 to promote adaptation to neutral-alkaline pH. Eukaryotic cell, 683–693. [DOI] [PMC free article] [PubMed] [Google Scholar]
- Homann OR, Dea J, Noble SM, and Johnson AD (2009). A phenotypic profile of the Candida albicans regulatory network. PLoS Genet 5, e1000783. [DOI] [PMC free article] [PubMed] [Google Scholar]
- Jackson BE, Wilhelmus KR, and Hube B (2007). The role of secreted aspartyl proteinases in Candida albicans keratitis. Invest Ophthalmol Vis Sci 48, 3559–3565. [DOI] [PubMed] [Google Scholar]
- Johansson ME, and Hansson GC (2012). Preservation of mucus in histological sections, immunostaining of mucins in fixed tissue, and localization of bacteria with FISH. Methods in molecular biology 842, 229–235. [DOI] [PubMed] [Google Scholar]
- Kadosh D, and Johnson AD (2005). Induction of the Candida albicans filamentous growth program by relief of transcriptional repression: a genome-wide analysis. Mol Biol Cell 16, 2903–2912. [DOI] [PMC free article] [PubMed] [Google Scholar]
- Kalantar-Zadeh K, Berean KJ, Ha N, Chrimes AF, Xu K, Grando D, Ou JZ, Pillai N, Campbell JL, Brkljača R, et al. (2018). A human pilot trial of ingestible electronic capsules capable of sensing different gases in the gut. Nature Electronics. [Google Scholar]
- Klengel T, Liang WJ, Chaloupka J, Ruoff C, Schroppel K, Naglik JR, Eckert SE, Mogensen EG, Haynes K, Tuite MF, et al. (2005). Fungal adenylyl cyclase integrates CO2 sensing with cAMP signaling and virulence. Current biology : CB 15, 2021–2026. [DOI] [PMC free article] [PubMed] [Google Scholar]
- Lane S, Birse C, Zhou S, Matson R, and Liu H (2001). DNA array studies demonstrate convergent regulation of virulence factors by Cph1, Cph2, and Efg1 in Candida albicans. J Biol Chem 276, 48988–48996. [DOI] [PubMed] [Google Scholar]
- Langmead B, Trapnell C, Pop M, and Salzberg SL (2009). Ultrafast and memory-efficient alignment of short DNA sequences to the human genome. Genome Biol 10, R25. [DOI] [PMC free article] [PubMed] [Google Scholar]
- Lassak T, Schneider E, Bussmann M, Kurtz D, Manak JR, Srikantha T, Soll DR, and Ernst JF (2011). Target specificity of the Candida albicans Efg1 regulator. Mol Microbiol 82, 602–618. [DOI] [PubMed] [Google Scholar]
- Leberer E, Harcus D, Dignard D, Johnson L, Ushinsky S, Thomas DY, and Schroppel K (2001). Ras links cellular morphogenesis to virulence by regulation of the MAP kinase and cAMP signalling pathways in the pathogenic fungus Candida albicans. Molecular microbiology 42, 673–687. [DOI] [PubMed] [Google Scholar]
- Leng P, Lee PR, Wu H, and Brown AJ (2001). Efg1, a morphogenetic regulator in Candida albicans, is a sequence-specific DNA binding protein. J Bacteriol 183, 4090–4093. [DOI] [PMC free article] [PubMed] [Google Scholar]
- Li M, Martin SJ, Bruno VM, Mitchell AP, and Davis DA (2004). Candida albicans Rim13p, a protease required for Rim101p processing at acidic and alkaline pHs. Eukaryotic cell 3, 741–751. [DOI] [PMC free article] [PubMed] [Google Scholar]
- Lo HJ, Kohler JR, DiDomenico B, Loebenberg D, Cacciapuoti A, and Fink GR (1997). Nonfilamentous C. albicans mutants are avirulent. Cell 90, 939–949. [DOI] [PubMed] [Google Scholar]
- Lu Y, Su C, and Liu H (2012). A GATA transcription factor recruits Hda1 in response to reduced Tor1 signaling to establish a hyphal chromatin state in Candida albicans. PLoS Pathog 8, e1002663. [DOI] [PMC free article] [PubMed] [Google Scholar]
- Lu Y, Su C, Solis NV, Filler SG, and Liu H (2013). Synergistic regulation of hyphal elongation by hypoxia, CO(2), and nutrient conditions controls the virulence of Candida albicans. Cell Host Microbe 14, 499–509. [DOI] [PMC free article] [PubMed] [Google Scholar]
- Mayer FL, Wilson D, and Hube B (2013). Candida albicans pathogenicity mechanisms. Virulence 4, 119–128. [DOI] [PMC free article] [PubMed] [Google Scholar]
- Moyes DL, Wilson D, Richardson JP, Mogavero S, Tang SX, Wernecke J, Hofs S, Gratacap RL, Robbins J, Runglall M, et al. (2016). Candidalysin is a fungal peptide toxin critical for mucosal infection. Nature 532, 64–68. [DOI] [PMC free article] [PubMed] [Google Scholar]
- Naglik J, Albrecht A, Bader O, and Hube B (2004). Candida albicans proteinases and host/pathogen interactions. Cellular microbiology 6, 915–926. [DOI] [PubMed] [Google Scholar]
- Nantel A, Dignard D, Bachewich C, Harcus D, Marcil A, Bouin AP, Sensen CW, Hogues H, van het Hoog M, Gordon P, et al. (2002). Transcription profiling of Candida albicans cells undergoing the yeast-to-hyphal transition. Mol Biol Cell 13, 3452–3465. [DOI] [PMC free article] [PubMed] [Google Scholar]
- Naseem S, and Konopka JB (2015). N-acetylglucosamine Regulates Virulence Properties in Microbial Pathogens. PLoS pathogens 11, e1004947. [DOI] [PMC free article] [PubMed] [Google Scholar]
- Nobile CJ, Fox EP, Nett JE, Sorrells TR, Mitrovich QM, Hernday AD, Tuch BB, Andes DR, and Johnson AD (2012). A recently evolved transcriptional network controls biofilm development in Candida albicans. Cell 148, 126–138. [DOI] [PMC free article] [PubMed] [Google Scholar]
- Nobile CJ, and Mitchell AP (2005). Regulation of cell-surface genes and biofilm formation by the C. albicans transcription factor Bcr1p. Curr Biol 15, 1150–1155. [DOI] [PubMed] [Google Scholar]
- Noble SM, French S, Kohn LA, Chen V, and Johnson AD (2010). Systematic screens of a Candida albicans homozygous deletion library decouple morphogenetic switching and pathogenicity. Nat Genet 42, 590–598. [DOI] [PMC free article] [PubMed] [Google Scholar]
- Noble SM, Gianetti BA, and Witchley JN (2017). Candida albicans cell-type switching and functional plasticity in the mammalian host. Nat Rev Microbiol 15, 96–108. [DOI] [PMC free article] [PubMed] [Google Scholar]
- Noble SM, and Johnson AD (2005). Strains and strategies for large-scale gene deletion studies of the diploid human fungal pathogen Candida albicans. Eukaryot Cell 4, 298–309. [DOI] [PMC free article] [PubMed] [Google Scholar]
- Odds FC (1987). Candida infections: an overview. Critical reviews in microbiology 15, 1–5. [DOI] [PubMed] [Google Scholar]
- Odds FC, Davidson AD, Jacobsen MD, Tavanti A, Whyte JA, Kibbler CC, Ellis DH, Maiden MC, Shaw DJ, and Gow NA (2006). Candida albicans strain maintenance, replacement, and microvariation demonstrated by multilocus sequence typing. J Clin Microbiol 44, 3647–3658. [DOI] [PMC free article] [PubMed] [Google Scholar]
- Pande K, Chen C, and Noble SM (2013). Passage through the mammalian gut triggers a phenotypic switch that promotes Candida albicans commensalism. Nat Genet 45, 1088–1091. [DOI] [PMC free article] [PubMed] [Google Scholar]
- Parra-Ortega B, Cruz-Torres H, Villa-Tanaca L, and Hernandez-Rodriguez C (2009). Phylogeny and evolution of the aspartyl protease family from clinically relevant Candida species. Mem Inst Oswaldo Cruz 104, 505–512. [DOI] [PubMed] [Google Scholar]
- Perez JC, Kumamoto CA, and Johnson AD Candida albicans commensalism and pathogenicity are intertwined traits directed by a tightly knit transcriptional regulatory circuit. PLoS biology 11, e1001510. [DOI] [PMC free article] [PubMed] [Google Scholar]
- Pfaller MA, and Diekema DJ (2007). Epidemiology of invasive candidiasis: a persistent public health problem. Clin Microbiol Rev 20, 133–163. [DOI] [PMC free article] [PubMed] [Google Scholar]
- Pierce JV, Dignard D, Whiteway M, and Kumamoto CA Normal adaptation of Candida albicans to the murine gastrointestinal tract requires Efg1p-dependent regulation of metabolic and host defense genes. Eukaryotic cell 12, 37–49. [DOI] [PMC free article] [PubMed] [Google Scholar]
- Pierce JV, and Kumamoto CA Variation in Candida albicans EFG1 expression enables host-dependent changes in colonizing fungal populations. mBio 3, e00117–00112. [DOI] [PMC free article] [PubMed] [Google Scholar]
- Pietrella D, Pandey N, Gabrielli E, Pericolini E, Perito S, Kasper L, Bistoni F, Cassone A, Hube B, and Vecchiarelli A (2013). Secreted aspartic proteases of Candida albicans activate the NLRP3 inflammasome. Eur J Immunol 43, 679–692. [DOI] [PubMed] [Google Scholar]
- Pietrella D, Rachini A, Pandey N, Schild L, Netea M, Bistoni F, Hube B, and Vecchiarelli A (2010). The Inflammatory response induced by aspartic proteases of Candida albicans is independent of proteolytic activity. Infection and immunity 78, 4754–4762. [DOI] [PMC free article] [PubMed] [Google Scholar]
- Ramage G, VandeWalle K, Lopez-Ribot JL, and Wickes BL (2002). The filamentation pathway controlled by the Efg1 regulator protein is required for normal biofilm formation and development in Candida albicans. FEMS Microbiol Lett 214, 95–100. [DOI] [PubMed] [Google Scholar]
- Ritchie ME, Phipson B, Wu D, Hu Y, Law CW, Shi W, and Smyth GK (2015). limma powers differential expression analyses for RNA-sequencing and microarray studies. Nucleic acids research 43, e47. [DOI] [PMC free article] [PubMed] [Google Scholar]
- Rocha CR, Schroppel K, Harcus D, Marcil A, Dignard D, Taylor BN, Thomas DY, Whiteway M, and Leberer E (2001). Signaling through adenylyl cyclase is essential for hyphal growth and virulence in the pathogenic fungus Candida albicans. Mol Biol Cell 12, 3631–3643. [DOI] [PMC free article] [PubMed] [Google Scholar]
- Rohland N, and Reich D (2012). Cost-effective, high-throughput DNA sequencing libraries for multiplexed target capture. Genome research 22, 939–946. [DOI] [PMC free article] [PubMed] [Google Scholar]
- Rosenbach A, Dignard D, Pierce JV, Whiteway M, and Kumamoto CA (2010). Adaptations of Candida albicans for growth in the mammalian intestinal tract. Eukaryotic cell 9, 1075–1086. [DOI] [PMC free article] [PubMed] [Google Scholar]
- Rune SJ, and Henriksen FW (1969). Carbon dioxide tensions in the proximal part of the canine gastrointestinal tract. Gastroenterology 56, 758–762. [PubMed] [Google Scholar]
- Saltzman HA, and Sieker HO (1968). Intestinal response to changing gaseous environments: normobaric and hyperbaric observations. Ann N Y Acad Sci 150, 31–39. [DOI] [PubMed] [Google Scholar]
- Schindelin J, Arganda-Carreras I, Frise E, Kaynig V, Longair M, Pietzsch T, Preibisch S, Rueden C, Saalfeld S, Schmid B, et al. (2012). Fiji: an open-source platform for biological-image analysis. Nat Methods 9, 676–682. [DOI] [PMC free article] [PubMed] [Google Scholar]
- Schweizer A, Rupp S, Taylor BN, Rollinghoff M, and Schroppel K (2000). The TEA/ATTS transcription factor CaTec1p regulates hyphal development and virulence in Candida albicans. Molecular microbiology 38, 435–445. [DOI] [PubMed] [Google Scholar]
- Simonetti N, Strippoli V, and Cassone A (1974). Yeast-mycelial conversion induced by N-acetyl-D-glucosamine in Candida albicans. Nature 250, 344–346. [DOI] [PubMed] [Google Scholar]
- Skrzypek MS, Binkley J, Binkley G, Miyasato SR, Simison M, and Sherlock G (2017). The Candida Genome Database (CGD): incorporation of Assembly 22, systematic identifiers and visualization of high throughput sequencing data. Nucleic acids research 45, D592–D596. [DOI] [PMC free article] [PubMed] [Google Scholar]
- Stoldt VR, Sonneborn A, Leuker CE, and Ernst JF (1997). Efg1p, an essential regulator of morphogenesis of the human pathogen Candida albicans, is a member of a conserved class of bHLH proteins regulating morphogenetic processes in fungi. EMBO J 16, 1982–1991. [DOI] [PMC free article] [PubMed] [Google Scholar]
- Tailford LE, Crost EH, Kavanaugh D, and Juge N (2015). Mucin glycan foraging in the human gut microbiome. Front Genet 6, 81. [DOI] [PMC free article] [PubMed] [Google Scholar]
- Tso GHW, Reales-Calderon JA, Tan ASM, Sem X, Le GTT, Tan TG, Lai GC, Srinivasan KG, Yurieva M, Liao W, et al. (2018). Experimental evolution of a fungal pathogen into a gut symbiont. Science 362, 589–595. [DOI] [PubMed] [Google Scholar]
- Turnbaugh PJ, Ridaura VK, Faith JJ, Rey FE, Knight R, and Gordon JI (2009). The effect of diet on the human gut microbiome: a metagenomic analysis in humanized gnotobiotic mice. Sci Transl Med 1, 6ra14. [DOI] [PMC free article] [PubMed] [Google Scholar]
- Vautier S, Drummond RA, Chen K, Murray GI, Kadosh D, Brown AJ, Gow NA, MacCallum DM, Kolls JK, and Brown GD (2015). Candida albicans colonization and dissemination from the murine gastrointestinal tract: the influence of morphology and Th17 immunity. Cellular microbiology 17, 445–450. [DOI] [PMC free article] [PubMed] [Google Scholar]
- White SJ, Rosenbach A, Lephart P, Nguyen D, Benjamin A, Tzipori S, Whiteway M, Mecsas J, and Kumamoto CA (2007). Self-regulation of Candida albicans population size during GI colonization. PLoS Pathog 3, e184. [DOI] [PMC free article] [PubMed] [Google Scholar]
- Wolf JM, Johnson DJ, Chmielewski D, and Davis DA (2010). The Candida albicans ESCRT pathway makes Rim101-dependent and -independent contributions to pathogenesis. Eukaryotic cell 9, 1203–1215. [DOI] [PMC free article] [PubMed] [Google Scholar]
- Woolford CA, Lagree K, Xu W, Aleynikov T, Adhikari H, Sanchez H, Cullen PJ, Lanni F, Andes DR, and Mitchell AP (2016). Bypass of Candida albicans Filamentation/Biofilm Regulators through Diminished Expression of Protein Kinase Cak1. PLoS genetics 12, e1006487. [DOI] [PMC free article] [PubMed] [Google Scholar]
- Xu W, Solis NV, Ehrlich RL, Woolford CA, Filler SG, and Mitchell AP (2015). Activation and alliance of regulatory pathways in C. albicans during mammalian infection. PLoS biology 13, e1002076. [DOI] [PMC free article] [PubMed] [Google Scholar]
- Xu XL, Lee RT, Fang HM, Wang YM, Li R, Zou H, Zhu Y, and Wang Y (2008). Bacterial peptidoglycan triggers Candida albicans hyphal growth by directly activating the adenylyl cyclase Cyr1p. Cell host & microbe 4, 28–39. [DOI] [PubMed] [Google Scholar]
- Zeidler U, Lettner T, Lassnig C, Muller M, Lajko R, Hintner H, Breitenbach M, and Bito A (2009). UME6 is a crucial downstream target of other transcriptional regulators of true hyphal development in Candida albicans. FEMS Yeast Res 9, 126–142. [DOI] [PubMed] [Google Scholar]
- Zheng L, Kelly CJ, and Colgan SP (2015). Physiologic hypoxia and oxygen homeostasis in the healthy intestine. A Review in the Theme: Cellular Responses to Hypoxia. Am J Physiol Cell Physiol 309, C350–360. [DOI] [PMC free article] [PubMed] [Google Scholar]
Associated Data
This section collects any data citations, data availability statements, or supplementary materials included in this article.
Supplementary Materials
Table S1. Sequencing results for C. albicans gut commensalism screens, Related to Figure 1. A) Screen 1. Mice (n=3) were colonized with a pooled inoculum of all mutants in the Noble and Homann deletion collections. Following 3 and 10 days of colonization, C. albicans was recovered from host feces, and high-throughput sequencing libraries were generated. Results are presented as the log base 2 fold-change for the fraction of total read counts of each mutant after recovery from animals (R) compared to the inoculum (I). Analysis was performed as described in the Methods. B) Screen 2. Mice (n=3) were colonized with all mutants in the Noble and Homann deletion collections except for efg1. Following 5 and 10 days of colonization, C. albicans was recovered, sequencing libraries were generated, and analysis performed as for Screen 1. C) Screen 3. Mice (n=2) were colonized with all mutants in the Noble and Homann deletion collections except for efg1, brg1, and rob1. Following 3 and 10 days of colonization, C. albicans was recovered, sequencing libraries were generated, and analysis performed as for Screens 1 and 2.
Table S2. NanoString analysis of C. albicans in different GI compartments over time, Related to Figure 4. Mice (n = 3 per time point) were colonized with WT C. albicans (SN425) and GI segments were recovered after 1, 4, and 10 days of colonization. RNA was extracted from the tissue and luminal contents of each named compartment. Results for each evaluated transcript are presented as log base 2-transformed ratios of the counts in each sample to counts in the inoculum (YEPD, 30°C, OD600=1.0). Samples associated with <20 raw counts were removed from analysis and are represented as gray boxes. Terminal numbers indicate biological replicate. ‘Function’ denotes the seven functional categories to which each transcript could be assigned, based on the gene description in the Candida Genome Database for ‘pH-related processes’, ‘nutrient acquisition and metabolism’, ‘adhesion and cell wall structure’, ‘the cell cycle’, ‘stress response’, and ‘other processes.’ ‘Filamentation-associated’ transcripts were defined as ones that were upregulated under at least five of ten in vitro hypha-inducing conditions in the study by Azadmanesh et al. 2017 (Azadmanesh et al., 2017). Adjusted p-values were generated using the linear fit model created by limma from the probe counts for all samples.
Table S3. NanoString data for comparison of ume6 and wild-type C. albicans in different GI compartments over time, Related to Figures 3 and 5. Mice (n=3 per fungal strain) were colonized with either WT C. albicans (SN250) or ume6 (SN1479) and GI segments were recovered at day 10 post colonization. RNA extraction and data analysis was performed as in Table S2. Adjusted p-values were generated using limma and represent comparisons of results from all compartments colonized with ume6 to all compartments colonized with wild type.
Table S4. mRNA-Seq data for wild-type C. albicans and ume6 propagated under standard and hypha-inducing in vitro conditions and in a mouse model of GI colonization, Related to Figure 5. WT C. albicans (SN250) and ume6 (SN1479) were individually propagated under standard in vitro conditions (n=3, ~4.5 hours in YEPD, 30°C, to mid l og phase growth, OD600=1.0), hypha-inducing conditions (n=3, 5 hours in YEPD+10% bovine serum, 37°C), and in the murine GI colonization model (n=5 biological replicates; 10 days, with recovery from the lumen of large intestines). PolyA RNA from each sample was evaluated by mRNA-seq. Results are presented as log base 2 (fold change) for all transcripts that were detected (tpm > 10) under at least one condition. Adjusted p-values were generated using limma. ‘Upregulated in filaments’ and ‘Downregulated in filaments’ indicate whether the transcript was upregulated or downregulated under at least five hypha-inducing conditions in the study by Azadmanesh et al. 2017 (Azadmanesh et al., 2017)
Table S5. Primers used in this study, Related to Figure, Figure 2, and Figure 6
Data Availability Statement
Raw data for the commensalism screens (Accession # GSE124139) and RNA-seq (Accession # GSE124137) are available at the GEO website (https://www.ncbi.nlm.nih.gov/geo/).