Abstract
Patient motion degrades image quality, affecting the quantitative assessment of PET images. This problem affects studies of coronary lesions in which microcalcification processes are targeted. Coronary PET imaging protocols require scans of up to 30 min, introducing the risk of gross patient motion (GPM) during the acquisition. Here, we investigate the feasibility of an automated data-driven method for the detection of GPM during PET acquisition. Methods: Twenty-eight patients with stable coronary disease underwent a 30-min PET acquisition 1 h after the injection of 18F-sodium fluoride (18F-NaF) at 248 ± 10 MBq (mean ± SD) and then a coronary CT angiography scan. An automated data-driven GPM detection technique tracking the center of mass of the count rates for every 200 ms in the PET list-mode data was devised and evaluated. Two patient motion patterns were considered: sudden repositioning (motion of >0.5 mm within 3 s) and general repositioning (motion of >0.3 mm over 15 s or more). After the reconstruction of diastolic images, individual GPM frames with focal coronary uptake were coregistered in 3 dimensions, creating a GPM-compensated (GPMC) image series. Lesion motion was reported for all lesions with focal uptake. Relative differences in SUVmax and target-to-background ratio (TBR) between GPMC and non-GPMC (standard electrocardiogram–gated data) diastolic PET images were compared in 3 separate groups defined by the maximum motion observed in the lesion (<5, 5–10, and >10 mm). Results: A total of 35 18F-NaF–avid lesions were identified in 28 patients. An average of 3.5 ± 1.5 GPM frames were considered for each patient, resulting in an average frame duration of 7 ± 4 (range, 3–21) min. The mean per-patient motion was: 7 ± 3 mm (maximum, 13.7 mm). GPM correction increased SUVmax and TBR in all lesions with greater than 5 mm of motion. In lesions with 5–10 mm of motion (n = 15), SUVmax and TBR increased by 4.6% ± 5.6% (P = 0.02) and 5.8% ± 6.4% (P < 0.002), respectively. In lesions with greater than 10 mm of motion (n = 15), the SUVmax and TBR increased by 5.0% ± 5.3% (P = 0.009) and 11.5% ± 10.1% (P = 0.001), respectively. GPM correction led to the diagnostic reclassification of 3 patients (11%). Conclusion: GPM during coronary 18F-NaF PET imaging is common and may affect quantitative accuracy. Automated retrospective compensation of this motion is feasible and should be considered for coronary PET imaging.
Keywords: data-driven motion detection, motion compensation, cardiac PET, PET/CT
Motion-related artifacts are detrimental to quantitative PET imaging. Three different motion patterns have been identified for the thoracic region: cardiac and respiratory (cardiorespiratory) motions and gross patient motion (GPM). Different strategies have been proposed to identify and correct for the induced motion. In clinical practice, 3-lead electrocardiograms are routinely used for cardiac gating (1). Several strategies for respiratory motion detection, using either external markers or data-driven approaches, have been proposed (1–3). Respiratory motion is often corrected using either gating approaches or dedicated motion compensation techniques (3–6). Several techniques have been proposed for neurologic PET scans (7,8), but GPM has not been investigated thoroughly for thoracic imaging protocols.
The impact of GPM in many thoracic PET imaging protocols is of interest (9). A coronary plaque imaging protocol is affected by all 3 motion patterns. These imaging studies target the identification of lesions with active calcification processes, which have been linked to unstable coronary atherosclerotic plaques (10–13). Unfortunately, the fact that the lesions are often the same size as the spatial resolution of PET scanner in most modern PET/CT systems (50–500 mm3) hampers their identification (14). Several motion-limiting and dedicated correction techniques for cardiorespiratory motion have been proposed to obtain quantitative accurate assessments of tracer uptake in the lesions (12,15–17). Nevertheless, GPM might impair the full potential of both respiratory and cardiac compensation techniques, not only for coronary plaque studies but also for all thoracic imaging protocols.
In this work, we aimed to estimate the frequency and relative impact on image quality of GPM in a patient cohort examined for coronary artery disease using 18F-sodium fluoride (18F-NaF). To this end, we developed a general, retrospective PET data–driven GPM detection technique for bulk motion on thoracic PET. The proposed GPM detection and compensation method is applicable without the need for modifying standard imaging acquisition protocols, as all motion detection events are based on the already existing PET list-mode data.
MATERIALS AND METHODS
Study Population
The study population comprised 28 patients who underwent hybrid 18F-NaF PET/CT examinations of the coronary arteries (Table 1). All patients had angiographically confirmed multivessel coronary artery disease, defined as either stenosis (>50%) or previous revascularization. Exclusion criteria included renal dysfunction (estimated glomerular filtration rate of ≤30 mL/min/1.73 m2), contraindication to CT contrast agents, and acute coronary syndrome within 12 mo before the examination. This study was approved by the local investigational review board (Edinburgh, U.K.), and written informed consent was obtained from all subjects.
TABLE 1.
Baseline Characteristics of 28 Patients
| Characteristic | Value |
| Age (mean ± SD y) | 68.5 ± 8.7 |
| Sex (no. of males/females) | 26/2 |
| Body mass index (mean ± SD) | 25.8 ± 3.0 |
| Cardiovascular risk factors (no. of patients) | |
| Diabetes mellitus | 0 |
| Current smoker | 3 |
| Hypertension | 21 |
| Hyperlipidemia | 28 |
Imaging Protocol
PET/CT
Patients were injected with 18F-NaF tracer at (248 ± 10 MBq (mean ± SD)) approximately 1 h (71 ± 16 min) before a 30-min PET acquisition in the list-mode format, performed on a 128-slice Biograph mCT system (Siemens Healthineers). All patients were scanned with arms positioned above the head. Low-dose CT for attenuation correction purposes was performed immediately before the PET emission acquisition (120 kV, 50 mAs, 3-mm slice thickness). All scans were acquired with tracking for cardiac contractions using a 3-lead electrocardiogram but without additional tracking of respiratory motion using external devices.
CT Angiography (CTA)
A coronary CTA scan was acquired immediately after the PET acquisition for anatomic identification of the lesions. CTA was performed with prospective gating, a 330-ms rotation time, body mass index (BMI)–dependent voltage (for a BMI of <25, 100 kV; for a BMI of ≥25, 120 kV), and tube currents of 160–245 mAs. The patients were given β-blockers (orally or intravenously) to achieve a target heart rate of fewer than 60 beats/min. A BMI-dependent bolus injection of contrast medium (400 mg/mL) was administered to the patients at a flow of 5–6 mL/s after determination of the appropriate trigger delay with a test bolus of 20 mL of contrast material.
Image Reconstruction
Two different PET datasets were evaluated in this study: a diastolic frame (third gate from standard 4-gate electrocardiogram–gated reconstruction) without GPM compensation (non-GPMC), as was used in an earlier coronary 18F-NaF PET study (12), and the same diastolic frame with GPM compensation (GPMC).
Both (GPMC and non-GPMC) datasets were reconstructed using the Siemens UltraHD reconstruction algorithm, which corrects for point spread function and time of flight (18). The images were reconstructed in batch mode using 2 iterations, 21 subsets, and 3-dimensional 5-mm gaussian filtration with the vendor-provided reconstruction toolbox (e7 tools [JSRecon12]; Siemens Healthineers).
GPM Detection
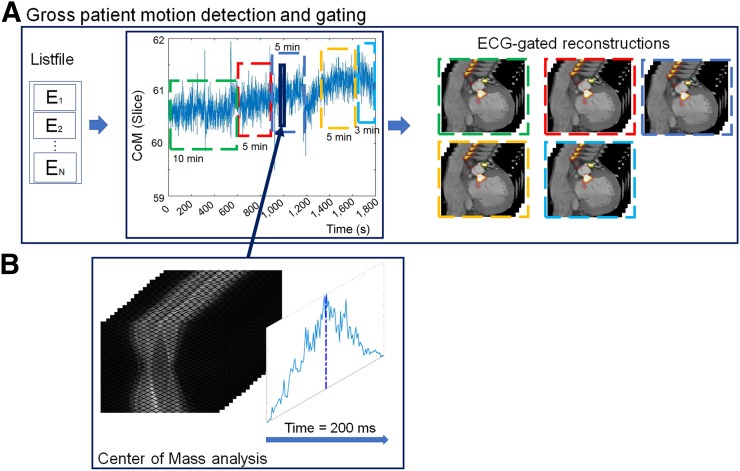
Information on patient repositioning events was extracted from the acquired PET list-mode data using an automated data-driven projection–based GPM detection technique. The overall concept of GPM detection is shown in Figure 1. The detection of GPM was based on evaluations of the center of mass (CoM) (Eq. 1) of single-slice rebinned sinograms (the rebinning algorithm compressed the full 3-dimensional sinogram to a series of 2-dimensional sinograms [3-dimensional volume]), with assessments for every 200 ms of the acquired list-mode file (2,19):
| Eq. 1 |
FIGURE 1.
GPM detection. (A) Information on patient repositioning relies on analyses of events (E1–EN) stored in list-mode file. (B) Patient position is obtained for every 200 ms using CoM assessment (solid dark blue line [including the blue enclosure and the dark blue arrow]) of single-slice rebinned sinogram series. New GPM frames are defined upon detection of changes in CoM baseline (>0.5 mm in 3 s or >0.3 mm over 15 s), as exemplified in A (green, red, dark blue, gold, and bright blue dashed frames). ECG = electrocardiogram.
where T is the histogram for time segment t and i is the slice number of the obtained counts (Fig. 1B). Each CoM assessment provided a position in the single-slice rebinned sinogram with 3 components (r, a, and z), corresponding to radial, angular, and axial positions, respectively. Although shifts of the z-component (axial motion) can be translated from the sinogram space to motion observed in the images, translations of shifts from the transaxial plane to the angular/radial plane are not straightforward. Despite the nonobvious connection between the motion measured in the sinogram space and the actual motion in image space, it is still possible to detect even complex motion patterns, such as cardiac contractions (2).
Two kinds of GPM were considered from the CoM baseline assessment: Sudden repositioning events and gradual patient motion, characterized by a general drift in the CoM baseline as a result of general muscle relaxation during the acquisition. Sudden repositioning events were considered when changes in the CoM baseline of more than 0.5 mm were detected within a time interval of 3 s. Likewise, gradual patient motion events were defined as general drifts in the CoM baseline exceeding 0.3 mm over a time interval of more than 15 s.
Because of the general properties of the method used (which was previously used to detect respiratory motion), respiratory motion is embedded in the CoM baseline assessment (2,20,21). Respiratory motion has a normal oscillating frequency of 0.2–0.5 Hz (12–30 respiratory cycles/min), which permits the filtering of respiratory frequencies such that only the underlying GPM component is present for the subsequent assessments. In the present study, the raw CoM baseline data were filtered using a band-stop filter (bandwidth, 0.2–0.5 Hz). After the band-stop filtering, the GPM signal was filtered using a moving average filter (3 s) to minimize the effect of residual noise introduced in the signal by deep breath-holds or shallow breathing (Fig. 1). Frames with a duration of fewer than 3 min were excluded from the following data assessment to ensure sufficient counting statistics in the resulting GPMC images.
GPMC
The motion compensation technique consisted of 3 steps: delineation of the lesions, definition of the reference frame, and image coregistration.
Lesion Delineation
Myocardial lesions with focal uptake were identified on the non-GPMC PET images on the basis of common features in the 2 image series (presence of a signal in CTA and focal uptake in PET images). All identified lesions were subject to a threshold-based delineation (70% of the SUVmax in the lesion) using a cylindric volume.
Reference Frame Definition
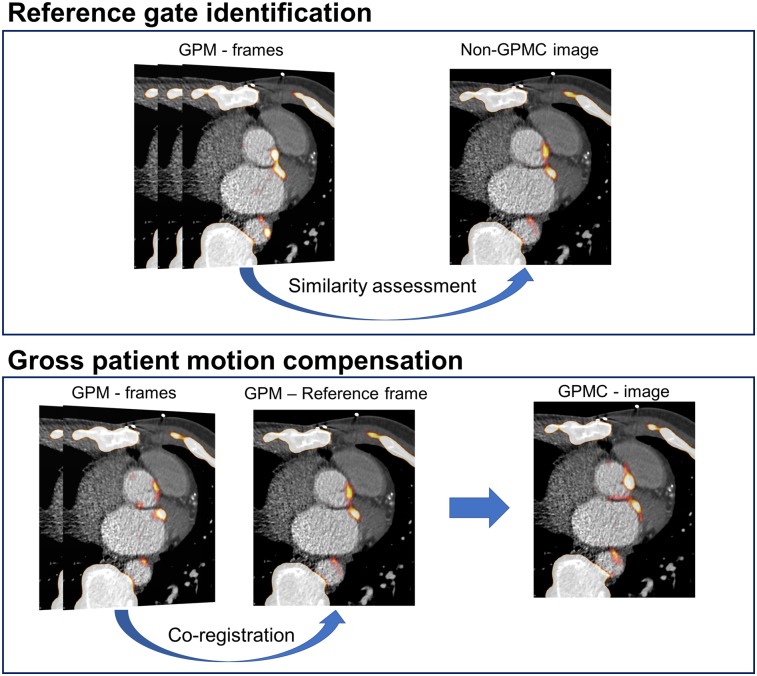
The reference frame was defined as the GPM frame with the lowest sum of square differences (most similar frame) in comparison to the non-GPMC image (Fig. 2).
FIGURE 2.
GPMC. Diastolic GPM frames (Fig. 1) are compared for similarity with original non-GPMC image. GPM frame most similar to original non-GPMC image (top) is chosen as reference image (most frequently the GPM frame with longest time duration). Coregistered images result in GPMC image.
Image Coregistration
The subsequent image coregistration was estimated from local measures of the motion vector fields obtained through delineations of the lesions. In the present study, the lesions were segmented in a software (FusionQuant, Cedars-Sinai Medical Center) using a spheric volume of interest (VOI) (radius, 5 mm) enclosing the part of the lesion with the highest level of uptake in the reference frame. The corresponding part of the lesion was segmented for all subsequent GPM frames. To preserve the outline as well as the heterogeneity of the lesions, the delineated lesions were coregistered with a rigid 3-parameter translation using the CoM assessment of the delineated lesions as the objective function. Through these coregistrations, we obtained a GPMC image.
Image Analysis
Patient Motion
The magnitude of GPM was evaluated for all patients. Patient motion was assessed in 3 dimensions (in millimeters) by calculation of the motion vectors obtained during the coregistration process. Average and maximum per-lesion motion was reported in 5-min intervals. In addition, the per-lesion motion was evaluated using 3 motion intervals (<5, 5–10, and ≥10 mm).
Effect of GPM on Quantitative Measures
On the basis of anatomic references obtained from the CTA images, 3-dimensional spheric VOIs (radius, 5 mm) were placed over the lesions. The VOIs were placed on lesions within all coronary segments with greater than 25% stenosis and a diameter of greater than or equal to 2 mm. Background blood-pool activity was determined from a cylindric VOI (radius, 10 mm; length, 15 mm) placed in the right atrium at the level of the takeoff of the right coronary artery. SUVmax in the VOIs as well as target-to-background ratios (TBR) were obtained. TBR values were calculated by dividing the SUVmax of the lesions by the SUVmean obtained from the blood pool (SUVBackground) of the right ventricle (Eq. 2) (22):
| Eq. 2 |
Diagnostic Evaluation
Two categories of lesions were defined using a previously validated methodology (11,12). In brief, 18F-NaF–avid lesions were identified as lesions with TBR of greater than or equal to 1.25, whereas 18F-NaF–negative lesions had TBR of less than 1.25. In the present study, we evaluated the effect of GPMC on 18F-NaF–avid lesions only. GPMC and non-GPMC images were compared on the basis of percentagewise increases in the SUVmax and TBR.
Statistical Analysis
The data were tested for normality using the Shapiro–Wilk test. The data were presented as mean ± SD or median. Image parameters before and after GPMC were compared using paired t tests. The statistical analyses were performed with MATLAB (The MathWorks, Inc.). A 2-sided P value of less than 0.05 was considered statistically significant.
RESULTS
GPM Detection
A total of 35 lesions were identified in 28 non-GPMC patient scans (Table 1). The patients were found to reposition (sudden repositioning and gradual patient motion combined) a total of 110 times during the acquisitions, resulting in an average of 3.9 GPM events per patient. Sixteen (4 sudden repositioning and 12 gradual patient motion) of the 110 GPM frames were discarded because of short frame duration (average duration, 1.0 ± 1.0 min).
The 94 accepted frames resulted in 2–7 GPM frames (average, 3.4 ± 1.2) per patient, corresponding to an average duration of 8.5 ± 4 (range, 3–21) min/frame. Gradual patient motion was most common, accounting for 87 of the 94 accepted GPM detections (93%).
Patient Motion
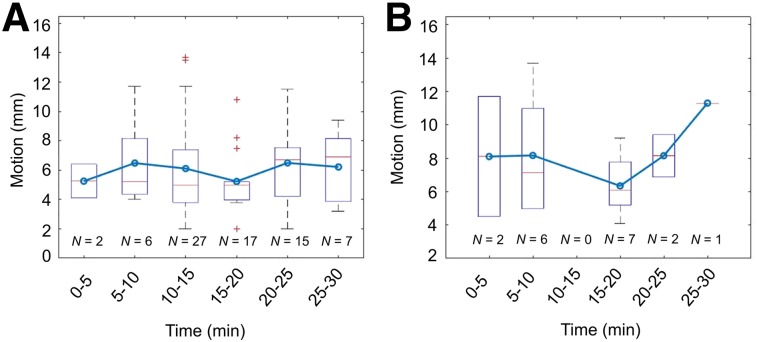
The magnitude of average lesion translations for each GPM event for lesions with focal uptake was 5.9 ± 2.8 mm (Fig. 3A). Analyses of per-lesion motion in 5-min intervals revealed the most frequent repositioning events in the tenth- to fifteenth-minute interval, with a total of 27 translations during this time period (Fig. 3A). Analyses of maximum per-patient motion revealed that the patient moved most toward the end of the scan (last 10 min of the acquisition) (Fig. 3B).
FIGURE 3.
Average and maximum (3-dimensional) GPM observed in patients at 5-min intervals. (A) Average GPM observed in all lesions affected by patient repositioning. (B) Maximal motion throughout acquisition. Major repositioning events are observed in beginning and toward end of acquisition. In both A and B, box plots and whiskers show median motion (red line) and range (whiskers); blue line with circles connecting boxes shows mean motion for each time interval.
Quantification
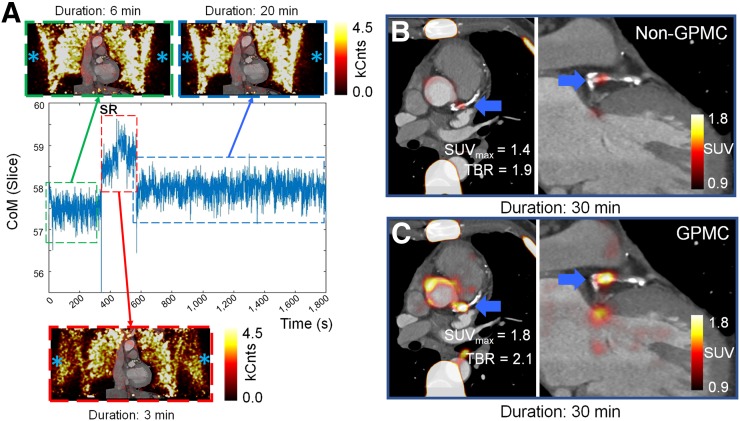
The SUVmax and TBR values increased by 4.7% ± 5.8% (SUVmax: P = 0.0001) and 8.4% ± 8.6% (TBR: P < 0.0001) on GPMC compared with non-GPMC images (Table 2). Figure 4A shows an example of a patient with a sudden repositioning event starting at minute 6 (red dashed frame). The patient likely experienced discomfort during the scan, leading to lowering of the arms for 3 min (Fig. 4A, red dashed frame) before the arms were elevated again. GPMC led to an increase in the SUVmax of 0.4 (corresponding to an increase of 38.6%) and a corresponding increase in the TBR of 0.2 (corresponding to an increase of 11%).
TABLE 2.
SUVmax and TBR Values Observed in Lesions Before and After GPMC
| Mean ± SD 18F-NaF avidity of lesions (n = 38) |
|||
| Parameter | Non-GPMC | GPMC | % Increase |
| SUVmax | 1.8 ± 0.4 | 1.9 ± 0.4 | 4.7 ± 5.8 (P = 0.0001) |
| TBR | 1.8 ± 0.6 | 2.0 ± 0.7 | 8.4 ± 8.6 (P < 0.0001) |
Significant changes are shown in bold type.
FIGURE 4.
Example of patient with sudden repositioning (SR) event during acquisition. (A) Repositioning led to total of 3 GPM frames (green, red, and blue dashed frames). At minute 6, patient shifted arms down for total of 3 min (red dashed frame), as shown on non–attenuation-corrected images (blue asterisks). Non–attenuation-corrected images were not used in analyses of patients but were used to visualize repositioning of arms. kCnts = kilocounts. (B and C) Attenuation-corrected PET images represented standard clinical reconstruction (non-GPMC) and GPMC datasets, respectively. Compensation of GPM resulted in increased SUVmax and TBR values in patient (thick blue arrows).
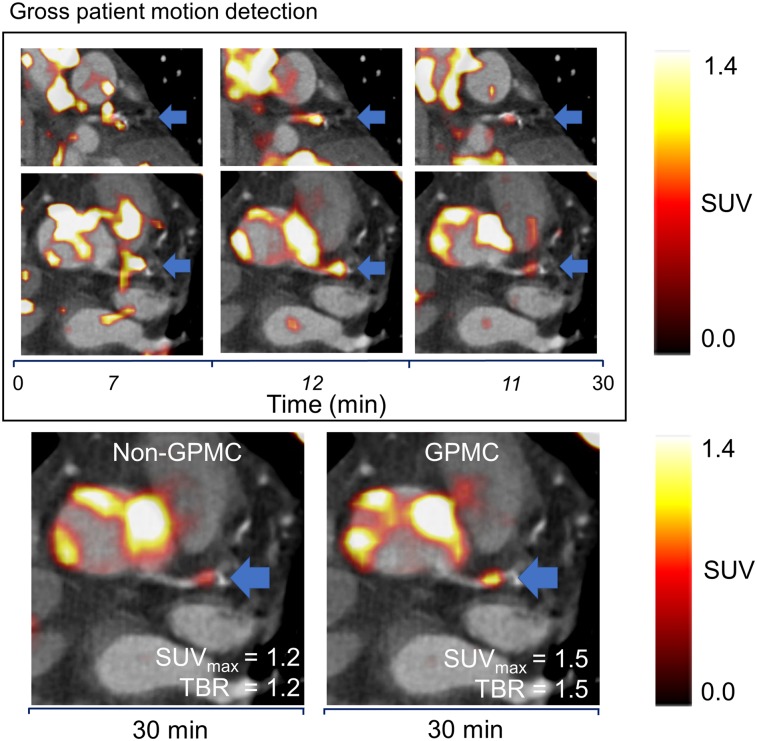
Figure 5 shows an example of a large amount of patient motion, which led to shifting of the lesion by more than 1 cm (maximum motion, 11.7 mm). GPMC images showed increased SUVmax (21.6% increase) and TBR (20.0% increase) compared with non-GPMC images.
FIGURE 5.
Example of patient with significant motion (11.7 mm) observed during acquisition. Significant intraframe motion was observed for 3 GPM frames (top). Time in italic type represents frame duration, and time not in italic type represents scan duration. Through coregistration, lesion activity was increased for GPMC images (blue arrows), resulting in transition of lesion from being 18F-NaF–negative to being 18F-NaF–avid (bottom).
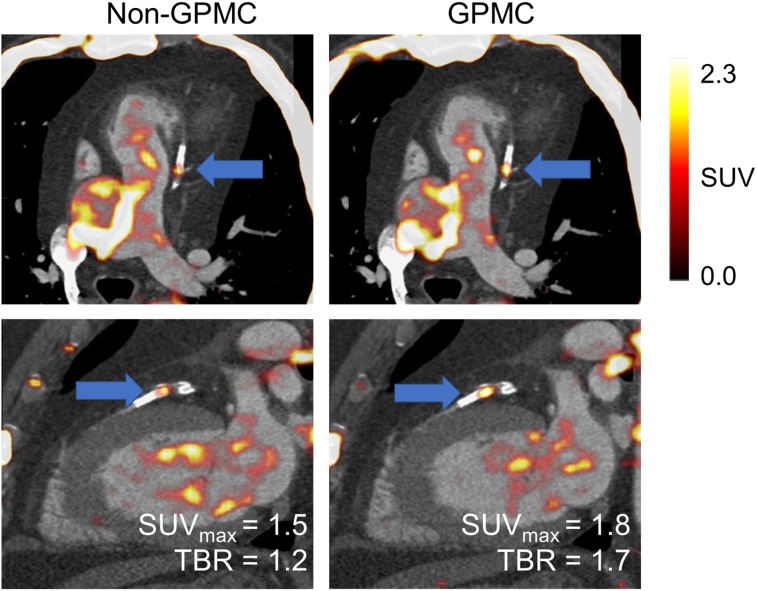
In another case example, GPMC images showed an increase in the TBR of 40% and a corresponding increase in the SUVmax of 20% (Fig. 6). This patient had an average motion of 5.7 ± 4.1 mm (maximum, 7.5 mm), leading to a shift of the entire lesion twice during the acquisition. GPMC resulted in a reclassification of the 18F-NaF–negative lesion on non-GPMC images (TBR, 1.19) to an 18F-NaF–avid lesion on the GPMC image series (TBR, 1.68).
FIGURE 6.
Patient with highest increase in TBR. Both lesion SUVmax and TBR increased significantly on GPMC images (by 20.7% and 40.8%, respectively), leading to reclassification of lesion (blue arrows) from 18F-NaF–negative to 18F-NaF–avid. SUVBackground was increased for non-GPMC image because of repositioning events that shifted high-activity regions into volume of interest in right ventricle.
Increased SUVmax and TBR were reported for all lesions on GPMC images, with the greatest effect on lesions with translations of >10 mm (Table 3; Fig. 7). GPMC resulted in a reassessment of the lesions in 3 patients (11%), leading to the definition of 38 18F-NaF–avid lesions, in contrast to 35 lesions before GPMC.
TABLE 3.
SUVmax and TBR Values for 18F-NaF–Avid Lesions in Patients with Maximum Motion Within 3 Intervals
| Lesion motion | No. of | % of | Mean ± SD SUVmax |
Mean ± SD TBR |
||||
| (mm) | lesions | lesions | Non-GPMC | GPMC | % Increase | Non-GPMC | GPMC | % Increase |
| <5 | 8 | 21 | 1.9 ± 0.3 | 2.0 ± 0.3 | 3.5 ± 5.5 (P = 0.17) | 1.8 ± 0.2 | 1.9 ± 0.3 | 7.2 ± 4.8 (P = 0.003) |
| 5–10 | 15 | 39 | 1.6 ± 0.4 | 1.7 ± 0.4 | 4.6 ± 5.6 (P = 0.02) | 1.7 ± 0.3 | 1.8 ± 0.3 | 5.8 ± 6.4 (P = 0.002) |
| >10 | 15 | 39 | 2.0 ± 0.3 | 2.1 ± 0.3 | 5.0 ± 5.3 (P < 0.01) | 2.0 ± 0.9 | 2.3 ± 0.9 | 11.5 ± 10.1 (P < 0.001) |
Significant changes are shown in bold type.
FIGURE 7.
TBR in lesions on non-GPMC and GPMC images. Larger increases in TBR were observed for patients with maximum translations of >10 mm.
DISCUSSION
In the present study, we evaluated the frequency and relative effect of GPM events during thoracic PET acquisitions and motion compensation for these events. Our main finding was that patient repositioning events occurred, on average, approximately 3 or 4 times during the 30-min acquisition. The proposed GPMC approach increased the SUVmax and TBR by up to 30% and 40%, respectively, and led to the reclassification of lesions in 3 patients (11%), with lesions becoming 18F-NaF–avid despite initially being perceived as 18F-NaF–negative. We demonstrated a simple but effective automated data-driven patient motion compensation technique that uses exclusively list-mode data, does not require any additional hardware during image acquisition, and can be applied retrospectively to data obtained with standard protocols.
To date, GPM during image acquisition has been explored primarily for neurologic imaging, and hardware solutions based on infrared systems and MR-based navigators have been proposed (7,8). Unfortunately, these techniques cannot easily be adapted for cardiovascular imaging in PET/CT systems because of the complex motion patterns of the myocardium and the need for additional advanced hardware. Alternatively, data-driven methods (PET-only–based) evaluating patient positioning during acquisition have proven their ability to accurately identify respiratory motion during the acquisition (2,23,24). As demonstrated in the present study, these techniques could also be used for the detection of GPM during acquisition, when a steady tracer distribution during the scan time can be assumed.
In addition, the proposed GPM detection method is not restricted purely to coronary lesion imaging, as no anatomic identifiers were used in the CoM assessment of the patient. The proposed technique evaluates the CoM of the acquired PET list-mode file data, which has the same distribution of counts as observed in non–attenuation-corrected PET images. As GPM events shift the entire thorax, it is inevitable that shifts in high-uptake areas (such as the lungs and skin), as seen in non–attenuation-corrected PET images, do not change the CoM assessment. For this reason, although the method uses a CoM-based approach, it may benefit from the heterogeneous sensitivity profile observed in the PET system (24). The bulk motion events will introduce shifts in the observed count rates used for GPM detection, which might amplify the detection of repositioning events. Because of these effects, it is likely that the proposed technique can detect repositioning events regardless of the underlying morphologic changes in the body and the tracer used for the assessment.
The GPMC approach has several important implications for the clinical assessment of vulnerable plaques in coronary 18F-NaF PET imaging protocols. Coronary PET image quality is hampered by several factors, including respiratory and cardiac motion as well as partial-volume effects. Our proposed technique introduces a first-step solution to reduce the consequences of complex GPM patterns during the scan. The implementation described here relies on a relatively simple motion compensation technique based on tracking the lesion signal on time frames. Nonetheless, GPMC may be introduced either before or during image reconstruction, as shown for studies of respiratory motion compensation (5). These techniques may combine compensations for GPM and respiratory motion as well as cardiac contraction into a fully motion-compensated image (12,15,17).
We acknowledge the limitations of the present study. The focus was on compensating for motion only in lesions with focal uptake patterns due to the signal void in lesions with negative PET results. The fact that the observed effect on the SUV was modest in some cases may be explained by the lack of remaining corrections for respiratory motion as well as partial-volume effects. Moreover, only diastolic-phase PET images were used to compare GPMC and non-GPMC images in the present study. The effect of the GPM could also be evaluated in combination with cardiac motion compensation (15,16).
The fact that the proposed GPM detection technique assumes no tracer distribution changes between isolated image frames limits its use to scans acquired after the steady-state distribution of the tracer. The requirements of the stable tracer distribution should not affect coronary plaque imaging or most oncologic assessments, in which scans are often acquired 1 h or more after tracer injection.
Another limitation is the nonlinear relationship between the motion detected in the sinogram space and the patient’s motion observed on the reconstructed images. This discrepancy prevents the detection of actual patient motion in millimeters directly in the sinogram space, which might be necessary in settings in which motion compensation during image reconstruction is desired. However, this limitation did not affect the reporting of patient motion or the motion compensation in the current project, as these were obtained in image space.
Finally, the study population consisted of only 28 patients. Nevertheless, the quantitative differences between GPMC and non-GPMC images were statistically significant despite this limited number of patients.
CONCLUSION
Patient motion during thoracic PET protocols leads to reduced TBR and SUV. A simple, yet effective, technique based on a CoM assessment of the raw PET data in list-mode format permits reliable detection of and compensation for GPM. TBR values were increased in patients with lesion motion exceeding 5 mm, in some cases leading to a reclassification of the identified lesions. Therefore, GPMC should be performed in thoracic PET studies.
Acknowledgments
We thank Spencer Zaid (Cedars–Sinai Medical Center) for proofreading the article.
DISCLOSURE
This research was supported in part by grant R01HL135557 from the National Heart, Lung, and Blood Institute (NHLBI). The content is solely the responsibility of the authors and does not necessarily represent the official views of the National Institutes of Health. The study was supported by Siemens Medical Systems research grant. This study was also supported by a grant (“Cardiac Imaging Research Initiative”) from the Miriam & Sheldon G. Adelson Medical Research Foundation. David E. Newby is supported by the British Heart Foundation (CH/09/002, RM/13/2/30158, RE/13/3/30183) and is the recipient of a Wellcome Trust Senior Investigator Award (WT103782AIA). Marc R. Dweck is supported by a Sir Jules Thorn Biomedical Research Award (JTA/15) and the British Heart Foundation (FS/14/78/31020). Daniel S. Berman, Guido Germano, and Piotr J. Slomka have received royalties from Cedars–Sinai Medical Center. No other potential conflict of interest relevant to this article was reported.
REFERENCES
- 1.Kesner AL, Schleyer PJ, Büther F, Walter MA, Schäfers KP, Koo PJ. On transcending the impasse of respiratory motion correction applications in routine clinical imaging: a consideration of a fully automated data driven motion control framework. EJNMMI Phys. 2014;1:8. [DOI] [PMC free article] [PubMed] [Google Scholar]
- 2.Büther F, Dawood M, Stegger L, et al. List mode-driven cardiac and respiratory gating in PET. J Nucl Med. 2009;50:674–681. [DOI] [PubMed] [Google Scholar]
- 3.Polycarpou I, Tsoumpas C, Marsden PK. Analysis and comparison of two methods for motion correction in PET imaging. Med Phys. 2012;39:6474–6483. [DOI] [PubMed] [Google Scholar]
- 4.Slomka PJ, Rubeaux M, Le Meunier L, et al. Dual-gated motion-frozen cardiac PET with Flurpiridaz F 18. J Nucl Med. 2015;56:1876–1881. [DOI] [PubMed] [Google Scholar]
- 5.Feng T, Wang J, Fung G, Tsui B. Non-rigid dual respiratory and cardiac motion correction methods after, during, and before image reconstruction for 4D cardiac PET. Phys Med Biol. 2016;61:151–168. [DOI] [PubMed] [Google Scholar]
- 6.Tsoumpas C, Polycarpou I, Thielemans K, et al. The effect of regularization in motion compensated PET image reconstruction: a realistic numerical 4D simulation study. Phys Med Biol. 2013;58:1759–1773. [DOI] [PubMed] [Google Scholar]
- 7.Olesen OV, Paulsen RR, Højgaard L, Roed B, Larsen R. Motion tracking for medical imaging: a nonvisible structured light tracking approach. IEEE Trans Med Imaging. 2012;31:79–87. [DOI] [PubMed] [Google Scholar]
- 8.Keller SH, Hansen C, Hansen C, et al. Sparsely sampled MR navigators as a practical tool for quality control and correction of head motion in simultaneous PET/MR. EJNMMI Phys. 2014;1(suppl 1):A36. [DOI] [PMC free article] [PubMed] [Google Scholar]
- 9.Woo J, Tamarappoo B, Dey D, et al. Automatic 3D registration of dynamic stress and rest 82 Rb and flurpiridaz F 18 myocardial perfusion PET data for patient motion detection and correction. Med Phys. 2011;38:6313–6326. [DOI] [PMC free article] [PubMed] [Google Scholar]
- 10.Joshi NV, Vesey A, Newby DE, Dweck MR. Will 18F-sodium fluoride PET-CT imaging be the magic bullet for identifying vulnerable coronary atherosclerotic plaques? Curr Cardiol Rep. 2014;16:521. [DOI] [PubMed] [Google Scholar]
- 11.Dweck MR, Chow MW, Joshi NV, et al. Coronary arterial 18F-sodium fluoride uptake: a novel marker of plaque biology. J Am Coll Cardiol. 2012;59:1539–1548. [DOI] [PubMed] [Google Scholar]
- 12.Joshi NV, Vesey AT, Williams MC, et al. 18F-fluoride positron emission tomography for identification of ruptured and high-risk coronary atherosclerotic plaques: a prospective clinical trial. Lancet. 2014;383:705–713. [DOI] [PubMed] [Google Scholar]
- 13.Cocker MS, Spence JD, Hammond R, et al. [18F]-NaF PET/CT identifies active calcification in carotid plaque. JACC Cardiovasc Imaging. 2017;10:486–488. [DOI] [PubMed] [Google Scholar]
- 14.Motoyama S, Ito H, Sarai M, et al. Plaque characterization by coronary computed tomography angiography and the likelihood of acute coronary events in mid-term follow-up. J Am Coll Cardiol. 2015;66:337–346. [DOI] [PubMed] [Google Scholar]
- 15.Rubeaux M, Joshi NV, Dweck MR, et al. Motion correction of 18F-NaF PET for imaging coronary atherosclerotic plaques. J Nucl Med. 2016;57:54–59. [DOI] [PubMed] [Google Scholar]
- 16.Rubeaux M, Joshi N, Dweck MR, et al. Demons versus level-set motion registration for coronary 18F-sodium fluoride PET. Proc SPIE Int Soc Opt Eng. 2016:9784:97843Y. [DOI] [PMC free article] [PubMed] [Google Scholar]
- 17.Cal-González J, Tsoumpas C, Lassen ML, et al. Impact of motion compensation and partial volume correction for 18F-NaF PET/CT imaging of coronary plaque. Phys Med Biol. 2017;63:015005. [DOI] [PubMed] [Google Scholar]
- 18.Lois C, Jakoby BW, Long MJ, et al. An assessment of the impact of incorporating Time-of-Flight information into vlinical PET/CT imaging. J Nucl Med. 2010;51:237–245. [DOI] [PMC free article] [PubMed] [Google Scholar]
- 19.Daube-Witherspoon ME, Muehllehner G. Treatment of axial data in three-dimensional PET. J Nucl Med. 1987;28:1717–1724. [PubMed] [Google Scholar]
- 20.Büther F, Ernst I, Dawood M, et al. Detection of respiratory tumour motion using intrinsic list mode-driven gating in positron emission tomography. Eur J Nucl Med Mol Imaging. 2010;37:2315–2327. [DOI] [PubMed] [Google Scholar]
- 21.Bundschuh RA, Martínez-Moeller A, Essler M, et al. Postacquisition detection of tumor motion in the lung and upper abdomen using list-mode PET data: a feasibility study. J Nucl Med. 2007;48:758–763. [DOI] [PubMed] [Google Scholar]
- 22.Pawade TA, Cartlidge TRG, Jenkins WSA, et al. Optimization and reproducibility of aortic valve 18F-Fluoride positron emission tomography in patients with aortic stenosis. Circ Cardiovasc Imaging. 2016;9:1–11. [DOI] [PMC free article] [PubMed] [Google Scholar]
- 23.Lassen ML, Beyer T, Berger A, et al. Data-driven, projection-based respiratory motion compensation of PET data for cardiac PET/CT and PET/MR imaging. J Nucl Cardiol. 2019. [Epub ahead of print]. [DOI] [PubMed] [Google Scholar]
- 24.He J, O’Keefe GJ, Gong SJ, et al. A novel method for respiratory motion gated with geometric sensitivity of the scanner in 3D PET. IEEE Trans Nucl Sci. 2008;55:2557–2565. [Google Scholar]


