Abstract
Summary
Computational drug target prediction has become an important process in drug discovery. Network-based approaches are commonly used in computational drug–target interaction (DTI) prediction. Existing network-based approaches are limited in capturing the contextual information on how diseases, drugs and genes are connected. Here, we proposed a context-sensitive network (CSN) model for DTI prediction by modeling contextual drug phenotypic relationships. We constructed a Drug-Side Effect Context-Sensitive Network (DSE-CSN) of 139 760 drug-side effect pairs, representing 1480 drugs and 5868 side effects. We also built a protein–protein interaction network (PPIN) of 15 267 gene nodes and 178 972 weighted edges. A heterogeneous network was built by connecting the DSE-CSN and the PPIN through 3684 known DTIs. For each drug on the DSE-CSN, its genetic targets were predicted and prioritized using a network-based ranking algorithm. Our approach was evaluated in both de novo and leave-one-out cross-validation analysis using known DTIs as the gold standard. We compared our DSE-CSN-based model to the traditional similarity-based network (SBN)-based prediction model. The results suggested that the DSE-CSN-based model was able to rank known DTIs highly. In a de novo cross-validation, the area under the receiver operating characteristic (ROC) curve was 0.95. In a leave-one-out cross-validation, the average rank was top 3.2% for known DTIs. When it was compared to the SBN-based model using the Precision-Recall curve, our CSN-based model achieved a higher mean average precision (MAP) (0.23 versus 0.19, P-value) in a de novo cross-validation analysis. We further improved the CSN-based DTI prediction by differentially weighting the drug-side effect pairs on the network and showed a significant improvement of the MAP (0.29 versus 0.23, P-value). We also showed that the CSN-based model consistently achieved better performances than the traditional SBN-based model across different drug classes. Moreover, we demonstrated that our novel DTI predictions can be supported by published literature. In summary, the CSN-based model, by modeling the context-specific inter-relationships among drugs and side effects, has a high potential in drug target prediction.
Availability and implementation
nlp/case/edu/public/data/DSE/CSN_DTI.
1. Introduction
Identifying drug targets is an important process in pharmaceutical research (Barabási et al., 2011; Hopkins, 2008). Predicting potential drug–target interactions (DTIs) can facilitate the drug discovery process such as drug repositioning and identifying drug combinations (Chen et al., 2016). However, experimentally exploring DTIs can be both time-consuming and costly (Whitebread et al., 2005). Therefore, many computational-based methods have been developed to automate the DTI discovery process.
Traditional computational approaches in predicting DTIs include docking simulation (Li et al., 2006; Luo et al., 2011; Mohan et al., 2005; Shoichet et al., 2002), feature vector-based approach (Nagamine et al., 2009; Nagamine and Sakakibara, 2007; Yabuuchi et al., 2014) and similarity-based method (Bleakley and Yamanishi, 2009; Gönen, 2012; Jacob and Vert, 2008; van Laarhoven et al., 2011; Xia et al., 2010; Yamanishi et al., 2008). With the emergence of multi-target drug design concept (Csermely et al., 2005; Hopkins, 2008), various network-based approaches have been proposed to predict DTIs. For network-based methods, novel DTIs are usually predicted based on protein–protein interactions (Chu and Chen, 2008), chemical structure similarities (Chen et al., 2012; Keiser et al., 2009) or known DTIs (Lu et al., 2017).
Drug side effects are observable phenotypic effects of drugs acting on their genetic off-targets in human bodies. While DTIs have so far been predicted mainly on the basis of molecular or cellular features (Chen et al., 2012; Chu and Chen, 2008; Keiser et al., 2009), phenotypic side-effect similarities have been recently used to predict drug targets. A previous study built drug similarity-based-networks (SBNs) based on shared side effects among drugs to predict DTIs assuming that drugs shared same side effects also shared the similar targets (Campillos et al., 2008). In another study, the authors calculate the pharmacological similarity scores among drugs based on number of shared side effects and fitted a kernel regression model to predict DTIs (Takarabe et al., 2012).
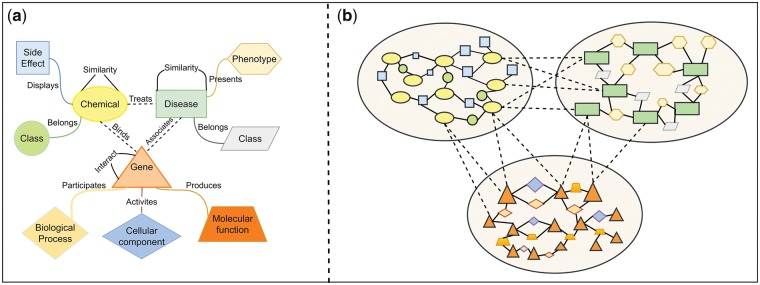
The fundamental of those previous studies is calculating the similarity scores among drugs. However, similarity scores only reflect the strength of connections among entities while ignoring how (i.e. context) two entities are connected. In the real world, the connections among drugs, diseases and genes are multi-typed (Fig. 1a). A new model, context-sensitive network (CSN), can simultaneously capture context-specific relationships among tens of thousands of different biomedical entities (Fig. 1b). We have recently applied this concept to model interrelationships among diseases and predicted disease genetics (Chen and Xu, 2016a). In this study, we proposed a CSN model for DTI prediction by directly modeling drug-side effect relationships.
Fig. 1.
(a) Different relationships among drugs, diseases and genes. (b) The visualization of the integrated context-sensitive network
We built a Drug-Side Effect Context-Sensitive Network (DSE-CSN) to model the phenotypic relationships among 1480 drugs and 5868 side effects (SEs) and predicted DTIs using the DSE-CSN-based model. Compared to the traditional SE-driven SBN model, the DSE-CSN captures more information by preserving semantic drug-SE relationships. For example, a traditional SBN (Fig. 2a) shows that goserelin is connected with afatinib and crizotinib with a similar number of side effects. However, a CSN (Fig. 2b) on which drugs are connected through specific side effects, captures the information that goserelin shares different kinds of side effects with afatinib and crizotinib. We showed that the DSE-CSN-based model have superior performances in both de novo and leave-one-out predictions than the SBN-based model. To the best of our knowledge, our study represents the first CSN-based model for DTI prediction.
Fig. 2.
(a) Drug nodes from a traditional similarity-based network (SBN), where drugs are connected based on the side effect similarity scores. (b) Drug nodes from a novel context-sensitive network (CSN), where drugs are directly connected through specific side effects
2. Materials and methods
We built a heterogeneous network which includes a Drug-Side Effect Context-Sensitive Network and a Protein–Protein Interaction Network. For each input drug, we predicted its genetic targets using a standard network-based ranking algorithm. Specifically, our approach’s outline is shown in Figure 3 and includes the following steps: (a) construct a DSE-CSN and a PPIN; (b) integrate the DSE-CSN with the PPIN through known drug–target interactions; (c) for each input drug, rank all the genes in the PPIN with a network-based ranking algorithm. To further improve the prediction, we experimented several weighting schemes to build weighted DSE-CSNs. We evaluated the performance of our approach in both de novo and leave-one-out cross-validation analysis and compared the CSN-based model with the traditional SBN-based model.
Fig. 3.
The outline of the DSE-CSN-based approach: (a) Construct a DSE-CSN and a PPIN. (b) Integrate the DSE-CSN and the PPIN. (c) Prioritize the genes by a network-based algorithm
2.1. Drug-Side Effect Context-Sensitive Network
We constructed the DSE-CSN using drug-SE pairs from Side Effect Resource (SIDER) 4, where drug-SE pairs were extracted from package inserts and public documents (Kuhn et al., 2016). We obtained a total of 139 760 drug-SE pairs between 1430 drugs and 5868 SEs. As shown in Figure 3a, the DSE-CSN consists of 1430 drug nodes, 5868 SE nodes and 139 760 edges among drugs and SEs. The connections between drug nodes and SE nodes are equally weighted.
2.2. Protein–protein interactions network
We extracted protein–protein interactions in human from STRING v 10 database (Szklarczyk et al., 2015) to build the protein–protein interaction network (PPIN). The protein–protein interactions in STRING were collected from multiple data sources, such as experiments, pathway knowledge and text mining (Szklarczyk et al., 2015). Here we only included PPIs with experimental evidence. The PPIN has 178 972 edges and 15 267 gene nodes (Fig. 3b). The edges on the PPIN were weighted based on the protein–protein interaction scores from STRING.
2.3. Connect the Drug-Side Effect Context-Sensitive Network and the protein–protein interaction network
The DSE-CSN and the PPIN were connected by the known interactions between drugs and genes in DrugBank 4.0 (Wishart et al., 2006). We mapped the drug labels in SIDER to drug labels in DrugBank based on drugs’ common names and synonyms. After mapping, 1125 of 1430 drug labels in SIDER were mapped to drug labels in DrugBank. This bipartite network included 884 approved drugs in SIDER and 802 genes in STRING. The drugs and genes were connected with 3684 drug–target interactions.
2.4. Predict potential drug–target interactions
Different from existing network-based prediction algorithms (Chen et al., 2015b; Li and Patra, 2010), where biological networks were based on similarity measures, we developed a context-sensitive network-based modeling techniques to capture the context specific interrelationships among biomedical entities. In this study, we constructed a context-sensitive drug network, where two drugs are directly linked through their specific shared side effects. Through comparative studies, we demonstrated in this study that DTI prediction based on context-sensitive network modeling performed significantly better than traditional similarity-based network modeling. Suppose that the initial probability vector is , and is the vector whose ith element represents the probability score of ith node at step k. The score vector at step k + 1 can be calculated as:
| (1) |
in which α denotes the probability of restarting from the seed node at each step, consists of the initial probabilities for all nodes and M denotes the transition matrix. The initial probability is 1 for the seed node and 0 for all other nodes. Suppose G represents the gene nodes, D represents the drug nodes and S represents the side effect nodes, the transition matrix is defined as:
| (2) |
Suppose represents the adjacency matrix of each subnetwork. To calculate the transition matrix M, we set λDG as the transition probability from the DSE-CSN to the PPIN and λGD as the transition probability from the PPIN to the DSE-CSN. For example, if the random walker stands on a node on the DSE-CSN which is connected with the PPIN, it may transpose to the PPIN with the probability of λDG or transpose within the DSE-CSN with the probability of and vice versa. The transition matrix among gene nodes was calculated as:
| (3) |
Since drug nodes only connected with SE nodes on the DSE-CSN, the transition matrices among drug nodes (or SE nodes) were . Similar, SE nodes did not connect with gene nodes, the transition matrices from SE nodes to gene nodes (or versa) were .
Suppose . The transition matrics from drug nodes to gene nodes (or versa) were calculated as:
| (4) |
The transition matrics from drug nodes to SE nodes (or versa) were calculated as:
| (5) |
| (6) |
2.5. Performance evaluation and comparison
To demonstrate the advantage of the DSE-CSN model to the traditional SBN models, we also constructed a DSE-SBN using the same datasets. Compared to the DSE-CSN, the DSE-SBN does not include SE nodes. Instead, the 1430 drug nodes were connected with 969 575 weighted edges. The weights of edges were formulated with the side effect similarity scores in the study of Campillos et al. (2008). We replaced the DSE-CSN with the DSE-SBN on the heterogeneous network and predicted DTIs. To demonstrate the contribution of the drug-SE network on the heterogeneous network, we also replaced the DSE-CSN with a random DSE-CSN on which drugs and SEs are randomly connected.
We conducted a de novo cross-validation analysis to evaluate our DSE-CSN-based model. In each de novo cross-validation, we removed all DTIs for a specific drug. Then we set the drug as the seed node and prioritize all the genes on the PPIN. We plotted the ROC curves to evaluate the overall performance of our method. We then used the 11-point interpolate Precision-Recall (PR) curves to compare different approaches (Schütze et al., 2008). When using PR-curve, the overall performance was measured by the mean average precision (MAP) which approximates the area under the 11-point interpolate PR-curve (Schütze et al., 2008). To avoid the normality assumption of the data, we used Bootstrap resampling to compare the difference of MAPs. The reason for using PR-curves instead of ROC curves for comparison is that PR-curves provide a more accurate picture of algorithms’ performance than ROC curves for highly skewed datasets, which are true for most of the prediction problems in biomedical domains, including our DTI prediction task (Davis et al., 2005; Davis and Goadrich, 2006).
We also conducted a leave-one-out cross-validation analysis to compare the DSE-CSN-based model with the traditional DSE-SBN-based model. In each leave-one-out cross-validation, we removed a link between a specific drug and a specific gene. We set the drug as the seed node and ranked all the genes while excluding those genes which already connected with the drug. Then we studied the rank of the tested gene. For a specific ranking threshold, if the rank of the tested gene was above the threshold, it was considered as successful prediction. For each model, we reported the number of successfully predicted DTIs for top 1, 5, 10 and 100 ranking thresholds.
2.6. Investigate the influence of parameter selection
To demonstrate that parameter selection did not significantly influence the performance, we ran the de novo cross-validation with different parameters for DSE-CSN-based and DSE-SBN-based models. We first fixed α and changed λDG from 0.1 to 0.9 while setting λGD as . Then we fixed λ s and changed α from 0.1 to 0.9. We plotted the MAPs and their 95% confident intervals versus the different parameters in Figure 4. The figure indicates that there is no significant change in MAPs when λDG is within [0.5, 0.9] and when α is within [0.3, 0.9] for both DSE-SBN-based and DSE-CSN-based models. This was consistent with the previous studies (Chen et al., 2015b; Chen and Xu, 2015, 2016a,b; Li and Patra, 2010). In the following experiments, we set λGD as 0.7 which is the median of range [0.5, 0.9] and set α as 0.3 which is the minimum value of range [0.3, 0.9] to ensure the walker can travel to the broadest area of the network.
Fig. 4.
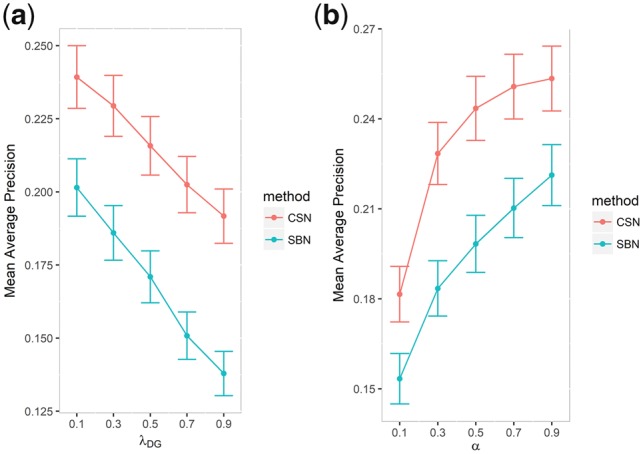
(a) Mean average precision versus the transition probabilities and (b) mean average precision versus the probability of restarting from the seed
2.7. Improve the DSE-CSN-based model by different weighting schemes
We weighted drug-SE pairs on DSE-CSN with different context information to improve the DTI prediction.
2.7.1. Frequency-based Drug-Side Effect Context-Sensitive Network
In this DSE-CSN model, edges connecting drug nodes and SE nodes are weighted by the frequency of occurrence of drug-SE pairs which was extracted from the package inserts (Kuhn et al., 2016). For some of the drug-SE pairs, the frequencies are not included in SIDER. We used the average frequencies of other drug-SE pairs to impute those missing frequencies.
2.7.2. Information content-based Drug-Side Effect Context-Sensitive Network
In this DSE-CSN, edges connecting drug nodes and SE nodes are weighted by the information content-based weights of each SEs which were calculated followed the definitions in the study of Campillos et al. (2008). For each SE , the information-content-based weight wi were calculated based on its rareness weight fi and correlation weight gi:
| (7) |
The rareness weight fi, which represents the abundance of the SEs in the dataset, is calculated as:
| (8) |
in which mi is the number of drugs associated with each SE si, M is the total number of drugs. The intuitive explanation is that drug pairs sharing lower abundant SEs are more likely to share same or similar targets.
The correlation weight gi of each SE was calculated by first hierarchal cluster all the SEs then weighted each SE based on the clustering using Gerstein-Sonnhammer-Chothia algorithm (Campillos et al., 2008). This weight can be explained as SEs have higher correlations with others are less likely to represent shared drug targets.
For a drug dj associated to SE si, the weight score of the corresponding edge eij is represented as:
| (9) |
2.8. Compare drug–target interaction prediction across different classes of drugs
To investigate whether the performance of our model varies among different drug classes, we classified the drugs into different therapeutic groups according to the Anatomical, Therapeutic and Chemical (ATC) classification system(Law et al., 2014), and evaluated the performance of our model within each group.
3. Results
3.1. De novo cross-validation
3.1.1. The DSE-CSN-based model achieved high performance
The receiver operating characteristic (ROC) curve in Figure 5 shows that the DSE-CSN-based model achieved an area under the curve (AUC) of 0.95. This result suggests that using drug side-effect information is a promising approach in predicting DTIs. The ROC, however, did not show a clear advantage of the DSE-CSN-based model compared to the DSE-SBN-based model. We noticed that the number of the negative examples (genes not targeted by drugs) greatly exceeds the number of positive examples (known drug targets) in our dataset. For highly skewed data, the ROC curves usually overestimate the performance (Davis and Goadrich, 2006). Therefore, the similar performance in ROC curve may be caused by: (i) The two models had similar prediction ability. (ii) The difference of the prediction ability was hidden by the highly skewed data (Davis and Goadrich, 2006). Compared to ROC curves, PR-curves are able to evaluate prediction algorithms more accurately with highly skewed data, which is common in biomedical field. We showed that the DSE-CSN-based model outperformed the DSE-SBN-based model when using PR-curves in the next section.
Fig. 5.
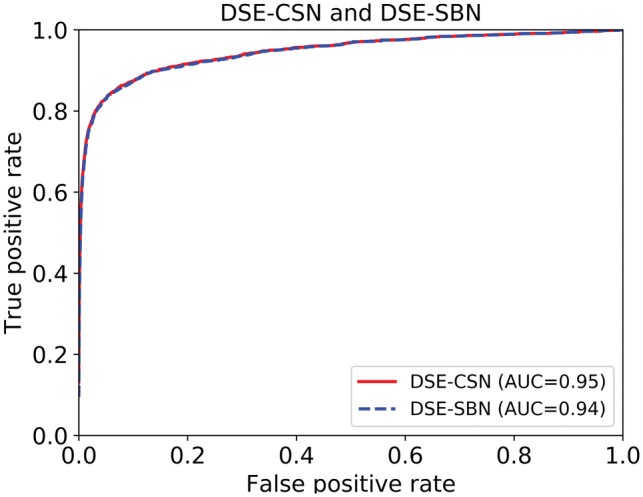
ROC curves for the DSE-CSN-based approach and the DSE-SBN-based approach
3.1.2. The DSE-CSN-based model performed better than the DSE-SBN-based model
Figure 6a shows that the unweighted DSE-CSN-based model achieved the MAP of 0.23, which is significantly higher than 0.09 achieved by the random DSE-CSN-based model (P-value < , Bootstrap resampling). This result demonstrated the contribution of the drug-SE network in the heterogeneous network. Since we did not randomize the PPIN, the PR-curve for random DSE-CSN was not flat. Figure 6b shows that DSE-CSN-based model outperformed traditional DSE-SBN-based model which yielded the MAP of 0.19 (P-value < , Bootstrap resampling). Those results demonstrated that while drug-SE information is promising in predicting DTIs, the performance would be highly depended on how to model the relationships among drugs. Here we demonstrated that directly modeling drug-SE relationships outperformed using SE similarity scores.
Fig. 6.
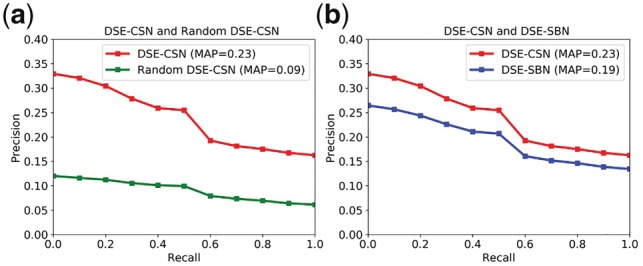
(a) Comparison between the Unweighted DSE-CSN and the Random DSE-CSN; (b) Comparison between Unweighted the DSE-CSN and the DSE-SBN
3.1.3. Weighting the drug-SE pairs on the network improved the DSE-CSN based model
Figure 7a shows that the frequency-based DSE-CSN yielded the similar MAP as the unweighted DSE-CSN. Given that the current version of SIDER misses more than half of (60%) the drug-SE pairs’ frequency information (Kuhn et al., 2016), we have the reason to believe that the frequency-based DSE-CSN will achieve higher performance than unweighted DSE-CSN with the abundance of side effect frequency information. Figure 7b shows that the information content-based DSE-CSN-based model achieved a MAP of 0.29, which is significantly higher than the unweighted DSE-CSN-based approach (P-value < , Bootstrap resampling).
Fig. 7.
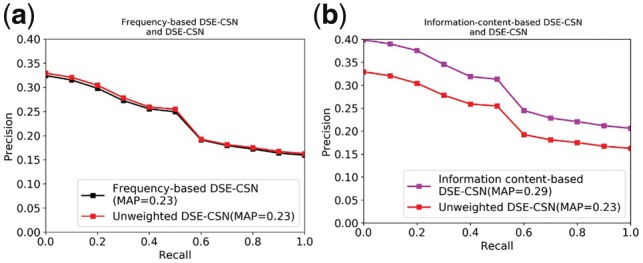
(a) Comparison between the Frequency-based DSE-CSN and the Unweighted DSE-CSN; (b) Comparison between the Information-content-based DSE-CSN and the Unweighted DSE-CSN
3.2. Leave-one-out cross-validation: the DSE-CSN-based model performed better than the DSE-SBN-based model
We evaluated the DSE-CSN (information content-based)-based model in a leave-one-out cross-validation analysis. Our model achieved an average rank of top 3.2% for all the known DTIs. This result suggested that our model has a promising performance for drugs with known targets. We then used the number of successfully predicted DTIs to reflect the discriminatory ability of different models. Figure 8 shows that the DSE-CSN-based model successfully predicted more retained DTIs than the traditional DSE-SBN-based model for different top-rank thresholds. For example, the DSE-CSN-based model ranked 550 known DTIs on top 1 which is significantly higher than 282 achieved by the traditional DSE-SBN-based model (P-value = 8.52 test).
Fig. 8.
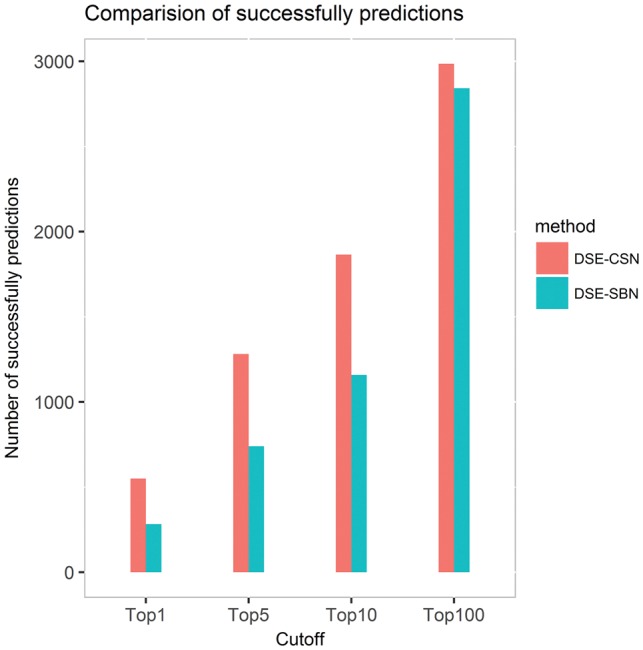
The number of successfully predicted drug–target interactions for the DSE-CSN-based model and the DSE-SBN-based model
3.3. Evaluate the performance of the DSE-CSN-based model across different drug classes
We evaluated the performance of the eight ATC top level classes for the DSE-CSN-based model (information content-based) and the DSE-SBN-based model. In Figure 9, we reported the PR-curves and MAPs for the DSE-CSN-based model for each classes. The prediction abilities were varied among different drug classes.
Fig. 9.
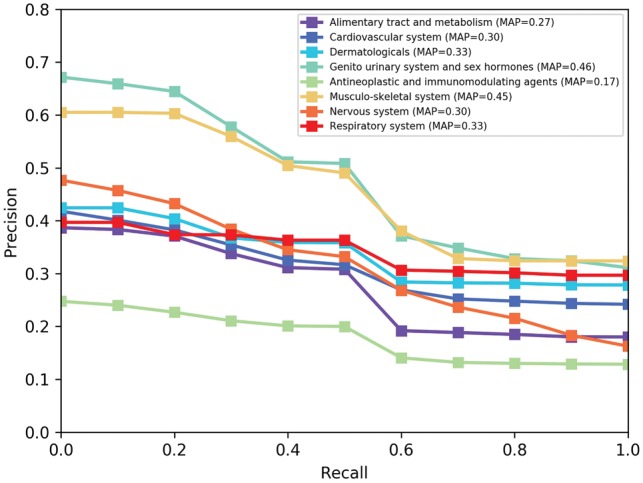
PR curves for the DSE-CSN approach across different ATC class in de novo cross-validation
We would like to investigate why the performance varies across different drug classes. We chose the Musculo-skeletal system class (MAP = 0.45) and the Antineoplastic and Immunomodulating agents class (MAP = 0.17) to perform a case study. We first extracted top 20 related SEs for each of these two classes. Then we found the unique top SEs for each class. Each of these two drug classes has six unique top related SEs. Table 1 shows the top unique SEs for Musculo-skeletal system class. Table 2 shows the top unique SEs for Antineoplastic and Immunomodulating agents class. We found that SEs related to Antineoplastic and immuno-modulating agents class tend to connected more drugs than those related to Musculo-skeletal system class. This result means drugs with more specific SEs tend to have a better performance because they are more accurately connected to similar drugs on the network.
Table 1.
Top related side effects for the Musculo-skeletal system class
| Side effect name | Side effect ID | Number of related drugs |
|---|---|---|
| Thrombocytopenia | C0040034 | 604 |
| Paraesthesia | C0030554 | 599 |
| Oedema | C0013604 | 571 |
| Leukopenia | C0023530 | 513 |
| Vertigo | C0042571 | 508 |
| Palpitations | C0030252 | 506 |
Table 2.
Top related side effects for the Antineoplastic and immunomodulating agents
| Side effect name | Side effect ID | Number of related drugs |
|---|---|---|
| Fatigue | C0015672 | 723 |
| Constipation | C0009806 | 701 |
| Insomnia | C0917801 | 675 |
| Pain | C0030193 | 663 |
| Hypotension | C0020649 | 662 |
| Confusional state | C0009676 | 542 |
We also compared the performance between the DSE-CSN-based model and the DSE-SBN-based model across different drug classes. Table 3 shows the MAP comparison across different drug classes. The DSE-CSN-based model significantly outperformed the DSE-SBN-based model in all eight drug classes (P-value , Bootstrap resampling).
Table 3.
Comparing DSE-CSN-based model to the DSE-SBN-based model in the de novo cross-validation across different drug classes
| Drug Class | SBN-based (MAP) | CSN-based (MAP) |
|---|---|---|
| Antineoplastic and immunomodulating agents | 0.090 | 0.17 |
| Alimentary tract and metabolism | 0.15 | 0.27 |
| Genito urinary system and sex hormones | 0.29 | 0.46 |
| Cardiovascular system | 0.19 | 0.30 |
| Nervous system | 0.19 | 0.30 |
| Musculo-skeletal system | 0.30 | 0.45 |
| Respiratory system | 0.28 | 0.33 |
| Dermatologicals | 0.31 | 0.33 |
3.4. Novel drug target predictions
We predicted novel drug–target interactions using the DSE-CSN-based model (information content-based). For each of the drugs, we ranked all the genes on the PPIN and excluded those known targets from the rank list. We studied the top 1% predicted targets for each of the drugs and found many of them can be supported by previous known experimental results or clinical evidence. Since we are currently interested in drug development for drug addiction, we presented predicted addiction-related drug–target interactions in Table 4. For example, our predictions showed that pregabalin could act on Dopamine Receptor D2, which is a member of the family of seven transmembrane domain G-protein-coupled receptors (Montmayeur et al., 1993). This prediction can be supported by the previous evidence that pregabalin decreased Dopamine Receptor D2-receptor gene expression in the prefrontal cortex and accumbens (Navarrete et al., 2012). Since Dopamine Receptor D2 is a target of action for antipsychotic drugs, this prediction is also supported by a recent clinical trial which suggests pregabalin as a treatment of anxiety in patients with schizophrenia (Schjerning et al., 2018).
Table 4.
Predicted drug–target interactions with evidence support
| Drug name | Target | Target rank | Reference |
|---|---|---|---|
| Pregabalin | Dopamine Receptor D2 | Top 0.56% | PMID22489711 |
| Oxycodone | Proenkephalin | Top 0.54% | PMID30059705 |
| Citalopram | Solute Carrier Family 6 Member 2 | Top 0.22% | J. Med. Chem., 2003, 46 (6), pp 925-935 |
| Bupropion | Opioid Receptor Mu 1 | Top 0.26% | PMID25436082 |
| Naltrexone | 5-Hydroxytryptamine Receptor 2A | Top 0.45% | PMID24395673 |
4. Conclusions and discussion
In this study, we proposed a Drug-Side Effect Context-Sensitive Network (DSE-CSN) model to predict potential drug–target interactions (DTIs) based on clinical phenotypes. We proposed different approaches to build the DSE-CSN. To evaluate the performance of our approach, we built a Drug-Side Effect Similarity-Based Network (DSE-SBN) followed the definitions of a previous study (Campillos et al., 2008). Our experiment results indicated that the DSE-CSN-based model outperformed the traditional similarity-based network model in both de novo and leave-one-out cross-validation analyses by directly modeling the semantic drug-SE relationships. We also demonstrated that weighting drug-side effect pairs on DSE-CSN could further improve the prediction ability. In addition, our novel predicted drug targets could be supported by published literature.
Our study can be improved in several aspects. First, the DSE-CSN and the PPIN are connected by known DTIs from DrugBank. We believe that the prediction ability can be further improved if we incorporate more known DTIs form other databases. Currently, DTIs from different databases are extracted from different sources (Chen et al., 2016). We plan to use different weighting schemes to incorporate DTIs from multiple databases on the network.
Second, our DSE-CSN can be further improved by incorporating more drug side effect data sources. For example, some side effects are patient specific and may not represent drug–target interactions. As more patient population information become available in the future, this contextual information of drugs and SEs can be modeled on the networks to improve the prediction performance further. Another example is that many of the side effects have not been included in SIDER (Xu and Wang, 2014b). We have done natural language processing, data mining and machine learning works in extracting drug-side effect pairs (Xu and Wang, 2014a,b, 2015). We plan to incorporate those results in our DSE-CSN to support DTI prediction in the future.
Third, our current CSN mainly uses the drug side-effect information. Currently, we are also incorporating other properties of drugs as well as disease information into the CSN framework. For example, we are using drugs’ chemical structures and genomics data. We are also connecting our previously constructed disease CSN (Chen and Xu, 2016a) into the DSE-CSN to further improve the DTI predictions.
Acknowledgements
R.X. conceived the study. M.Z., Y.C. and R.X. designed the experiment. M.Z. performed the experiment and wrote the manuscript.
Funding
M.Z. and R.X. are supported by Eunice Kennedy Shriver National Institute of Child Health & Human Development of the National Institutes of Health under the NIH Director's New Innovator Award number DP2HD084068 (Xu), NIH National Institute of Aging (1 R01 AG057557-01, Xu), NIH National Institute of Aging (1 R01 AG061388-01, Xu), NIH National Institute of Aging (1 R56 AG062272-01, Xu), American Cancer Society Research Scholar Grant (RSG-16-049-01 - MPC, Xu), The Pfizer 2015 ASPIRE Rheumatology and Dermatology Research Award (WI206753, Xu) and NIH Clinical and Translational Science Collaborative of Cleveland (1UL1TR002548-01, Konstan).
Conflict of Interest: none declared.
References
- Barabási A.-L. et al. (2011) Network medicine: a network-based approach to human disease. Nat. Rev. Genet., 12, 56.. [DOI] [PMC free article] [PubMed] [Google Scholar]
- Bleakley K., Yamanishi Y. (2009) Supervised prediction of drug–target interactions using bipartite local models. Bioinformatics, 25, 2397–2403. [DOI] [PMC free article] [PubMed] [Google Scholar]
- Campillos M. et al. (2008) Drug target identification using side-effect similarity. Science, 321, 263–266. [DOI] [PubMed] [Google Scholar]
- Chen X. et al. (2012) Drug–target interaction prediction by random walk on the heterogeneous network. Mol. BioSyst., 8, 1970–1978. [DOI] [PubMed] [Google Scholar]
- Chen X. et al. (2016) Drug–target interaction prediction: databases, web servers and computational models. Brief. Bioinf., 17, 696–712. [DOI] [PubMed] [Google Scholar]
- Chen Y., Xu R. (2015) Network-based gene prediction for plasmodium falciparum malaria towards genetics-based drug discovery. BMC Genomics, 16, S9.. [DOI] [PMC free article] [PubMed] [Google Scholar]
- Chen Y., Xu R. (2016a) Context-sensitive network-based disease genetics prediction and its implications in drug discovery. Bioinformatics, 33, 1031–1039. [DOI] [PMC free article] [PubMed] [Google Scholar]
- Chen Y., Xu R. (2016b) Phenome-based gene discovery provides information about parkinsons disease drug targets. BMC Genomics, 17, 493. [DOI] [PMC free article] [PubMed] [Google Scholar]
- Chen Y. et al. (2015) Phenome-driven disease genetics prediction toward drug discovery. Bioinformatics, 31, i276–i283. [DOI] [PMC free article] [PubMed] [Google Scholar]
- Chu L.-H., Chen B.-S. (2008) Construction of a cancer-perturbed protein–protein interaction network for discovery of apoptosis drug targets. BMC Syst. Biol., 2, 56.. [DOI] [PMC free article] [PubMed] [Google Scholar]
- Csermely P. et al. (2005) The efficiency of multi-target drugs: the network approach might help drug design. Trends Pharmacol. Sci., 26, 178–182. [DOI] [PubMed] [Google Scholar]
- Davis J., Goadrich M. (2006) The relationship between precision-recall and roc curves. In Proceedings of the 23rd international conference on Machine learning ACM, pp. 233–240.
- Davis J. et al. (2005) View learning for statistical relational learning: with an application to mammography. In IJCAI Citeseer, pp. 677–683.
- Gönen M. (2012) Predicting drug–target interactions from chemical and genomic kernels using bayesian matrix factorization. Bioinformatics, 28, 2304–2310. [DOI] [PubMed] [Google Scholar]
- Hopkins A.L. (2008) Network pharmacology: the next paradigm in drug discovery. Nat. Chem. Biol., 4, 682.. [DOI] [PubMed] [Google Scholar]
- Jacob L., Vert J.-P. (2008) Protein–ligand interaction prediction: an improved chemogenomics approach. Bioinformatics, 24, 2149–2156. [DOI] [PMC free article] [PubMed] [Google Scholar]
- Keiser M.J. et al. (2009) Predicting new molecular targets for known drugs. Nature, 462, 175.. [DOI] [PMC free article] [PubMed] [Google Scholar]
- Kuhn M. et al. (2016) The sider database of drugs and side effects. Nucleic Acids Res., 44, D1075–D1079. [DOI] [PMC free article] [PubMed] [Google Scholar]
- Law V. et al. (2014) Drugbank 4.0: shedding new light on drug metabolism. Nucleic Acids Res., 42, D1091–D1097. [DOI] [PMC free article] [PubMed] [Google Scholar]
- Li H. et al. (2006) Tarfisdock: a web server for identifying drug targets with docking approach. Nucleic Acids Res., 34, W219–W224. [DOI] [PMC free article] [PubMed] [Google Scholar]
- Li Y., Patra J.C. (2010) Genome-wide inferring gene–phenotype relationship by walking on the heterogeneous network. Bioinformatics, 26, 1219–1224. [DOI] [PubMed] [Google Scholar]
- Lu Y. et al. (2017) Link prediction in drug–target interactions network using similarity indices. BMC Bioinformatics, 18, 39. [DOI] [PMC free article] [PubMed] [Google Scholar]
- Luo H. et al. (2011) Drar-cpi: a server for identifying drug repositioning potential and adverse drug reactions via the chemical–protein interactome. Nucleic Acids Res., 39, W492–W498. [DOI] [PMC free article] [PubMed] [Google Scholar]
- Mohan V. et al. (2005) Docking: successes and challenges. Curr. Pharm. Des., 11, 323–333. [DOI] [PubMed] [Google Scholar]
- Montmayeur J.-P. et al. (1993) Preferential coupling between dopamine d2 receptors and g-proteins. Mol. Endocrinol., 7, 161–170. [DOI] [PubMed] [Google Scholar]
- Nagamine N., Sakakibara Y. (2007) Statistical prediction of protein–chemical interactions based on chemical structure and mass spectrometry data. Bioinformatics, 23, 2004–2012. [DOI] [PubMed] [Google Scholar]
- Nagamine N. et al. (2009) Integrating statistical predictions and experimental verifications for enhancing protein-chemical interaction predictions in virtual screening. PLoS Comput. Biol., 5, e1000397.. [DOI] [PMC free article] [PubMed] [Google Scholar]
- Navarrete F. et al. (2012) Pregabalin-and topiramate-mediated regulation of cognitive and motor impulsivity in dba/2 mice. Br. J. Pharmacol., 167, 183–195. [DOI] [PMC free article] [PubMed] [Google Scholar]
- Schjerning O. et al. (2018) Pregabalin for anxiety in patients with schizophrenia a randomized, double-blind placebo-controlled study. Schizophrenia Res., 195, 260–266. [DOI] [PubMed] [Google Scholar]
- Schütze H. et al. (2008) Introduction to Information Retrieval. Cambridge University Press, Cambridge. [Google Scholar]
- Shoichet B.K. et al. (2002) Lead discovery using molecular docking. Curr. Opin. Chem. Biol., 6, 439–446. [DOI] [PubMed] [Google Scholar]
- Szklarczyk D. et al. (2015) String v10: protein–protein interaction networks, integrated over the tree of life. Nucleic Acids Res., 43, D447–D452. [DOI] [PMC free article] [PubMed] [Google Scholar]
- Takarabe M. et al. (2012) Drug target prediction using adverse event report systems: a pharmacogenomic approach. Bioinformatics, 28, i611–i618. [DOI] [PMC free article] [PubMed] [Google Scholar]
- van Laarhoven T. et al. (2011) Gaussian interaction profile kernels for predicting drug–target interaction. Bioinformatics, 27, 3036–3043. [DOI] [PubMed] [Google Scholar]
- Whitebread S. et al. (2005) Keynote review: in vitro safety pharmacology profiling: an essential tool for successful drug development. Drug Disc. Today, 10, 1421–1433. [DOI] [PubMed] [Google Scholar]
- Wishart D.S. et al. (2006) Drugbank: a comprehensive resource for in silico drug discovery and exploration. Nucleic Acids Res., 34, D668–D672. [DOI] [PMC free article] [PubMed] [Google Scholar]
- Xia Z. et al. (2010) Semi-supervised drug–protein interaction prediction from heterogeneous biological spaces. BMC Syst. Biol., 4, S6. [DOI] [PMC free article] [PubMed] [Google Scholar]
- Xu R., Wang Q. (2014a) Automatic signal extraction, prioritizing and filtering approaches in detecting post-marketing cardiovascular events associated with targeted cancer drugs from the fda adverse event reporting system (faers). J. Biomed. Inf., 47, 171–177. [DOI] [PMC free article] [PubMed] [Google Scholar]
- Xu R., Wang Q. (2014b) Large-scale combining signals from both biomedical literature and the fda adverse event reporting system (faers) to improve post-marketing drug safety signal detection. BMC Bioinformatics, 15, 17. [DOI] [PMC free article] [PubMed] [Google Scholar]
- Xu R., Wang Q. (2015) Large-scale automatic extraction of side effects associated with targeted anticancer drugs from full-text oncological articles. J. Biomed. Inf., 55, 64–72. [DOI] [PMC free article] [PubMed] [Google Scholar]
- Yabuuchi H. et al. (2014) Analysis of multiple compound–protein interactions reveals novel bioactive molecules. Mol. Syst. Biol., 7, 472.. [DOI] [PMC free article] [PubMed] [Google Scholar]
- Yamanishi Y. et al. (2008) Prediction of drug–target interaction networks from the integration of chemical and genomic spaces. Bioinformatics, 24, i232–i240. [DOI] [PMC free article] [PubMed] [Google Scholar]


