

Abstract
Birefringence offers an intrinsic contrast mechanism related to the microstructure and arrangement of fibrillary tissue components. Here we present a reconstruction strategy to recover not only the scalar amount of birefringence but also its optic axis orientation as a function of depth in tissue from measurements with catheter-based polarization sensitive optical coherence tomography. A polarization symmetry constraint, intrinsic to imaging in the backscatter direction, facilitates the required compensation for wavelength-dependent transmission through system elements, the rotating catheter, and overlying tissue layers. Applied to intravascular imaging of coronary atherosclerosis in human patients, the optic axis affords refined interpretation of plaque architecture.
OCIS codes: (170.4500) Optical coherence tomography, (110.5405) Polarimetric imaging, (170.3010) Image reconstruction techniques, (170.3880) Medical and biological imaging
1. Introduction
Fibrous tissues are prevalent in nature and their directional fiber organization is critical to their physiological function. Many such tissues exhibit birefringence and cause a differential delay, or retardation, between light polarized parallel and orthogonal to the fibrillar tissue components. Assessing the birefringence and its optic axis orientation can furnish crucial insight into the make-up and the physical orientation of these tissue elements. A prominent method to assess tissue polarization effects is polarization-sensitive optical coherence tomography (PS-OCT), which measures the polarization state of light back-scattered in a tissue sample as a function of its path-length traveled into the sample [1-3]. Because OCT measures the round trip of light from the tissue surface to a given depth and back, the measured polarization states correspond to the cumulative effect of the transmission through all these tissue layers. The scalar amount of birefringence relates to the variation of the polarization states along depth and can be computed independently of the overlying tissue layers [4,5]. In contrast, reconstruction of the optic axis orientation requires careful compensation for all overlying tissue layers in order to obtain intelligible optic axis measurements, as demonstrated using free-space PS-OCT instruments by Todorovic et al. [6], and more recently by Fan et al. [7].
In fiber- and even more so in catheter-based OCT systems, transmission through the fiber and system components alters polarization states, hindering the reconstruction of depth-resolved optic axis maps. Moreover, many fiber-based components exhibit wavelength-dependent retardance, resulting in polarization mode dispersion (PMD), which limits the ability to obtain meaningful birefringence measurements [8] and can lead to birefringence artifacts [9]. We have previously developed spectral binning as a reconstruction strategy to mitigate these artifacts and obtain improved maps of scalar tissue birefringence [10]. This has enabled improved assessment of coronary atherosclerosis in human patients with intravascular OCT [11,12].
Here, we demonstrate depth-resolved optic axis imaging through a rotating intravascular catheter, compensating for the transmission through all system elements including correction for PMD. The reconstruction builds on the intrinsic symmetry present in polarization measurements performed with identical illumination and detection paths. It also leverages the linear birefringence induced by total internal reflection at the distal tip of the fiber probe, and uses the weak birefringence in the transparent sheath encapsulating the probe as a reference to render the relative optic axis measurements absolute. We present optic axis imaging in the coronary arteries of human patients and validate the method with phantom experiments.
2. Methods
OCT measures the round trip or double pass transmission through tissue. Estimating the effect on the polarization states of the forward transmission through an optical element based on the measurements of the double pass transmission is not possible in general. However, in the case of tissue, linear birefringence induced by the fibrillar geometry of many tissue building blocks dominates and exceeds the optical activity that may typically be present in biological samples. From the double pass transmission of a homogeneous linearly birefringent (and diattenuating) element, the single pass transmission can be obtained by taking its matrix root. The optic axis of a linear retarder lies in the QU-plane of the Poincaré sphere, and transmission in the reverse direction through the same polarization element is identical to the forward transmission, resulting in a specific matrix symmetry. However, a stack of differently oriented linear retarders corresponds to a general retarder without any symmetry. Yet, by virtue of the imaging geometry, its double pass transmission always appears as a linear element. Reconstructing the depth-resolved optic axis orientation from PS-OCT measurements relies on the assumption that the axial resolution is sufficient to resolve homogenously retarding tissue layers and estimate their forward transmission, one layer at a time [6,7].
Figure 1 outlines the necessary processing steps to retrieve depth-resolved optic axis orientation from measurements with our intravascular PS-OCT system and explains the catheter geometry. The goal is to reconstruct the optic axis orientation within the plane orthogonal to the imaging beam at each angular position of the fiber probe. Whereas the measurements are performed in a static laboratory frame, the optic axis orientation is expressed within the local coordinate system of the rotating probe beam, corresponding to the longitudinal and circumferential direction of the vessel lumen, respectively. We demonstrate the rich optic axis orientation contrast by processing in vivo measurements of coronary arteries previously acquired during a clinical pilot trial of intravascular polarimetry [11].
Fig. 1.
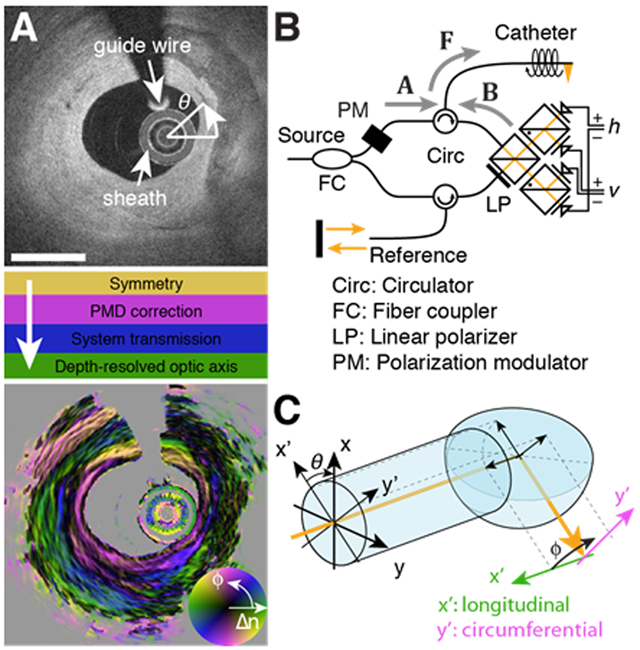
Processing steps, setup schematic, and imaging geometry for optic axis reconstruction. A) Cross-section of conventional backscatter signal in the right coronary artery of a human patient, and required processing steps to obtain the optic axis orientation map, with color indicating axis orientation (ϕ), and brightness specifying birefringence (Δn). Scale bar: 1mm. B) Schematic of the polarization-modulated PS-OCT system. C) At the catheter tip, total internal reflection directs the probing beam into the tissue, mapping the local coordinates of longitudinal and circumferential direction into the static laboratory frame.
A. Experimental methods
All imaging was performed with a custom-built polarization sensitive optical frequency domain imaging console, as described previously [11]. In short, the system operated at a center wavelength of 1300 nm with a repetition rate of 103.6 kHz and with a wavelength scanning range of 110 nm, corresponding to a depth resolution of 9.4 μm in tissue, assuming a refractive index of 1.34. The system employed a polarization modulation scheme, whereby the source polarization state was alternated for subsequent A-lines between two states located orthogonal to each other on the Poincaré sphere. The polarization diverse receiver measured both the horizontal (h) and vertical (v) polarization components of the sample light for polarization sensitive detection. The imaging console interfaced with commercial intravascular catheters (FastView, Terumo), rotating with 100 revolutions per second, acquiring 1024 depth scans in each frame, and featuring a lateral resolution of ~35μm. Clinical imaging used a pullback speed of 20 mm/s, during injection of non-ionic contrast solution at a rate of 1–3 mL/s. From the 36 coronary arteries imaged in 30 patients, we identified 344 independent cross-sections of varying lesion architecture that we used to evaluate the robustness of the individual processing steps.
B. Reconstruction of optic axis orientation
All processing steps were implemented in Matlab 2017b (Mathworks Inc., Natick, MA) and processed with a 2.9 GHz Intel Core i7 processor and 16 GB of RAM.
1. Signal formalism
The two input polarization states, u1,2, probed the Jones matrix Jtot, describing the sequential transmission through system components, the sample, and the detection optics. Measured at each wavenumber and at each angular orientation θ of the illumination beam, the complex-valued interference signal can be written as:
| (1) |
Throughout this manuscript, bold letters in lower case designate vectors and capital bold letters designate matrices. We used spectral binning [10] to reconstruct Jones vectors as a function of depth, z, and spectral bin, m:
| (2) |
where w(k, m) is a Hanning window of width Δk/N centered at mΔk/(2N) within the available k-support, Δk, m∈[1, 2N−1], N = 5, and θ is suppressed for improved readability. The complex-valued Jones vectors were then converted to Stokes vectors and filtered in the lateral direction with a Gaussian kernel of full width at half maximum (fwhm) of 6 A-lines:
| (3) |
where <> indicates lateral filtering, the overbar corresponds to the complex conjugate, the subscript p indicates the input polarization state, t = [th tv]T, and ŝ is the normalized Stokes vector in the three-dimensional Poincaré space with coordinates Q, U, and V. All variables are functions of depth, spectral bin, and angular orientation.
The average of the degree of polarization (DOP) across all spectral bins and input polarization states served as a measure of depolarization [13] to judge the reliability of the measured polarization states:
| (4) |
Areas with a DOP ≤ 0.7 were excluded from any further polarization processing.
The 3×3 matrix M(z, m), belonging to the special orthogonal group, or rotation group, SO(3), that best describes the measured transmission through the combined system and sample components was then constructed by orthogonalizing the normalized Stokes vectors:
| (5) |
where
| (6) |
A SO(3) rotation matrix describes a rigid body rotation in a three-dimensional space and is entirely characterized by a rotation vector w = [wQ wU wV]T, with its direction defining the rotation axis (eigenvector corresponding to a unitary eigenvalue) and its length expressing the rotation angle, corresponding to the optic axis and the retardance in case of a retardation matrix, respectively. In the following, we refer to a linear retarder as a retarder matrix with a rotation or retardation vector confined to the QU-plane, and a circular retarder as a matrix with a retardation vector aligned along V.
The recovered transmission matrix M(z, m) can be described by
| (7) |
A and B characterize the transmissions through optical system components in the separate illumination and detection paths, with B corresponding to the reverse transmission to obtain a more symmetric expression (7), as indicated in Fig. 1B. A and B are assumed to be independent of the wavenumber within each bin, but to vary between spectral bins due to PMD. F describes the transmission through the symmetric part of the system that the light traverses both on the illumination and detection path, including the rotating catheter, and is assumed free of PMD. S(z) = Nn·…·N2·N1 is the single pass transmission from the sample surface to depth z = n·δz, where the sample is modeled as consisting of individual layers Nn, with locally constant polarization properties, and a thickness corresponding to one axial depth pixel δz. D·ST(z)·D is the reverse transmission from depth z to the sample surface, where D = diag([1,1,−1]) with D·D the identity matrix [14]. This corresponds to the transpose in Jones formalism and follows the convention to use a left-handed coordinate system on the reverse path [15]. Each Nn is presumed to act as a linear retarder, which makes them D-transpose symmetric Nn = D·NnT·D, and the goal is to characterize each layer D·NnT·D·Nn = Nn·Nn.
2. Recovering symmetry
The presence of distinct illumination and detection components A and B breaks the symmetry intrinsic to measurements along identical illumination and detection paths [15,16]. The symmetry can be recovered by left-multiplying with a correction matrix C = D·AT·BT−1·D, as demonstrated in Fig. 2. Estimating C can be cast as a quadratic problem that minimizes the non-symmetric signal components. Reverting to SU(2) and writing J(z, m) instead of M(z, m), and CJ for C, the correction matrix minimizes the following Frobenius norm
| (8) |
subject to det(CJ) = 1. The sum was taken over all sample locations within a cross-section with DOP>0.7. Expression (8) can be rewritten as
| (9) |
where j = [J11 J12 J21 J22]T and c = [ −CJ,21 CJ,11 −CJ,22 CJ,12 ]T are the lexicographically ordered sample and correction Jones matrices, respectively. H corresponds to the H-matrix and can be directly obtained from M [17,18], removing any ambiguity related to the global phase of the Jones matrices. Due to the intrinsic symmetry imposed by measuring in the backscatter direction, the H-matrix should, theoretically, have rank(H) = 3, and the solution to the minimization would be obtained by aligning the complex conjugate of c with its nullspace. In practice, the presence of noise results in finite eigenvalues, and c aligns with the smallest eigenvalue of H. c corresponds to a general retarder and Fig. 2B displays the Q, U, and V-components of its retardation vector.
Fig. 2.
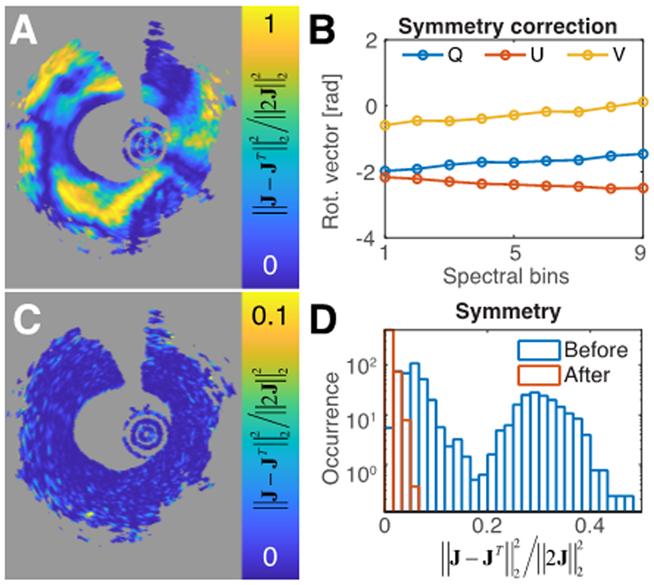
Polarization measurements are intrinsically symmetric. A) Original anti-symmetric measurement components for the central spectral bin. B) Obtained correction retardation vectors as a function of the spectral bin. C) Anti-symmetric measurement components for the central spectral bin after applying the correction matrix. D) Histograms of average anti-symmetric components before and after correction for a total of 344 independent cross-sections.
A perfectly D-transpose symmetric SO(3) matrix exhibits only linear retardation, and its eigenvector lies in the QU-plane. After applying C to M(z, m), we enforced strict symmetry by setting the residual V-components of its retardation vectors to zero (see supplementary content for detailed derivations), to obtain
| (10) |
3. Compensating for wavelength dependence of system elements
The difference between the spectral bins of M’(z, m) is attributed to A(m). In order to align all bins to the central bin q, we first matched the cumulative retardation by minimizing
| (11) |
where L is a linear retarder. This problem was solved using a standard nonlinear programming solver in Matlab. In order to speed up the processing, only a random subset of one pixel per depth scan with DOP>0.7 was used in the optimization procedure. After obtaining L, an additional circular retarder V was computed to average out the mean angle between the L-corrected optic axes of each bin with the central bin. The combined correction matrix L·V, and its D-transpose were then applied on the right and left hand side of M’(z, m), respectively, for each spectral bin, to obtain M’’(z, m) = V−1·L·M’(z, m)·L·V, where the fact that the D-transpose of a circular retarder is its inverse has been used. These processing steps are visualized in Fig. 3.
Fig. 3.
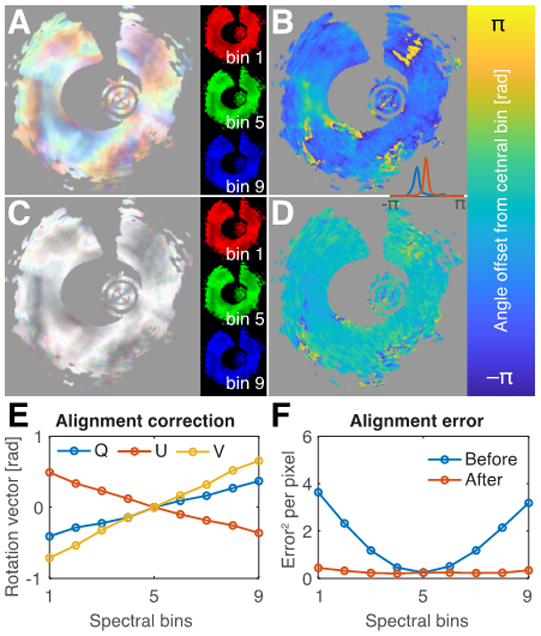
Correction for polarization mode dispersion (PMD). A) Cumulative retardation of the symmetric measurement matrices of the indicated spectral bins in RGB-color overlay. B) Angle between cumulative optic axis of the first and central spectral bin. C) After PMD-correction, the variation between spectral bins is removed, and the angle offset is compensated (D). Inset between B and D shows histograms of the angle offset before (blue) and after (red) compensation. E) Retardation vector of the correction matrix L·V as a function of the spectral bin. F) Mean squared difference of the retardation matrices in each spectral bin with their aligned and averaged version for 344 independent cross-sections, before and after alignment.
To compute the Euclidean mean across the spectral bins, the arithmetic mean of the SO(3) matrices was decomposed into M, the average retarding element, and P, a symmetric, positive-semidefinite matrix corresponding to a depolarizer [19,20]:
| (12) |
where P2 = <M’’>T·<M’’>. To avoid the computationally demanding matrix eigenvalue decomposition required for finding P, we followed Smith et al. [21], and used the Caley-Hamilton theorem, to directly compute the eigenvalues and eigenvectors of P2, and to retrieve M:
| (13) |
where A = A(q) and thus the wavelength-dependence of the system components is eliminated.
4. System and catheter transmission
We modeled the system and catheter transmission and compared it to the measured double pass transmission, obtained by isolating the signal reflected at the ball lens or the inner surface of the catheter sheath where S(z) corresponds to the identity matrix:
| (14) |
A = AV·AL describes the remaining static elements and is decomposed into a circular and a linear retarder. The distal end of the probe was modeled as T = TV·TQ·(TV)−1, with TQ a linear retarder aligned along Q and TV a circular retarder. T is aligned with the Q-axis when dominated by the retardance of the total internal reflection, in which case TV approaches the identity matrix. In general, additional catheter retardation rotates T within the QU-plane by the retardance of TV. W is the circular retarder corresponding to the catheter rotation, absorbing also the circular components AV and TV. We then solved the least square problem of fitting Mcath to M(zcath) (see supplementary information) to obtain AL, TQ and W. To ensure that the correction matrices cancel all retardation at the sheath interface, rather than using the fitted TQ, we used:
| (15) |
to isolate the sample signal M(z, θ):
| (16) |
This compensated the system and catheter transmission with the exception of the rotation TV, which was finally estimated by using the weak retardation of the catheter sheath as a guide star. The sheath birefringence is imprinted on the signal from the tissue surface, which provides a significantly stronger reflection signal than the weak reflection of the outside of the sheath. Observing the cumulative retardation vector of the surface signal allowed adjusting the residual offset angle defining TV, illustrated in Fig. 4.
Fig. 4.
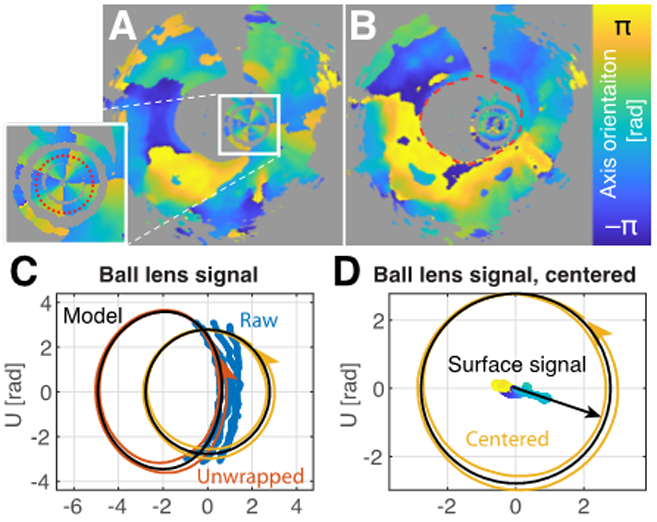
Estimation of system and catheter transmission. A) Cumulative optic axis map, indicating the reflection signal on the inner side of the catheter sheath. B) Cumulative optic axis map after compensation for system and catheter transmission, indicating the surface axis orientation. C) Cumulative optic axes of the double pass transmission through the catheter. The blue points indicate the original measurements. The red line corresponds to unwrapped and filtered data points. Removal of the static component isolates the catheter transmission (yellow line). D) Centered catheter transmission, and compensated axis orientation of the tissue surface (color encodes axis orientation), together with fitted reference orientation (offset angle).
5. Reconstructing depth-resolved optic axis orientation
To obtain the depth-resolved optic axis orientation, the effect of each tissue layer on the subsequent layers needs to be considered. Due to the D-transpose symmetry of the linearly birefringent tissue layers, the isolated sample signal M’n= M’(n·δz) for each depth is described by:
| (17) |
The forward transmission to layer n, Sn = Nn·…·N2·N1, corresponds to a general retarder, with both circular and linear retarding contributions, and its cumulative effect has to be compensated on all subsequent layers in a recursive fashion, as demonstrated by Fan et al. [7]:
| (18) |
For computation of the forward transmission Sn, only sample matrices M’n with a DOP>0.8 were considered. The depth-resolved optic axis orientation and birefringence were then extracted from the individual Nn matrices. Finally, the obtained retardation vectors were axially filtered with a rectangular filter of 5 axial pixels in width (21 μm).
3. Results
A. Measurements are intrinsically symmetric
In the case of fiber and catheter-based PS-OCT systems, the presence of fiber-based elements exclusively in the illumination or detection path breaks the symmetry intrinsic to double-pass measurements. Comparing the off-diagonal elements of the Jones matrices reconstructed from intravascular PS-OCT measurements in the coronary artery of a human patient indeed reveals the presence of substantial amounts of energy in the asymmetric components, although they strongly vary with catheter rotation (Fig. 2A). Because the symmetry-breaking elements are static, they can be efficiently and accurately estimated. Correcting for their effect dramatically reduced the energy in the asymmetric elements (Fig. 2C). To accommodate for the presence of wavelength-dependence, or PMD, in the system components, the correction was performed independently for various spectral bins (Fig. 2B). To validate the robustness of recovering the intrinsic symmetry, we processed 344 independent coronary artery cross-sections, imaged in a total of 30 patients. Whereas the original amount of energy in the asymmetric components varied greatly across this set of cross-sections, after correction it was reduced to an average value of 1.1%, integrating over all points within the cross-section that feature sufficient DOP>0.7 (Fig. 2D). This convincingly demonstrates the intrinsic symmetry present in the measured data and the ability to reliably recover it. This symmetry is an important reduction in dimensionality, and is essential for the further estimation of system elements and the reconstruction of the depth-resolved birefringence properties.
B. Correction for wavelength-dependence
Although the symmetrization removed part of the wavelength-dependence of the system components, the symmetric measurements remained impacted by PMD. Comparing the cumulative retardance of the first, middle, and last spectral bin in Fig. 3A reveals a noticeable discrepancy, introduced by the spectral dependence of system components. The angle between the (linear) cumulative optic axes of the first and the central bin further highlights an angular offset within the QU-plane (Fig. 3B). Owing to the established symmetry of the measurements, estimating the difference in the system components from the central bin becomes a tractable optimization problem. As presented in Figs. 3C and D, the signal of the various spectral bins could be accurately aligned. The correction terms exhibit close to linear variation across the spectrum (Fig. 3E). Correction for the wavelength-dependence of system components worked reliably on all evaluated cross-sections (Fig. 3F) and resulted in an average discrepancy of only 0.277, evaluated as the squared Frobenius norm of the difference between the rotation matrices of the various spectral bins and the central bin, and averaged across each of the 344 cross-sections in areas with DOP>0.7. This corresponds to an average retardation of 0.37 rad.
Once the spectral bins were aligned to depict identical sample information, they were averaged, which benefited the accuracy of the polarization measurements. The data then appeared to originate from measurements with a perfectly symmetric system, devoid of any wavelength-dependent polarization effects in the system components.
C. System and catheter compensation
The remaining system transmission contained both static elements and the spinning catheter. The signal from the ball lens or the interface at the inside of the catheter sheath, which provide prominent reflections at the tip of the catheter, reveals the double pass transmission through these elements and describes a periodic evolution in the QU-plane, if properly unwrapped (Fig. 4). Because the angle in the QU-plane is twice the physical angle between linear polarization states, a single catheter rotation traces out a double circle in the QU-plane.
At the probe tip, total internal reflection directs the probing beam through the ball-lens interface and the transparent sheath into the tissue, where we used the longitudinal and azimuthal directions as the local reference frame (Fig. 1E). The catheter transmission corresponds to the transformation from the static laboratory frame into the rotating reference frame of the proximal end of the catheter, equivalent to a circular retarder with linearly increasing retardance. Due to the Fresnel coefficients, the total internal reflection acts as a linear retarder. However, static stress in the fiber probe may contribute additional retardance. Owing to the combined forward and backward transmission, the overall appearance is that of a linear retarder, rotating around an apparent center in the QU-plane defined by the remaining static system components. It was thus possible to independently estimate the transmission through the static elements and the rotating catheter and correct for their effect on the tissue signal. Even so, there remained a common global angular offset in the absolute orientation of the recovered cumulative tissue retardation vectors within the QU-plane.
To also estimate this offset angle and obtain absolute optic axis orientations, we used the birefringence of the catheter sheath, similar to Adams et al. [22]. Manufactured by extrusion, the polyethylene sheaths exhibit weak birefringence, presumably due to a combination of flow-induced polymer-chain alignment and cooling-induced stress birefringence. The optic axis induced by both of these effects is aligned longitudinally or circumferentially to the catheter, corresponding to a straight line in the Poincaré sphere, and defines a convenient reference, as illustrated in Fig. 4D.
Whereas the previous correction steps worked robustly and reliably on all evaluated cross-sections, the estimation of the catheter transmission depends on a catheter evolution that is free of non-uniform rotational distortions, which can dynamically induce additional shear stress. Two thirds of the cross-sections resulted in a ball-fitting error equivalent to a retardation error smaller than 0.4 rad, which is the residual error obtained during PMD compensation, and generated credible optic axis maps. However, larger distortions can result in impaired optic axis maps, and would require improved strategies for estimating the catheter transmission. Conveniently, the fitting error of the catheter-transmission signal identifies questionable optic axis maps.
D. Optic axis imaging in coronary arteries
After the sequential corrections of the previous processing steps, we recovered the retardation matrices equivalent to a measurement performed in free space in the local sample coordinates. This enabled retrieval of the local, depth-resolved birefringence Δn, and optic axis orientation, ϕ, following the recursive procedure of Fan et al. [7]. Advancing layer by layer, the linear retardation vector of each layer was recovered, and its orientation within the QU plane was corrected with the cumulative effect of all overlying layers. Only layers with a DOP>0.8 were considered in computing the cumulative correction signal in order to avoid the detrimental impact of random retardation in signal-void or depolarized regions. Fig. 5 shows typical optic axis orientations in coronary artery cross-sections of four patients. The optic axis is mapped using a periodic color map [23] to indicate the physical direction of the optic axis orientation. There is a π-ambiguity, since polarization has no directionality. The brightness of the color is adjusted by the amount of birefringence to mask areas of low birefringence with ill-defined optic axis orientation. Regions with DOP<0.8 are grayed out.
Fig. 5.
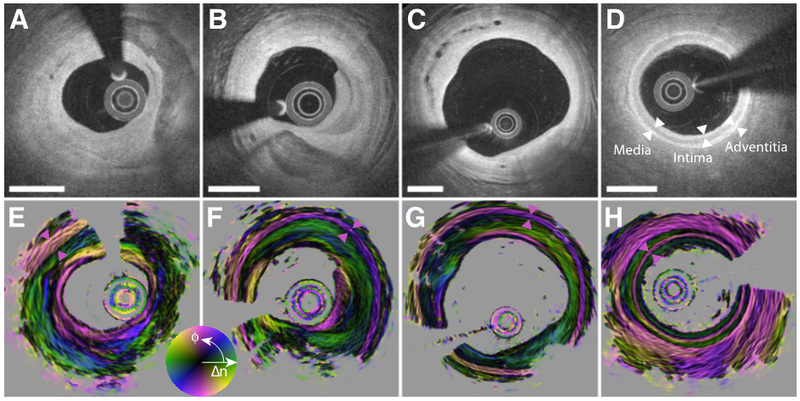
Depth-resolved optic axis maps in the coronary arteries of human patients. A) and E) Right coronary artery of 69-year-old man presenting with unstable angina. B) and F) Right coronary artery of 73-year-old man with stable angina. C) and G) Right coronary artery of 69-year-old man with stable angina. D) and H) Left anterior descending coronary artery in 61-year-old man with stable angina. The three layers of the coronary arterial wall are indicated with white arrowheads in D). The media layer is highlighted in E)-H) with purple arrowheads. Scale bars: 1 mm.
Fig. 5A shows a cross-section of the right coronary artery in a 69-year-old male patient who presented with unstable angina. The conventional backscatter signal reveals a fibrotic lesion with a large calcification. The orientation map reveals distinct tissue layers within the homogeneously scattering fibrous tissue areas. With the aid of the optic axis orientation, it is possible to identify the media layer in the short segment from 10 to 11 o’clock, which exhibits a circumferential orientation, consistent with the orientation of the densely aligned smooth muscle in this layer [11]. The bulk of the fibrous tissue appears longitudinally aligned. Interestingly, the most intimal tissue layer features again circumferential orientation, strongly contrasting it from the subsequent layer. In comparison, the entire intimal region results in a uniform backscatter signal.
The second example in Fig. 5B from the right coronary artery of a 73-year-old male patient with stable angina depicts very similar features. The tunica media is clearly visible in the entire cross-section, except behind the calcification from 4 to 8 o’clock. The innermost layer from 3 to 6 o’clock exhibits a very distinct circumferential orientation. The atherosclerotic plaque in Fig. 5C, imaged in the right coronary artery of a 69-year-old male patient with stable angina is less stenotic, but features distinct neovascularization. The most intimal layer at 9 o’clock and from 11 to 2 o’clock shows distinct circumferential orientation, contrasting with the longitudinal orientation of the majority of the intimal area. The vessel in Fig. 5D has minimal features of disease, but instead of the typical adipose-rich peri-adventitial tissue, it is embedded in a homogenously scattering tissue with high birefringence and circumferential optic axis orientation, similar to that of the tunica media.
E. Validation with birefringence phantom
To validate the reconstruction of depth-resolved optic axis orientation and compare the computed orientation maps to a known orientation, we assembled a two-layer birefringence phantom, consisting of stretched ribbons cut from a scattering polycarbonate film [24]. Held together at different relative angles ranging from −90° to 90° in steps of 22.5°, both layers were rotated together in steps of 22.5° over a total angle of 180°, yielding a total of 81 distinct combinations of axis orientations. The reconstructed optic axis maps appear very homogeneous and quantitative evaluation of the axis orientation in a central region of interest demonstrates the accurate recovery of the orientation for both layers, independent of each other, as demonstrated in Fig. 6.
Fig. 6.
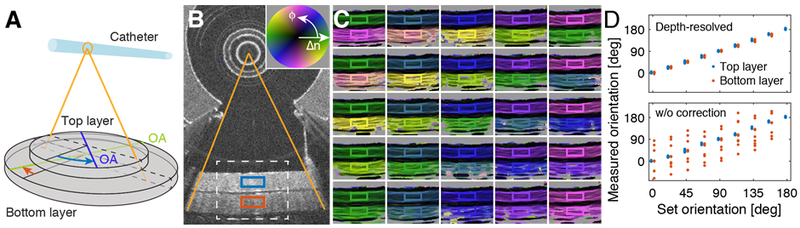
Validation of optic axis mapping with two-layer birefringence phantom. A) Schematic drawing of the phantom. The optic axis (OA) orientation of both the top and the bottom layer was varied over 180° in steps of 22.5°. B) Conventional OCT cross-section depicting the two layers. The white dashed line indicates the region visualized in C) for the various optic axis orientations. The red and blue rectangles indicate the region of interest (ROI) used for quantitative evaluation of the axis orientation. C) Color-coded optic axis maps for selected axis orientations. The color of the ROI frame corresponds to the set angle orientation. D) Quantitative evaluation of optic axis orientation within the ROIs when correcting for depth-resolved optic axis orientation (top panel), and without this correction step (w/o correction; bottom panel). The two traces are offset in the horizontal direction by 4° for visualization.
Supplementary Fig. S1 presents the axis maps for all angle orientations, and Fig. S2 displays the maps that result when the last processing step that corrects for overlying tissue layers is ignored, instead evaluating the apparent optic axis orientation by computing (M’n−1)−1/2·M’n·(M’n−1)−1/2. Using the square root of the cumulative matrix of the previous layers on each side results in a linear retarder, albeit with an imprecise orientation. Fig. 6D shows that the orientation of the first layer remains mostly unaltered in this case, whereas the optic axis orientation of the second layer is substantially distorted, and results in orientations far from the true orientation angle. This clearly illustrates the necessity for accurate depth-correction in order to properly interpret the optic axis orientation in a sample consisting of multiple layers.
4. Discussion
Tissues with a fibrillar architecture exhibit birefringence through a combination of birefringence on the molecular level and form birefringence induced by the regular arrangement of individual fibrils on a sub-resolution scale. While the scalar amount of birefringence simply indicates their presence, the optic axis orientation reveals the physical orientation of the fibrillar tissue elements. Our processing strategy enables the recovery of the optic axis orientation at each depth in the tissue from measurements with catheter-based OCT for the first time. Depth-resolved optic axis mapping has previously been performed with PS-OCT, but only in bench-top systems having illumination and collection paths that preserve the polarization states of the illumination and the scattered light.
Optic axis imaging of atherosclerotic plaques in the coronary arteries of human patients clearly revealed distinct tissue layers that appear continuous in conventional tomograms and that also feature remarkably uniform scalar birefringence. Collagen is the primary source of birefringence in the intimal layer of fibrous plaques [11,25], and plays a crucial role in the pathophysiology of atherosclerosis. We found that areas of minimal disease feature a longitudinal optic axis orientation, consistent with previous reports using polarized light microscopy [26]. In contrast, the smooth muscle cells in the tunica media align circumferentially.
The distinct intimal layers with circumferential orientation may correspond to areas of healed plaque rupture or organized thrombus, where the wound healing response lead to a distinct orientation of the deposited collagen. This signature could help to improve our mechanistic understanding of plaque progression, which is known to be associated with silent rupture and subsequent healing [27,28].
Although birefringence offers meaningful intrinsic contrast, it has to be interpreted in the context of the specific tissue being imaged. The observed birefringence is the combined effect of the various tissue elements and depends on their quantity, physical arrangement and intrinsic polarization properties. Owing to the fibrillar nature of the constituting elements, tissue locally acts as a linear retarder and defines a slow and fast eigenpolarization state, parallel and orthogonal to the fiber direction, respectively, in case of positively birefringent collagen and muscle [29]. Yet, only the component of the optic axis orthogonal to the probing beam can be measured. The birefringence of fibrils that are oriented outside this plane will be underestimated, and retrieving the full three dimensional optic axis orientation would require additional measurements at different probing beam angles [30,31].
The specific implementation of PS-OCT used in this work assumes absence of diattenuation in the system and throughout the sample. Because two input polarization states are used consecutively, limited phase stability and the continued rotation of the catheter prevent coherent interpretation of the measurements that would be required to obtain the full Jones matrix including retardation and diattenuation. Instead, the measurements are directly converted to Stokes space, spatially averaged to improve their accuracy and to remove speckle noise, and then used to retrieve the retardation matrix that best explains these measurements in the least squares sense [10]. With measurements of the full Jones matrix, it would also become possible to recover the loss of axial resolution due to spectral binning [32].
Without specific efforts to speed up the processing, reconstructing a cross-sectional image consisting of 1024 depth scans took 8.4 s with a 2.9 GHz CPU. Except for the catheter transmission, all correction terms are computed for an entire cross-section, which makes the underlying optimization problem largely overdetermined. Accordingly, for the compensation of the wavelength dependence, computation can be alleviated by considering only a subset of points, without noticeably impacting the accuracy of the result. Correction terms for the symmetrization and the wavelength-dependence do not change within a pullback and could be recycled between cross-sections to accelerate processing. Implementation on a GPU would offer additional reduction of the reconsruction time to approach real-time processing.
The key to reconstructing the depth-resolved optic axis orientation from catheter-based PS-OCT measurements is to recover the intrinsic symmetry expected in measurements performed in the backscattering direction. Although this symmetry has implicitly been assumed in previous free space PS-OCT work [6,7], this report is the first to investigate it in detail [33]. The symmetry enables correction for system PMD and estimation of the system component transmission without assumptions on the sample birefringence. PMD manifested only in the static fiber components in the illumination and detection arms but was absent from the catheter and sample signal. This allowed averaging the cumulative retardation matrices among the spectral bins before recovery of the catheter transmission. The symmetrization and PMD-compensation can be applied blindly on any data set, as long as the system transmission features some amount of retardation. For bench-top imaging, where the sample fiber remains static, these first processing steps suffice to retrieve the depth-resolved relative optic axis orientation, as the remaining system transmission can be estimated from the surface reflection signal, up to an unknown circular retarder. However, to recover the transmission through the rotating catheter, we rely on its retardation. The intravascular catheters employed in this work use total internal reflection at the probe tip, which conveniently generates a suitable amount of retardance. We further used the birefringence properties of the sheath to render the optic axis orientation absolute.
Adams et al. previously used the sheath birefringence and reconstruction of the apparent (i.e. uncorrected) optic axis orientation for imaging of airway in animals and humans [22]. Assessing the alignment of the apparent optic axis of the airway wall with the optic axis of the sheath enabled accurate quantification of airway smooth muscle in vivo and opened the unique opportunity to research its role in diseases of the airway. The orthogonal alignment of smooth muscle (circumferential) and cartilage (longitudinal), which corresponds to collinear optic axes with opposite directions, likely limited the generally detrimental impact of the overlying tissue layers on the apparent optic axis in that work. The rigorous reconstruction of the depth-resolved optic axis presented in the current manuscript no longer requires assumptions on the sample structure and offers a general framework for optic axis imaging.
4. Conclusion
Propagation of light through single mode fiber, fiber-based components, and spinning catheters impacts the transmitted polarization states. Our experimental results demonstrate that it is possible to accurately estimate this transmission and correct for its impact on the tissue measurements. Illumination and detection through the identical optical path imposes a strict symmetry on the measurements, which can readily be recovered and reduces the dimensionality of the further correction steps. This makes depth-resolved optic axis imaging through a catheter possible. Optic axis orientation in coronary atherosclerotic lesions of human patients revealed an elaborate variation in their collagen organization, imperceptible to conventional OCT or scalar birefringence imaging. Disease often corresponds to a disruption in the normal tissue organization, which makes this intrinsic contrast mechanism potentially relevant in many clinical and pre-clinical applications of fiber and catheter-based OCT.
Supplementary Material
Acknowledgments
Funding. National Institutes of Health (P41EB-015903, R01HL-119065); Terumo Corporation.
Footnotes
See Supplement 1 for supporting content.
REFERENCES
- 1.Hee MR, Huang D, Swanson EA, and Fujimoto JG, “Polarization-sensitive low-coherence reflectometer for birefringence characterization and ranging,” J. Opt. Soc. Am. B 9, 903–908 (1992). [Google Scholar]
- 2.deBoer JF, Milner TE, vanGemert MJC, and Nelson JS, “Two-dimensional birefringence imaging in biological tissue by polarization-sensitive optical coherence tomography,” Optics Letters 22, 934–936 (1997). [DOI] [PubMed] [Google Scholar]
- 3.de Boer JF, Hitzenberger CK, and Yasuno Y, “Polarization sensitive optical coherence tomography - a review [Invited],” Biomed. Opt. Express 8, 1838–1873 (2017). [DOI] [PMC free article] [PubMed] [Google Scholar]
- 4.Guo SG, Zhang J, Wang L, Nelson JS, and Chen ZP, “Depth-resolved birefringence and differential optical axis orientation measurements with fiber-based polarization-sensitive optical coherence tomography,” Optics Letters 29, 2025–2027 (2004). [DOI] [PubMed] [Google Scholar]
- 5.Makita S, Yamanari M, and Yasuno Y, “Generalized Jones matrix optical coherence tomography: performance and local birefringence imaging,” Opt Express 18, 854–876 (2010). [DOI] [PubMed] [Google Scholar]
- 6.Todorovic M, Jiao SL, and Wang LV, “Determination of local polarization properties of biological samples in the presence of diattenuation by use of Mueller optical coherence tomography,” Optics Letters 29, 2402–2404 (2004). [DOI] [PubMed] [Google Scholar]
- 7.Fan C and Yao G, “Imaging myocardial fiber orientation using polarization sensitive optical coherence tomography,” Biomed. Opt. Express 4, 460–465 (2013). [DOI] [PMC free article] [PubMed] [Google Scholar]
- 8.Zhang EZ and Vakoc BJ, “Polarimetry noise in fiber-based optical coherence tomography instrumentation,” Optics Express 19, 16830–16842 (2011). [DOI] [PMC free article] [PubMed] [Google Scholar]
- 9.Villiger M, Zhang EZ, Nadkarni S, Oh W-Y, Bouma BE, and Vakoc BJ, “Artifacts in polarization-sensitive optical coherence tomography caused by polarization mode dispersion,” Optics Letters 38, 923–925 (2013). [DOI] [PMC free article] [PubMed] [Google Scholar]
- 10.Villiger M, Zhang EZ, Nadkarni SK, Oh W-Y, Vakoc BJ, and Bouma BE, “Spectral binning for mitigation of polarization mode dispersion artifacts in catheter-based optical frequency domain imaging,” Optics Express 21, 16353–16369 (2013). [DOI] [PMC free article] [PubMed] [Google Scholar]
- 11.Villiger M, Otsuka K, Karanasos A, Doradla P, Ren J, Lippok N, Shishkov M, Daemen J, Diletti R, van Geuns R-J, Zijlstra F, van Soest G, Libby P, Regar E, Nadkarni SK, and Bouma BE, “Coronary Plaque Microstructure and Composition Modify Optical Polarization: A New Endogenous Contrast Mechanism for Optical Frequency Domain Imaging,” J ACC Cardiovasc. Imaging (2017). doi: 10.1016/j.jcmg.2017.09.023 [DOI] [PMC free article] [PubMed] [Google Scholar]
- 12.Villiger M, Otsuka K, Karanasos A, Doradla P, Ren J, Lippok N, Shishkov M, Daemen J, Diletti R, van Geuns R-J, Zijlstra F, Dijkstra J, van Soest G, Regar E, Nadkarni SK, and Bouma BE, “Repeatability Assessment of Intravascular Polarimetry in Patients,” IEEE Trans Med Imaging 37, 1618–1625 (2018). [DOI] [PMC free article] [PubMed] [Google Scholar]
- 13.Lippok N, Villiger M, and Bouma BE, “Degree of polarization (uniformity) and depolarization index: unambiguous depolarization contrast for optical coherence tomography,” Optics Letters 40, 3954–3957 (2015). [DOI] [PMC free article] [PubMed] [Google Scholar]
- 14.Gil JJ, “Polarimetric characterization of light and media,” Eur. Phys. J. Appl. Phys. 40, 1–47 (2007). [Google Scholar]
- 15.Cloude SR and Pottier E, “Concept of polarization entropy in optical scattering,” Opt. Eng 34, 1599–1610 (1995). [Google Scholar]
- 16.Jiao S and Wang LV, “Jones-matrix imaging of biological tissues with quadruple-channel optical coherence tomography,” J. Biomed. Opt. 7, 350–358 (2002). [DOI] [PubMed] [Google Scholar]
- 17.Simon R, “The connection between Mueller and Jones matrices of polarization optics,” Optics Communications 42, 293–297 (1982). [Google Scholar]
- 18.Simon BN, Simon S, Mukunda N, Gori F, Santarsiero M, Borghi R, and Simon R, “A complete characterization of pre-Mueller and Mueller matrices in polarization optics,” J. Opt. Soc. Am. A 27, 188–199 (2010). [DOI] [PubMed] [Google Scholar]
- 19.Moakher M, “Means and averaging in the group of rotations,” SIAM J. Matrix Anal. & Appl. 24, 1–16 (2002). [Google Scholar]
- 20.Sharf I, Wolf A, and Rubin MB, “Arithmetic and geometric solutions for average rigid-body rotation,” Mechanism and Machine Theory 45, 1239–1251 (2010). [Google Scholar]
- 21.Smith OK, “Eigenvalues of a symmetric 3 × 3 matrix,” Commun. ACM 4, 168 (1961). [Google Scholar]
- 22.Adams DC, Hariri LP, Miller AJ, Wang Y, Cho JL, Villiger M, Holz JA, Szabari MV, Hamilos DL, Scott Harris R, Griffith JW, Bouma BE, Luster AD, Medoff BD, and Suter MJ, “Birefringence microscopy platform for assessing airway smooth muscle structure and function in vivo,” Science Translational Medicine 8, 359ra131 (2016). [DOI] [PMC free article] [PubMed] [Google Scholar]
- 23.Kovesi P, “Good colour maps: How to design them. CoRR, abs/1509.03700,” arXiv preprint physics/0412096 (2015). [Google Scholar]
- 24.Liu X, Beaudette K, Wang X, Liu L, Bouma BE, and Villiger M, “Tissue-like phantoms for quantitative birefringence imaging,” Biomed. Opt. Express 8, 4454 (2017). [DOI] [PMC free article] [PubMed] [Google Scholar]
- 25.Nadkarni SK, Pierce MC, Park BH, de Boer JF, Whittaker P, Bouma BE, Bressner JE, Halpern E, Houser SL, and Tearney GJ, “Measurement of collagen and smooth muscle cell content in atherosclerotic plaques using polarization-sensitive optical coherence tomography,” J. Am. Coll. Cardiol. 49, 1474–1481 (2007). [DOI] [PMC free article] [PubMed] [Google Scholar]
- 26.Canham PB, Finlay HM, Dixon JG, Boughner DR, and Chen A, “Measurements from light and polarised light microscopy of human coronary arteries fixed at distending pressure,” Cardiovascular Research 23, 973–982 (1989). [DOI] [PubMed] [Google Scholar]
- 27.Burke AP, Kolodgie FD, Farb A, Weber DK, Malcom GT, Smialek J, and Virmani R, “Healed plaque ruptures and sudden coronary death: evidence that subclinical rupture has a role in plaque progression,” Circulation 103, 934–940 (2001). [DOI] [PubMed] [Google Scholar]
- 28.Otsuka F, Joner M, Prati F, Virmani R, and Narula J, “Clinical classification of plaque morphology in coronary disease,” Nat Rev Cardiol 11, 379–389 (2014). [DOI] [PubMed] [Google Scholar]
- 29.Wolman M, “Polarized light microscopy as a tool of diagnostic pathology,” J. Histochem. Cytochem. 23, 21–50 (1975). [DOI] [PubMed] [Google Scholar]
- 30.Kasaragod DK, Lu Z, Jacobs J, and Matcher SJ, “Experimental validation of an extended Jones matrix calculus model to study the 3D structural orientation of the collagen fibers in articular cartilage using polarization-sensitive optical coherence tomography,” Biomed. Opt. Express 3, 378–387 (2012). [DOI] [PMC free article] [PubMed] [Google Scholar]
- 31.Wang Y, Ravanfar M, Zhang K, Duan D, and Yao G, “Mapping 3D fiber orientation in tissue using dual-angle optical polarization tractography,” Biomed. Opt. Express 7, 3855–3870 (2016). [DOI] [PMC free article] [PubMed] [Google Scholar]
- 32.Braaf B, Vermeer KA, de Groot M, Vienola KV, and de Boer JF, “Fiber-based polarization-sensitive OCT of the human retina with correction of system polarization distortions,” Biomed. Opt. Express 5, 2736 (2014). [DOI] [PMC free article] [PubMed] [Google Scholar]
- 33.Villiger M, Adams D, Nam AS, Lippok N, Uribe-Patarroyo N, Vakoc B, Suter M, and Bouma BE, “Reciprocity constraints in catheter-based polarimetry,” in (2016 IEEE Photonics Conference), pp. 136–137. [Google Scholar]
Associated Data
This section collects any data citations, data availability statements, or supplementary materials included in this article.