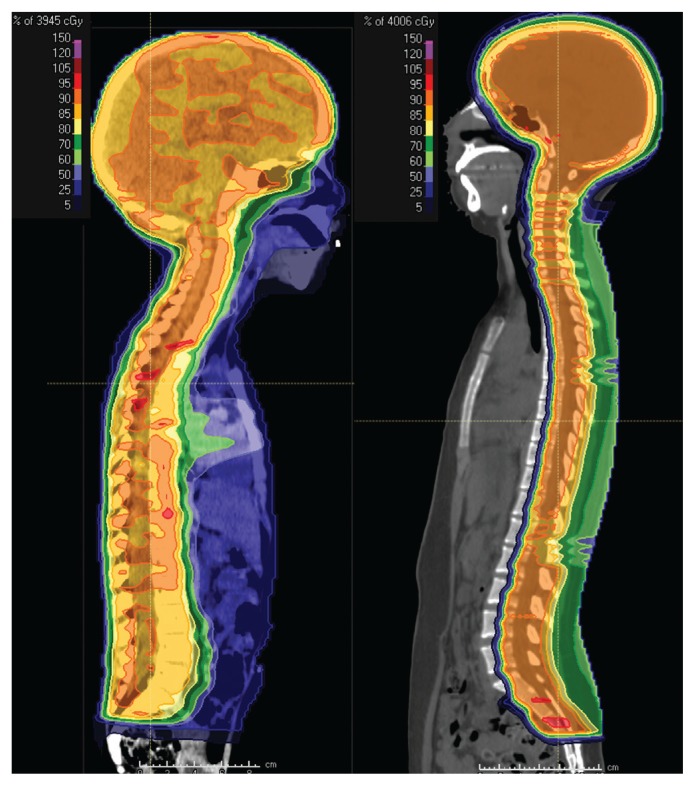
Figure 1:
Midline sagittal computed tomography images of (A) a 4-year-old child with a malignant brain tumour, treated with photon craniospinal irradiation and (B) a 16-year-old child with a malignant brain tumour, treated with proton craniospinal irradiation. The coloured portions denote regions that are receiving at least 5% of the prescribed radiation dose of 3600 cGy. Regions in dark blue and light blue are receiving 25% and 50% of the prescribed dose, respectively. Regions in light green, dark green, yellow, orange or red are receiving 60%, 70%, 85%, 90% and 95% of the prescribed dose, respectively. Note the reduction in dose exposure to normal tissues in the face, neck and thyroid, heart, liver, and pelvis with proton therapy. This comes at the small cost of increased entrance and skin dose.

