Abstract
Background:
Rodent studies of bone in chronic kidney disease have primarily relied on end-point examinations of bone microarchitecture. This study used longitudinal in vivo microcomputed tomography (in vivo μCT) to characterize the onset and progression of bone loss, specifically cortical porosity, in the Cy/+ rat of model of CKD.
Methods:
Male CKD rats and normal littermates were studied. In vivo μCT scans of the right distal tibia repeated at 25, 30, and 35 weeks were analyzed for longitudinal changes in cortical and trabecular bone morphometry. In vitro μCT scans of the tibia and femur identified spatial patterns of bone loss across distal, midshaft and proximal sites.
Results:
CKD animals had reduced BV/TV and cortical BV at all time points but developed cortical porosity and thinning between 30 and 35 weeks. Cortical pore formation was localized near the endosteal surface. The severity of bone loss was variable across bone sites, but the distal tibia was representative of both cortical and trabecular changes.
Conclusions:
The distal tibia was found to be a sensitive suitable site for longitudinal imaging of both cortical and trabecular bone changes in the CKD rat. CKD trabecular bone loss progressed through ~30 weeks followed by a sudden acceleration in cortical bone catabolism. These changes varied in timing and severity across individuals, and cortical bone loss and porosity progressed rapidly once initiated. The inclusion of longitudinal μCT in future studies will be important for both reducing the number of required animals and to track individual responses to treatment.
Keywords: CKD-MBD, Renal osteodystrophy, rat models, In vivo microcomputed tomography, Longitudinal imaging
1. Introduction
Renal osteodystrophy in chronic kidney disease (CKD) patients is marked by significant bone changes including reduced bone quality, trabecular bone loss, increased cortical porosity, cortical thinning, and increased fragility.(1–4) Cortical porosity and thinning are unique features of high-turnover renal osteodystrophy compared to osteoporosis, and their detection and treatment are of special interest due to their undesirable effects on fracture risk.(5–8)
The gold standard for identifying a patient’s subtype of renal osteodystrophy is transiliac bone biopsy, but patients are not always suited or willing to undergo the invasive procedure(9,10) Histomorphometry analysis of the biopsy requires specialized expertise, and the method only provides a snapshot of bone turnover at a single time and location. Serum or urine biomarkers may provide clues to a patient’s mineral metabolism over time, but studies to date have shown limited predictive relationships between currently used biomarkers and fracture risk in CKD patients.(11) In contrast, imaging approaches, such as DXA and peripheral quantitative computed tomography (pQCT), can identify patients with decreased bone mass, discriminate CKD patients with and without fracture, and monitor treatment effects longitudinally.(1,2,12–14) High resolution-pQCT (HR-pQCT) produces 3D images of the distal radius and tibia at a resolution sufficient to distinguish changes in the trabecular and cortical bone compartments.(3,14) This feature provides useful insight into bone status in CKD patients, whose bone loss patterns often include more cortical thinning and porosity than in patients with osteoporosis.(2,14,15) The effective single-scan radiation dose from HR-pQCT is quite low (~3μSv), but patients’ cumulative exposure from all sources should be considered, especially when repeated imaging is planned.(16,17) Barriers to widespread clinical use of HR-pQCT include the limited availability of instruments and the need for greater standardization.(16,18)
Pre-clinical researchers rely primarily on end-point measures to assess CKD bone disease and treatment effects. Paralleling the advancement of HR-pQCT for clinical use, the development and increasing availability of in vivo μCT has made it possible to longitudinally track bone microarchitecture in live animals.(19–23) Successful applications of the technique in rats to monitor bone morphometry include models of ovariectomy(24,25), limb unloading(26), and drug treatment.(27) Rodent studies of chronic kidney disease to date have primarily relied on end-point examinations of bone microarchitecture.(28–35) These terminal examinations present challenges for differentiating bone changes pre-dating treatment from those occurring after treatment onset, potentially limiting the detection or interpretation of preventative versus restorative drug effects. A longitudinal study design in which measurements are taken noninvasively on the same individual and the same location over time has the potential to overcome this barrier by comparing changes to the individual’s pre-treatment baseline. The clinical features of CKD-MBD with secondary hyperparathyroidism are recapitulated by the Cy/+ rat model of CKD.(28,36,37) The goal of the present study was to use longitudinal in vivo microcomputed tomography (in vivo μCT) to characterize the onset and progression of bone loss, specifically cortical porosity, in the Cy/+ rat of model of CKD.
2. Methods
2.1. Animal model and experimental design
Male Han:SPRD rats heterozygous for the Anks6 R823W mutation (Cy/+) were characterized by the presence of azotemia at 10 weeks of age as in our previous studies.(28,36,37) Normal littermates (NL) were used as matched controls. All animals were individually housed on a standard 12hr light cycle. In order to promote CKD progression in Cy/+ animals, all animals were switched from standard chow to a casein diet (Purina AIN-76A; 0.7% Pi, 0.6% Ca) at 24 weeks of age.(36) Bodyweights were measured weekly from 25–35 weeks of age. Animals were euthanized by CO2 inhalation at 35 weeks. Blood biochemistry and bone morphometry were measured longitudinally from 25 to 35 weeks as described below. Consistent with survival rates in our previous studies, three CKD animals died suddenly or required humane euthanasia between 32–34 weeks of age; these animals were excluded from analysis and replaced to achieve the final group sizes (18 NL and 13 CKD). All animal procedures received approval from the Institutional Animal Care and Use Committee prior to initiating the studies.
2.2. Blood Biochemistry
Approximately 400ul of blood was collected from the tail vasculature of each animal at 25, 30, and 35 weeks of age. Blood plasma was tested for BUN, calcium, and phosphorus using colorimetric assays (Point Scientific, Canton, MI, USA, or Sigma kits). Intact PTH was determined by ELISA (Alpco, Salem, NH, USA) at 35 weeks for a subset of animals (N=6–7/group).
2.3. Microcomputed tomography
2.3.1. Longitudinal Scans – Distal Tibia
All scans were performed on a Bruker Skyscan 1176 in vivo μCT system at a 9μm resolution (0.5mm Al filter, 60kV, 417μA, 0.9° rotation step, 180° scanning, 926ms exposure). Each scan lasted ~10 minutes. The average NL rat girth in this study was too large to position the animals’ torsos within the scanner bore; this limited the potential sites of interest to the lower extremities. Because of this the distal tibia was chosen as the site of interest. For in vivo scans at 25 and 30 weeks, animals were anesthetized with isofluorane and placed supine on the instrument bed. The right hind limb was extended with the foot and ankle placed through a polystyrene foam positioning ring firmly taped to the bed. Dental wax was molded around the foot to hold the leg in place. Tape was used to secure the tail, left hind limb, and adjacent soft tissues within the scanner bed but out of the field of interest. This approach ensured the distal tibia was isolated in the field of view and consistently immobilized.
The 35-week longitudinal scans were performed after death to reduce the number of animal procedures. Right hind limbs were harvested at the hip immediately after sacrifice with all soft tissues intact, wrapped in saline-soaked gauze, and stored frozen. Limbs were thawed at room temperature on the day of scanning, positioned, and scanned under conditions otherwise identical to those used for in vivo scans. Exposed muscle around the proximal femur was wrapped in Parafilm to maintain hydration during the scan. The limb was immobilized on the instrument bed using the same positioning ring, wax, and orientation as used with live animals, and identical scan parameters were used.
2.3.2. In vitro Scans – Whole Tibia and Femur
Immediately following the 35-week longitudinal scan, the right tibia and femur were isolated, cleaned of all soft tissue, wrapped in Parafilm with a few drops of saline to maintain hydration, and scanned. The removal of soft tissue required a slightly lower voltage to maintain proper scan exposure, but the remaining parameters matched the longitudinal scans (0.5mm Al filter, 55kV, 417μA, 0.9° rotation step, 180° scanning, 926ms exposure).
2.3.3. Scan summary
The studied groups (18 NL and 13 CKD animals) were part of a larger interventional experiment that started a few weeks before the in vivo μCT system became available due to logistical issues. As a result, a subset of the 31 animals have incomplete longitudinal datasets. The missing data were addressed during statistical analysis by the use of mixed models, which, unlike standard linear models or ANOVA, can evaluate incomplete repeated measures data without the use of replacement values or the complete exclusion of subjects with missing values. Overall, the dataset includes complete 25, 30, and 35-week scans from 17 animals (8 NL and 9 CKD). The raw files for one 30-week CKD scan were lost due to a software error during imaging, resulting in this animal having data for 25 and 35 weeks. Ten animals (8 NL and 2 CKD) missed the baseline 25-week scan but were scanned at 30 and 35 weeks, and 3animals (2 NL and 1 CKD) were scanned only at 35 weeks. 35-week longitudinal and traditional in vitro scans were analyzed for all 31 animals (18 NL and 13 CKD).
2.4. Analysis
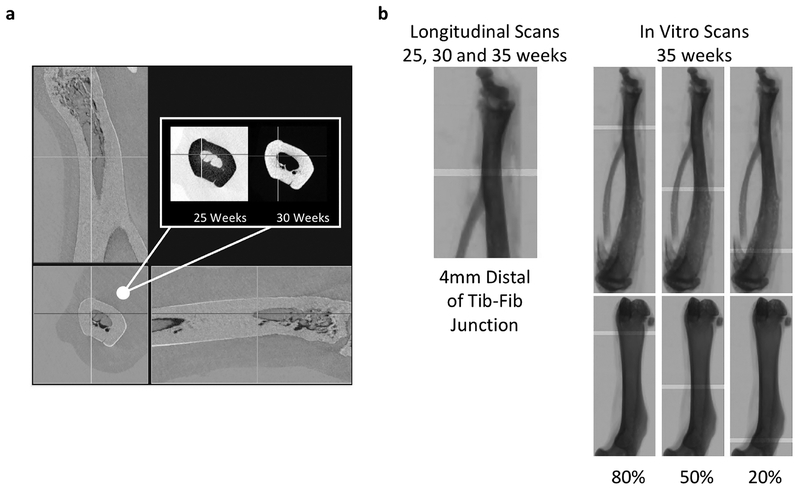
Following reconstruction, longitudinal scans of the distal tibia were 3D-registered and analyzed using manufacturer-suppled software (SkyScan DataViewer and CTan). Baseline (25 week) scans were rotated to a standardized orientation, and 3D registration of successive scans (30 to 25 weeks, 35 to 30 weeks) maximized consistency in the location and volume of bone analyzed for each time point (Figure 1a). A 1 mm volume of interest (VOI) centered 4 mm distal of the tibia-fibula junction was drawn to isolate the cortex and analyzed for cortical geometry and porosity (Figure 1b). A second 1mm VOI was drawn for distal trabecular bone analysis beginning 3mm proximal of the tibia inferior articular surface.
Figure 1 -.
(a) An example orthographic view of 3D-registered 25 and 30-week scans of the distal tin a CKD animal. Inverse color scales for each of the scans (inset) were chosen so that areas of bonelossand formation are highlighted as dark and light, respectively, in the over-aid views. (b) 1mm Cortical VOI locations are shown for longitudinal and in vitro scans.
In vitro scans of the isolated and cleaned tibiae and femora were rotated to a standardized orientation and analyzed for cortical geometry and porosity at 3 sites (proximal, midshaft and distal) located at 20%, 50%, and 80% of the bone’s length (Figure 1b). VOI locations were chosen as a percentage of bone length to standardize for potential bone length differences. Although this was not possible for the longitudinal scans spanning the distal tibia (tibia lengths were not measured at 25 or 30 weeks), the longitudinal and in vitro distal tibia VOI were comparable in location and size (Figure 1b). Proximal tibia trabecular bone morphology was analyzed for a 1mm-long VOI beginning 1mm distal of the proximal growth plate. Distal femur trabecular bone morphology was analyzed for a 1mm-long VOI beginning 2.5mm proximal of the distal growth plate.
2.5. Statistics
Statistical analyses were performed in R (version 3.5.1). Linear mixed model analysis using lme4 (R package version 1.1–17) was used for repeated measures to allow the inclusion of samples with missing data.(38) The fitted mixed models included a random intercept for subject and factors for phenotype, time, and their interaction. In the case of end-point microCT measures quantified at multiple bone sites, time was replaced by site in the model specification. Significant factor effects were identified using p-values calculated using lmerTest (R package version 3.0–1).(39) Post hoc pairwise comparisons across phenotype and time (or site) with multiple comparison adjustment using Tukey’s method were used to identify specific group and timepoint (or site) differences for significant factor effects (emmeans, R package version 1.2.3).(40) Mann-Whitney nonparametric tests were used to test the significance of phenotype for single time or site measures. Spearman correlations were used to test for relationships between biochemistry and bone measures. Biochemistry correlations were performed within each phenotype for all successful blood collections/analyses across the three time points. The resulting sample sizes for correlation assessment were: 6–7 for PTH, 23–26 for phosphorus and calcium, and 29–36 for BUN. All statistical tests were 2-tailed. Data is presented as mean + SD.
3. Results
3.1. Bodyweight and Biochemistries
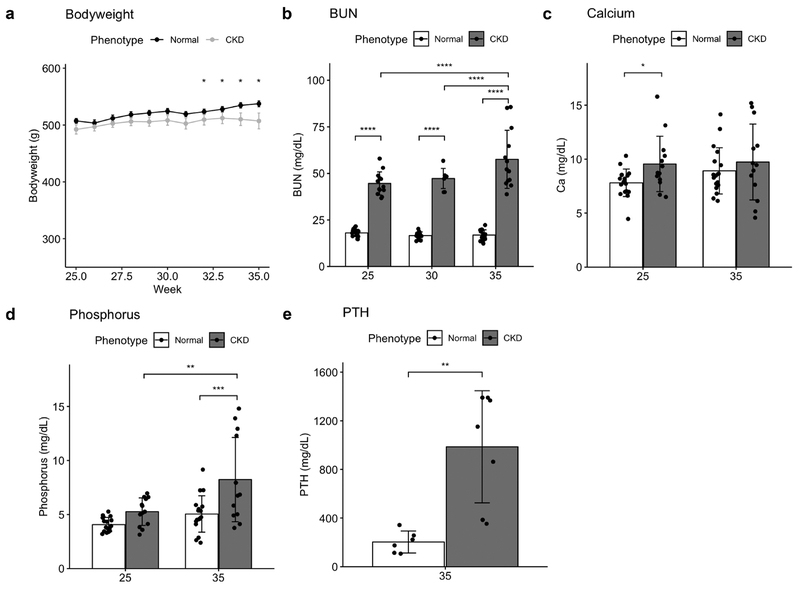
CKD and NL animals had similar bodyweights up to ~32 weeks of age at which point they diverged with NL being higher than CKD (Figure 2a). Biochemistry results (Fig 2b–e) were typical for this Cy/+ model. Plasma BUN was elevated in CKD animals at 25 weeks compared to NL and continued to increase through 35 weeks. Consistent with prior studies, calcium was not significantly different between NL and CKD animals at 35 weeks, but CKD animals had significantly higher phosphorous and PTH levels.
Figure 2 -.
a) CKD animals weighed less beginning at 32 weeks. Blood BUN (b), phosphorus (d) and PTH (e) became increasingly elevated in CKD animals. Calcium levels (c) were significantly higher than NL at 25 but not 35 weeks. Bar plots show mean +/− SD as well as individual data points. *p <= 0.05; **p <= 0.01; ***p <= 0.001; ****p <= 0.0001
3.2. Longitudinal μCT
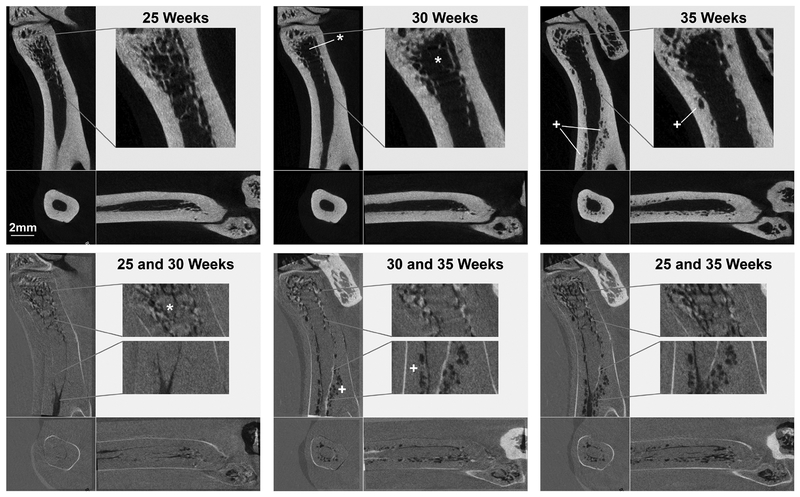
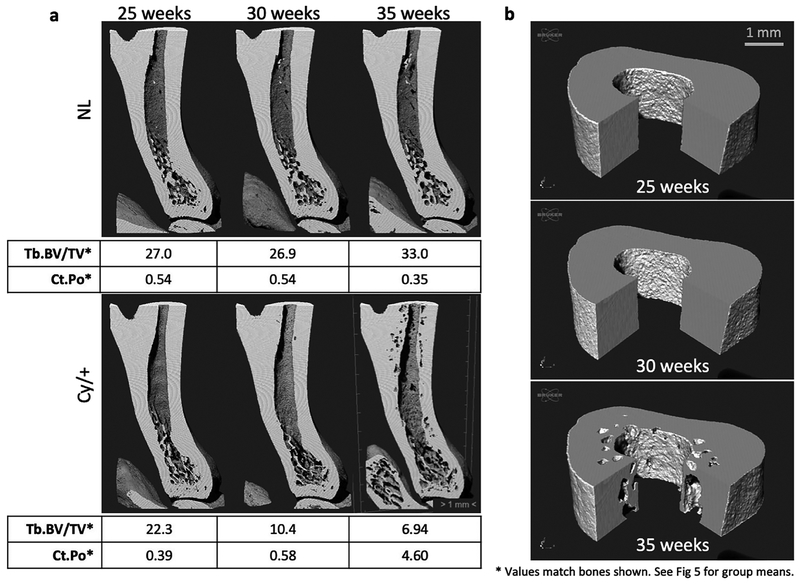
Areas of bone loss and gain over the 10-week study were observed in superimposed 2D slices from the registered longitudinal scans (Figure 3). The selected color scheme in the overlays (bottom row) highlights changes between the overlaid time points, with areas of bone loss appearing darker and areas of new bone lighter. These images from a representative CKD animal illustrate that bone loss was primarily trabecular between 25 and 30 weeks. Cortical bone losses were more significant between 30 and 35 weeks, and the full extent of bone resorption over the 10-week study is seen in the overlaid 25 and 35-week longitudinal scans. Registered cutaway 3D renderings also visualized the degree and patterns of bone loss (Fig 4). We consistently observed that the cortical porosity formation in CKD bones was first visible near the endocortical surface. Significant pore enlargement eventually eroded the original endosteal surface, resulting in thinning of the cortex and expansion of the marrow cavity.
Figure 3 -.
Registered scans (top row) from a representative CKD animal illustrate the large cortical porosity formation (+) observed between 30 and 35 weeks. Trabecular bone loss (*) was present by 30 weeks, Over-lays of 25 and 30, 30 and 35, and 25 and 35 weeks (bottom row) highlight the locations and timing of bone loss, with dark and light regions identifying areas of removed and added bone, respectively.
Figure 4-.
3D renderings of longitudinal tibia scans for a NL and a CKD animal. (a) Registered cross-sectional views are shown along with corresponding values of trabecular BV/TV (%) and cortical porosity (%) for the bones shown. CKD trabecular bone loss preceded cortical porosity formation. (b) Cut views of the cortical VOI for the same CKD animal demonstrate the endosteal clustering and first appearance of cortical porosity at 35 weeks.
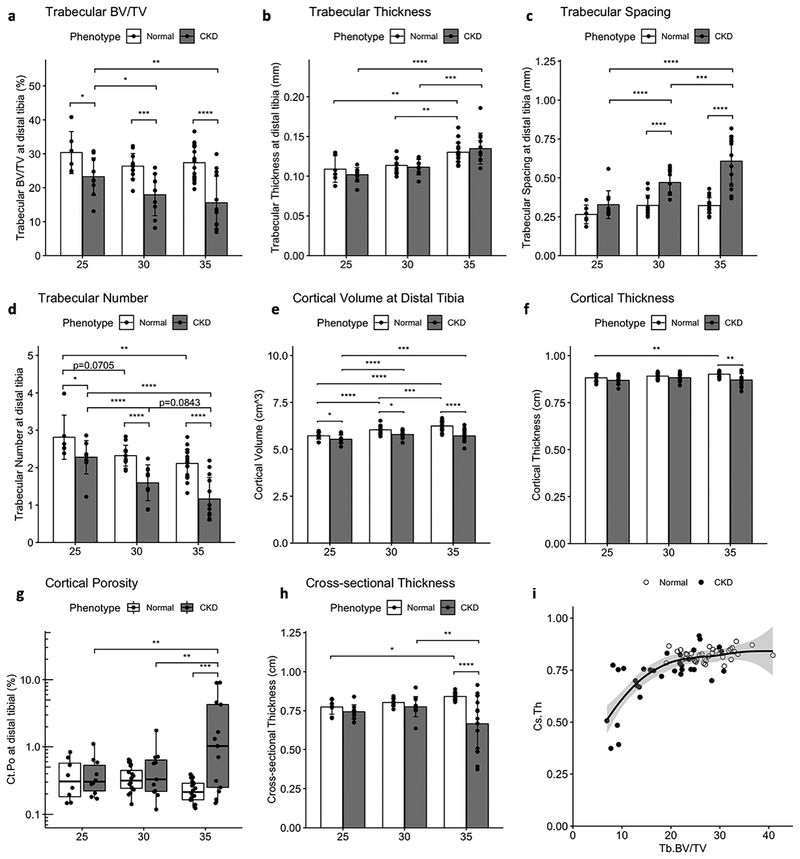
The timing and patterns of CKD bone loss were further explored by quantitative analysis of the registered VOIs (Figure 5). NL animals maintained trabecular BV/TV (Fig 5a) and gained cortical volume (Fig 5e) and thickness (Fig 5f) at the distal tibia over the 10-week study. Both NL and CKD animals had slightly increased mean trabecular thickness over time, but in the case of CKD animals this was likely due to the loss of the thinnest trabeculae as evidenced by the combination of reduced BV/TV (Fig 5a), reduction in Tb.N (Fig 5d) and increase in spacing (Fig 5c). Compared to NL, CKD animals also had reduced cortical volume at 25, 30 and 35 weeks (Fig 5e). Trabecular BV/TV continued to decrease in CKD animals over time and was significantly lower at 30 and 35 weeks compared to baseline. In contrast, cortical volume slightly increased in CKD from 25 to 30 weeks and maintained the increase from baseline at 35 weeks.
Figure 5 -.
Longitudinal measures of trabecular and cortical bone volume at the distal tibia. CKD animals had increasing reductions in trabecular bone volume fraction (a) driven by a reduction in trabecular number (d) and increased spacing (c). Cortical volume (e), cortical thickness (f), and cortical cross-sectional thickness (h) were increasingly reduced compared to NL over the 10-week study. CKD levels of cortical porosity (g) were only increased at 35 weeks. A scatterplot with LOESS curve fit (i) shows the nonlinear biphasic relationship between trabecular BV/TV and cross-sectional thickness measured for each animal at 25, 30 and 35 weeks; Ct.Cs.Th is reduced below a Tb.BV/TV threshold of ~20%. Bar plots show mean +/− SD. Cortical porosity is shown with a box and whisker plot and log axis to accommodate the strongly skewed distribution. *p <= 0.05; **p <= 0.01; ***p <= 0.001; ****p <= 0.0001
Despite the relative gains in cortical volume, CKD cortical thickness did not increase as in NL animals and was significantly less than NL at 35 weeks. Cortical porosity (Fig 5d) did not change in NL animals and was significantly elevated in CKD at 35 weeks compared to both earlier timepoints. Cross-sectional thickness (Fig 5e), a 2D cortical parameter calculated as Ct.Cs.Th = 2/(Bone Surface/Bone Volume), was more greatly reduced than cortical thickness in CKD animals compared to NL at 35 weeks, presumably due to its sensitivity to both bone volume loss and increasing bone surface resulting from pore formation. A scatterplot with LOESS curve fit (Fig 5f) shows the biphasic relationship between trabecular BV/TV and cross-sectional thickness measured for each animal at 25, 30, and 35 weeks. Notably, cross-sectional thickness was only reduced when BV/TV was below a threshold of approximately 20%. Together, these data illustrate that trabecular bone loss largely preceded cortical porosity and thinning in the CKD distal tibia between 25 and 35 weeks.
3.3. In vitro μCT
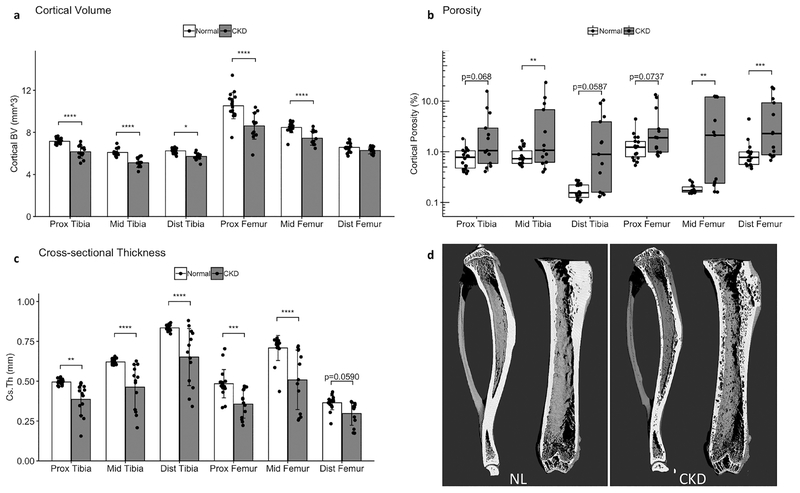
In vitro scans of the 35-week tibia and femur revealed spatial variability in the cortical bone changes in CKD animals. Figure 6d shows 3D renderings of the tibia and femur from representative NL (left panel) and CKD (right panel) animals. Cortical volume was reduced in CKD bones at all measured sites except the distal femur, where there was no significant difference in cortical BV compared to NL (Fig 6a). Cross-sectional thickness (Fig 6c) similarly detected significant reductions from CKD at all but the distal femur site, but the effect was consistently stronger than for cortical volume. The degree of cortical porosity (Fig 6b) was highly variable for the CKD animals. Although porosity was visible in CKD animals at all sites during analysis, the increase compared to NL animals only reached statistical significance in a subset of the measured sites in the repeated site analysis: the midshaft tibia, midshaft femur, and distal femur. The increased distal tibia porosity in CKD animals did reach statistical significance in the longitudinal statistical analysis (Fig 5), and that difference is attributable to the longitudinal analysis’ reduced number of post hoc multiple comparisons and greater power from repeated measures of the same bone over time.
Figure 6 -.
In vitro 35-week measures of cortical bone at proximal, midshaft and distal sites for the femur and tibia showed variable effects of CKD by location. Cortical volume (a) and cortical cross-sectional thickness (c) were reduced in CKD at all sites except the distal femur. Cortical porosity (b) was quite variable in CKD animals and significantly increased at the tibia midshaft, femur midshaft, and distal femur in this analysis. Panel (d) presents rendered volumes of the ex vivo tibia and femur scans from the same NL and CKD animals as shown in Figure 4. Bar plots show mean +/− SD. Cortical porosity is shown with a box and whisker plot and log () axis to accommodate the strongly skewed distribution. *p <= 0.05; **p <= 0.01; ***p <= 0.001; ****p <= 0.0001
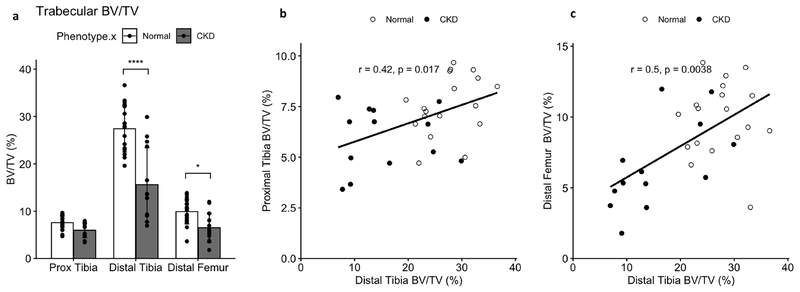
Trabecular bone volume fraction was significantly reduced in CKD animals at the distal tibia site used for longitudinal measures. Trabecular BV/TV was also reduced at the distal femur but not statistically affected by CKD at the proximal tibia site. Spearman correlations between BV/TV at the distal tibia and the proximal tibia and distal femur sites confirmed significant relationships between BV/TV measures across the trabecular sites (Fig 7).
Figure 7 -.
Trabecular bone volume at the proximal tibia, distal tibia, and distal femur sites. CKD animals had significantly reduced BV/TV (a) compared to NL at both distal locations. Spearman correlations confirmed significant relationships between the distal tibia BV/TV and BV/TV at both the proximal tibia (b) and distal femur (c), supporting the usefulness of the distal tibia for monitoring BV/TV changes in CKD over time. Bar plots show mean +/− SD. *p <= 0.05; **p <= 0.01; ***p <= 0.001; ****p <= 0.0001
3.4. Correlations between bone measures and biochemistry
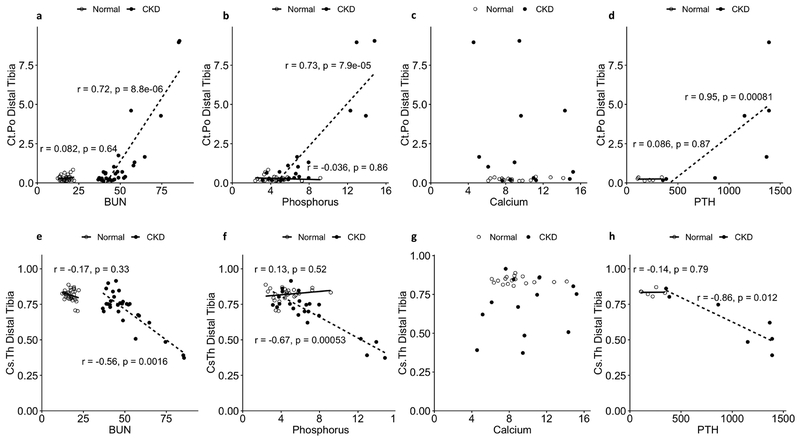
Significant correlations were identified between longitudinal bone measures, including cortical porosity and cross-sectional thickness, and corresponding levels of BUN, phosphorus, and PTH (Fig 8). No significant correlations were found with calcium level.
Figure 8 -.
Relationships between blood biochemistry and cortical porosity (a-d) or cortical cross-sectional thickness (e-h) as tested by Spearman correlation for NL and CKD animals. Data include all longitudinal time points collected for each measure. BUN ( a,e), Phosphorus (b,f), and PTH (d,h) were significantly associated with cortical porosity (+) and cross-sectional thickness (-) in CKD animals. Calcium (c,g) was not associated with either bone measure in CKD animals. No significant relationships were identified between the blood and bone measures for NL animals. N= 6–36 for the various correlations, see methods for more details.
4. Discussion
This study identified a variable but rapid acceleration of cortical bone loss in the CKD rat within a 5-week period between 30 and 35 weeks of age. In prior studies without baseline measures, animals with significantly greater bone loss at study completion might have had more severe disease, greater bone loss, and porosity formation preceding the onset of study treatments.(28–30,41,42) The current results reveal that the high variability in bone endpoint measurements, particularly at 30 weeks, is attributable to variability in the timing of a sudden escalation in bone loss after 30 weeks of age. Previous terminal studies established the most significant development of mineral and bone problems in male CKD rats fed a casein diet occurs sometime after 25 weeks of age.(36) Evidence of cortical and cancellous bone loss in CKD rats compared to controls was identified by endpoint measures at both 30 and 35 weeks, but increased cortical porosity was only detected at 35 weeks.(28,30) Without baseline or longitudinal measures for these studies, it was unknown whether the lack of cortical porosity at 30 weeks reflected a pattern of progressive bone loss or was due to variability across individuals and/or studies. We have now established that a slow, progressive, largely trabecular bone loss continues in the Cy/+ male rat through ~30 weeks of age, at which point there is a sudden and impressive acceleration in cortical bone catabolism. Because the timing of this acceleration is slightly variable, the method established in this study could feasibly be used in future studies to stage individual animals prior to the start an experiment to selectively investigate treatments at a specific disease stage.
The longitudinal scans revealed consistent spatial patterns, with the first signs of cortical porosity always localized near, but not visibly touching, the endosteal surface. Porosity increased through both pore enlargement and increased number of pores. Superimposed registered longitudinal scans revealed eventual erosion of the endosteal surface as a result of pore growth. As a result, in the more severe cases, cortical porosity eventually became a less sensitive indicator of overall bone loss due to the loss of the original bone envelope and resulting reduction in measured cortical total volume. Thus, in characterizing the severity of CKD cortical bone disease, it is important to consider cortical porosity within the larger context of reduced cortical bone volume and cortical thinning. We found that cross-sectional thickness, which effectively normalizes bone area to bone surface, may provide a concise measure for this type of cortical bone loss. Further, a trabecular BV/TV approaching a critical threshold (~20% at the distal tibia in this study) may identify individuals at risk for developing significant cortical bone loss. On an individual level, registered baseline and longitudinal imaging is an effective means to track and identify loss of the original bone envelope in addition to changes in cortical porosity.
We found significant correlations between BUN, phosphorus, and PTH levels and measures of bone loss in the CKD animals which indicated greater bone loss in animals with greater disturbances in blood biochemistry. This was to be expected given the progressive nature of this CKD model, with noted features of the disease increasing in parallel. It should be noted, however, that the strong covariance between the biochemical measures precludes any conclusions about specific cause and effect relationships based on our results. Although a strong relationship was found between PTH and bone loss, these correlations must be interpreted cautiously because measurement of PTH was limited to 35 weeks and a small number of individuals (6–7/group). In a previous study, elevated PTH levels at 25 weeks in male Cy/+ rats continued to increase at 30 weeks and again through 35 weeks.(29) Given the known metabolic effects of hyperparathyroidism on bone, the sudden onset of catabolism of cortical bone in this study may potentially be explained by progressively increasing PTH levels eventually reaching a critical threshold. Cortical bone loss has been shown to be fully prevented in this model by calcium treatment to control the secondary hyperparathyroidism.(28) It has not been established whether the cortical porosity and thinning can be reversed once established, but the longitudinal μCT approach reported here makes such a study possible.
This study performed longitudinal in vivo μCT measures on the rat distal tibia. The distal site was chosen for its minimal soft tissue mass, the ability to isolate the site within the x-ray field, and the size limitations of the instrument. These restrictions parallel those for clinical HR-pQCT, which is limited to the distal tibia and radius, adding to this study’s clinical significance. Given the potential limitations of making conclusions about a systemic problem based on a single site, it was of interest to determine whether bone parameters of the distal tibia are reflective of other bone sites. Furthermore, prior studies of the Cy/+ rat have focused on the proximal, rather than distal, tibia. The in vitro scans of the full tibiae and femora allowed us to address these questions. We found the bone measures at the distal site paralleled those at the proximal tibia, with both sites showing similar degrees of cortical bone volume loss, reduced cross-sectional thickness, and cortical porosity at 35 weeks. Trabecular BV/TV at the distal tibia was significantly reduced in CKD animals and more affected than trabecular BV/TV at the proximal site. Trabecular bone volume fraction at the distal tibia was greater than, but correlated with, BV/TV at the distal femur and proximal tibia sites. However, despite this congruity across the tibia and femur sites at study end, it is possible that these (or other) bone sites are affected differently over the course of CKD progression.
One limitation of this work, and longitudinal μCT studies as a whole, is the potential radiation impact on the animal, tissues, and measures of interest. Unfortunately, we did not perform endpoint μCT on the contralateral limb, so we are unable to determine with certainty whether the repeated radiation exposures directly to the limb significantly impaired bone morphology or interacted with the effects of CKD. Qualitatively, we noted no discernable pattern when comparing the endpoint bone parameters of animals who received all three scans compared to those that did not. It is important to note that in this study the radiation exposure was limited to the distal tibia site, yet the patterns of CKD bone loss at study-end were largely consistent across the femur and tibia as evaluated by whole-bone in vitro scans, as well as with bones from our previous work that did not involve in vivo CT. Though we cannot rule out the possibility of systemic radiation effects in this study, our data are not suggestive that this drove the major outcomes of this work.
In conclusion, the distal tibia was found to be a sensitive and suitable site for in vivo longitudinal imaging of both cortical and trabecular bone changes in the CKD rat. These changes varied in timing and severity across individuals, and cortical bone loss and porosity progressed rapidly once initiated. Although the reported details of cortical porosity formation are specific to the studied Cy/+ rat model, the ability to observe cortical porosity progress with this approach should be possible in other animal models. The inclusion of longitudinal μCT in future studies will be important for both reducing the number of required animals and to track individual responses to treatment.
Highlights.
The distal tibia is a sensitive site for longitudinal μCT of cortical and trabecular bone changes in the CKD rat.
CKD trabecular bone loss largely precedes the initial formation of cortical porosity.
CKD cortical porosity formation is initially concentrated near the endosteal surface.
CKD cortical bone loss varies in timing and severity across individuals but porosity progresses rapidly once initiated.
Funding
Research reported in this publication was supported by the National Institute of Diabetes And Digestive And Kidney Diseases of the National Institutes of Health under Award Numbers F32DK108554 (EMBM), F30DK115162 (MWA), and R01DK11087103 (MRA, SMM). Dr. Moe and Allen are supported by the Veterans Administration. The content is solely the responsibility of the authors and does not necessarily represent the official views of the National Institutes of Health or VA.
Footnotes
Publisher's Disclaimer: This is a PDF file of an unedited manuscript that has been accepted for publication. As a service to our customers we are providing this early version of the manuscript. The manuscript will undergo copyediting, typesetting, and review of the resulting proof before it is published in its final citable form. Please note that during the production process errors may be discovered which could affect the content, and all legal disclaimers that apply to the journal pertain.
Declarations of Interest
EMMB, DTB, MWA, NXC, and MRA report no conflicts of interest. SMM reports personal fees from Sanofi Genzyme and Amgen outside the submitted work.
References
- 1.Trombetti A, Stoermann C, Chevalley T et al. Alterations of bone microstructure and strength in end-stage renal failure. Osteoporosis International 2013; 24: 1721–1732. [DOI] [PubMed] [Google Scholar]
- 2.Nickolas TL, Stein E, Cohen A et al. Bone mass and microarchitecture in CKD patients with fracture. Journal of the American Society of Nephrology 2010; 21: 1371–1380. [DOI] [PMC free article] [PubMed] [Google Scholar]
- 3.Rapid cortical bone loss in patients with chronic kidney disease. Journal of Bone and Mineral Research 2013; 28: 1811–1820. [DOI] [PMC free article] [PubMed] [Google Scholar]
- 4.West SL, Jamal SA. Determination of bone architecture and strength in men and women with stage 5 chronic kidney disease. Seminars in Dialysis 2012; 25: 397–402. [DOI] [PubMed] [Google Scholar]
- 5.Bala Y, Zebaze R, Ghasem-Zadeh A et al. Cortical porosity identifies women with osteopenia at increased risk for forearm fractures. Journal of Bone and Mineral Research 2014; 29: 1356–1362. [DOI] [PMC free article] [PubMed] [Google Scholar]
- 6.Patsch JM, Burghardt AJ, Yap SP et al. Increased cortical porosity in type 2 diabetic postmenopausal women with fragility fractures. Journal of Bone and Mineral Research 2013; 28: 313–324. [DOI] [PMC free article] [PubMed] [Google Scholar]
- 7.Bjørnerem Å, Bui QM, Ghasem-Zadeh A, Hopper JL, Zebaze R, Seeman E. Fracture risk and height: An association partly accounted for by cortical porosity of relatively thinner cortices. Journal of Bone and Mineral Research 2013; 28: 2017–2026. [DOI] [PubMed] [Google Scholar]
- 8.Augat P, Schorlemmer S. The role of cortical bone and its microstructure in bone strength. Age and Ageing [Internet] 2006; 35: ii27–ii31. Available from: http://www.ageing.oxfordjournals.org/cgi/doi/10.1093/ageing/afl081 [DOI] [PubMed] [Google Scholar]
- 9.Update on the role of bone biopsy in the management of patients with CKD-MBD. Journal of nephrology 2017; 30: 645–652. [DOI] [PubMed] [Google Scholar]
- 10.Bacchetta J, Boutroy S, Juillard L et al. Bone imaging and chronic kidney disease: will high-resolution peripheral tomography improve bone evaluation and therapeutic management? Journal of renal nutrition the official journal of the Council on Renal Nutrition of the National Kidney Foundation [Internet] 2009;19: 44–49. Available from: http://linkinghub.elsevier.com/retrieve/pii/S1051227608004561 [DOI] [PubMed] [Google Scholar]
- 11.Fractures Fragility and Osteoporosis in CKD: Pathophysiology and Diagnostic Methods. American journal of kidney diseases :the official journal of the National Kidney Foundation 2014; 63: 1049–1059. [DOI] [PubMed] [Google Scholar]
- 12.Can one evaluate bone disease in chronic kidney disease without a biopsy? Current opinion in nephrology and hypertension 2014; 23: 431–437. [DOI] [PMC free article] [PubMed] [Google Scholar]
- 13.Jamal SA, West SL, Miller PD. Fracture risk assessment in patients with chronic kidney disease. Osteoporosis International 2012; 23: 1191–1198. [DOI] [PubMed] [Google Scholar]
- 14.Cejka D, Patsch JM, Weber M et al. Bone microarchitecture in hemodialysis patients assessed by HR-pQCT. Clinical journal of the American Society of Nephrology : CJASN 2011; 6: 2264–2271. [DOI] [PMC free article] [PubMed] [Google Scholar]
- 15.Jamal SA, Nickolas TL. Bone imaging and fracture risk assessment in kidney disease. Current osteoporosis reports 2015; 13:166–172. [DOI] [PubMed] [Google Scholar]
- 16.Cheung AM, Adachi JD, Hanley DA et al. High-resolution peripheral quantitative computed tomography for the assessment of bone strength and structure: a review by the Canadian Bone Strength Working Group. Current osteoporosis reports 2013; 11: 136–146. [DOI] [PMC free article] [PubMed] [Google Scholar]
- 17.Solomou G, Damilakis J. Radiation Exposure in Bone Densitometry. Seminars in musculoskeletal radiology 2016; 20: 392–398. [DOI] [PubMed] [Google Scholar]
- 18.Nishiyama KK, Shane E. Clinical Imaging of Bone Microarchitecture with HR-pQCT. Current osteoporosis reports 2013;11: 147–155. [DOI] [PMC free article] [PubMed] [Google Scholar]
- 19.Schulte FA, Lambers FM, Kuhn G, Müller R. In vivo micro-computed tomography allows direct three-dimensional quantification of both bone formation and bone resorption parameters using time-lapsed imaging. Bone 2011; 48: 433–442. [DOI] [PubMed] [Google Scholar]
- 20.Campbell GM, Sophocleous A. Quantitative analysis of bone and soft tissue by microcomputed tomography: applications to ex vivo and in vivo studies. BoneKEy reports 2014; 3: 564. [DOI] [PMC free article] [PubMed] [Google Scholar]
- 21.Schambach SJ, Bag S, Schilling L, Groden C, Brockmann MA. Application of micro-CT in small animal imaging. Methods (San Diego, Calif.) 2010; 50: 2–13. [DOI] [PubMed] [Google Scholar]
- 22.Holdsworth DW, Thornton MM. Micro-CT in small animal and specimen imaging. Trends in Biotechnology 2002; 20: S34–S39. [Google Scholar]
- 23.Bouxsein ML, Boyd SK, Christiansen BA, Guldberg RE, Jepsen KJ, M u ller R. Guidelines for assessment of bone microstructure in rodents using micro-computed tomography. Journal of Bone and Mineral Research 2010; 25: 1468–1486. [DOI] [PubMed] [Google Scholar]
- 24.Boyd SK, Davison P, Müller R, Gasser JA. Monitoring individual morphological changes over time in ovariectomized rats by in vivo micro-computed tomography. Bone 2006; 39: 854–862. [DOI] [PubMed] [Google Scholar]
- 25.Waarsing JH, Day JS, van der Linden JC et al. Detecting and tracking local changes in the tibiae of individual rats: A novel method to analyse longitudinal in vivo micro-CT data. Bone 2004; 34: 163–169. [DOI] [PubMed] [Google Scholar]
- 26.David V, Laroche N, Boudignon B et al. Noninvasive in vivo monitoring of bone architecture alterations in hindlimb-unloaded female rats using novel three-dimensional microcomputed tomography. Journal of Bone and Mineral Research 2003; 18: 1622–1631. [DOI] [PubMed] [Google Scholar]
- 27.Brouwers JEM, Van Rietbergen B, Huiskes R, Ito K. Effects of PTH treatment on tibial bone of ovariectomized rats assessed by in vivo micro-CT. Osteoporosis International 2009; 20: 1823–1835. [DOI] [PMC free article] [PubMed] [Google Scholar]
- 28.Moe SM, Chen NX, Newman CL et al. A comparison of calcium to zoledronic acid for improvement of cortical bone in an animal model of CKD. Journal of Bone and Mineral Research 2014; 29: 902–910. [DOI] [PMC free article] [PubMed] [Google Scholar]
- 29.Moe SM, Chen NX, Newman CL et al. Anti-sclerostin antibody treatment in a rat model of progressive renal osteodystrophy. Journal of Bone and Mineral Research 2015; 30: 539–549. [DOI] [PMC free article] [PubMed] [Google Scholar]
- 30.Newman CL, Creecy A, Granke M et al. Raloxifene improves skeletal properties in an animal model of cystic chronic kidney disease. Kidney International 2016; 89: 95–104. [DOI] [PMC free article] [PubMed] [Google Scholar]
- 31.Moe SM, Seifert MF, Chen NX et al. R-568 reduces ectopic calcification in a rat model of chronic kidney disease-mineral bone disorder (CKD-MBD). Nephrology Dialysis Transplantation 2009; 24: 2371–2377. [DOI] [PubMed] [Google Scholar]
- 32.Nikolov IG, Joki N, Nguyen-Khoa T et al. Chronic kidney disease bone and mineral disorder (CKD-MBD) in apolipoprotein E-deficient mice with chronic renal failure. Bone 2010; 47: 156–163. [DOI] [PubMed] [Google Scholar]
- 33.Cejka D, Parada-Rodriguez D, Pichler S et al. Only minor differences in renal osteodystrophy features between wild-type and sclerostin knockout mice with chronic kidney disease. Kidney International 2016; 90: 828–834. [DOI] [PMC free article] [PubMed] [Google Scholar]
- 34.Ferrari GO, Ferreira JC, Cavallari RT et al. Mineral bone disorder in chronic kidney disease:head-to-head comparison of the 5/6 nephrectomy and adenine models. Bmc Nephrology 2014; 15: S1–S7. [DOI] [PMC free article] [PubMed] [Google Scholar]
- 35.Kadokawa S, Matsumoto T, Naito H, Tanaka M. Assessment of trabecular bone architecture and intrinsic properties of cortical bone tissue in a mouse model of chronic kidney disease. Journal of Hard Tissue Biology 2011; 20: 79–86. [Google Scholar]
- 36.Moe SM, Chen NX, Seifert MF et al. A rat model of chronic kidney disease-mineral bone disorder. Kidney International 2009; 75: 176–184. [DOI] [PMC free article] [PubMed] [Google Scholar]
- 37.Moe SM, Radcliffe JS, White KE et al. The pathophysiology of early-stage chronic kidney disease-mineral bone disorder (CKD-MBD) and response to phosphate binders in the rat. Journal of Bone and Mineral Research 2011; 26: 2672–2681. [DOI] [PubMed] [Google Scholar]
- 38.Bates D, Mächler M, Bolker BM, Walker SC. Fitting linear mixed-effects models using lme4. Journal of Statistical Software 2015; 67. [Google Scholar]
- 39.Kuznetsova A, Brockhoff PB, Christensen RHB. lmerTestPackage: Tests in Linear Mixed Effects Models. Journal of Statistical Software 2017; 82. [Google Scholar]
- 40.Lenth R emmeans: Estimated Marginal Means, aka Least-Squares Means [Internet]. 2018;Available from: https://CRAN.R-project.org/package=emmeans [Google Scholar]
- 41.Allen MR, Newman CL, Chen N, Granke M, Nyman JS, Moe SM. Changes in skeletal collagen cross-links and matrix hydration in high- and low-turnover chronic kidney disease. Osteoporosis International 2015; 26: 977–985. [DOI] [PMC free article] [PubMed] [Google Scholar]
- 42.Allen MR, Chen NX, Gattone VH et al. Skeletal effects of zoledronic acid in an animal model of chronic kidney disease. Osteoporosis International 2013; 24: 1471–1481. [DOI] [PMC free article] [PubMed] [Google Scholar]


