

Summary
Extracellular vesicles (EVs), including exosomes, modulate multiple aspects of cancer biology. Tumor-associated macrophages (TAMs) secrete EVs, but their molecular features and functions are poorly characterized. Here, we report methodology for the enrichment, quantification, and proteomic and lipidomic analysis of EVs released from mouse TAMs (TAM-EVs). Compared to source TAMs, TAM-EVs present molecular profiles associated with a Th1/M1 polarization signature, enhanced inflammation and immune response, and a more favorable patient prognosis. Accordingly, enriched TAM-EV preparations promote T cell proliferation and activation ex vivo. TAM-EVs also contain bioactive lipids and biosynthetic enzymes, which may alter pro-inflammatory signaling in the cancer cells. Thus, whereas TAMs are largely immunosuppressive, their EVs may have the potential to stimulate, rather than limit, anti-tumor immunity.
Keywords: extracellular vesicle, exosome, tumor microenvironment, tumor-associated macrophage, proteomics, lipidomics, lipid metabolism, inflammation, T cell response
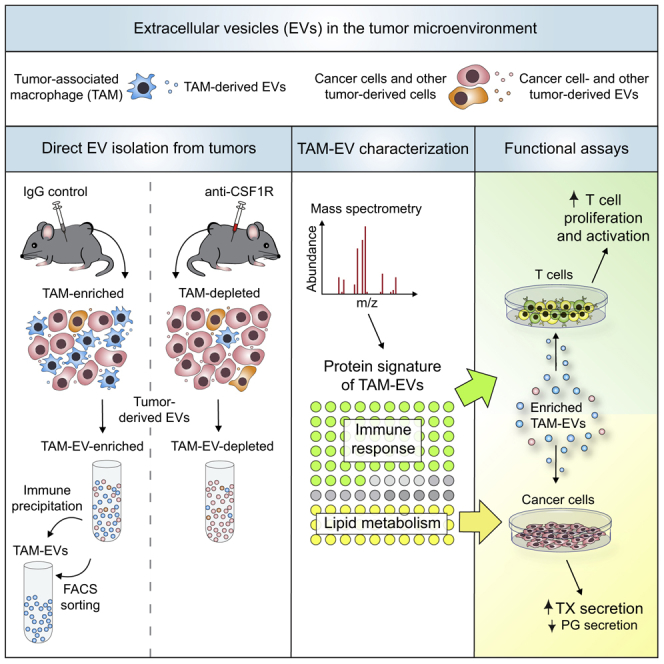
Graphical Abstract
Highlights
-
•
Macrophages produce abundant extracellular vesicles in tumors
-
•
Macrophage-derived extracellular vesicles (TAM-EVs) display unique proteomic profiles
-
•
TAM-EVs enhance thromboxane synthesis in cancer cells
-
•
TAM-EVs promote, rather than limit, T cell proliferation and activation
Cianciaruso et al. develop methods for the analysis of extracellular vesicles secreted by macrophages in mouse tumors (TAM-EVs). Proteomic and lipidomic profiling indicates that TAM-EVs carry modulators of inflammation and lipid metabolism that could influence the properties of the tumor immune microenvironment.
Introduction
Extracellular vesicles (EVs) comprise heterogeneous membrane vesicles released by virtually all cell types (Colombo et al., 2014, Jeppesen et al., 2019, Mathieu et al., 2019, van Niel et al., 2018). EVs are classified according to their size and subcellular origin (Caruso and Poon, 2018, Colombo et al., 2014, Mathieu et al., 2019, van Niel et al., 2018). Exosomes (30–150 nm) originate from late endosomal multivesicular bodies, whereas microvesicles (100–1,000 nm) and apoptotic bodies (100–5,000 nm) derive from the shedding of the plasma membrane during steady-state conditions and cell death, respectively. The study of intercellular communication mediated by EVs has become an important topic in cancer biology. Indeed, tumor-derived EVs have been implicated in various processes during tumor progression, including immunity, angiogenesis, metastasis, and resistance to anticancer therapy (Becker et al., 2016, De Palma et al., 2017, Keklikoglou et al., 2019, Pavlyukov et al., 2018, Ruivo et al., 2017).
Most studies have focused on the characterization of EVs isolated from cancer cells cultured in vitro (Becker et al., 2016, Ruivo et al., 2017). Recent studies have also examined the properties of tissue-derived EVs (Crewe et al., 2018, Loyer et al., 2018, Vella et al., 2017, Zhang et al., 2019), including EVs isolated directly from tumors (Jeppesen et al., 2019, Steenbeek et al., 2018). However, the histological complexity of tumors is such that multiple cell types—and not only cancer cells—may produce EVs whose origins, properties, and effects on the tumor microenvironment (TME) and distant organs are still largely unexplored.
In tumors, cancer cells are admixed with a number of cell types of host origin that modulate tumor progression and response to therapy (Egeblad et al., 2010, Hanahan and Coussens, 2012). Among immune cells, tumor-associated macrophages (TAMs) are prominent host-derived constituents of solid tumors that modulate several aspects of tumor progression, namely angiogenesis, immunosuppression, and cancer cell intravasation and metastasis (De Palma et al., 2017, DeNardo and Ruffell, 2019, Lewis et al., 2016, Mantovani et al., 2017). The genetic elimination of macrophages delays tumor progression by impairing angiogenesis and metastasis (De Palma et al., 2003, Lin et al., 2001). Colony-stimulating factor-1 receptor (CSF1R) is critical for the development and survival of TAMs (Pixley and Stanley, 2004). Accordingly, the anti-CSF1R monoclonal antibody 2G2 (Ries et al., 2014) effectively depletes TAMs and provides therapeutic benefits in combination with antiangiogenic drugs, immune checkpoint inhibitors, and costimulatory molecule agonists (Hoves et al., 2018, Keklikoglou et al., 2018, Neubert et al., 2018). Preclinical studies in mice have encouraged combining macrophage-depleting or reprogramming agents with various frontline anticancer therapies in patients with cancer (Cassetta and Pollard, 2018, De Palma and Lewis, 2013, Quail and Joyce, 2017, Ruffell and Coussens, 2015).
TAMs regulate the functions of various host cell types in the TME, including vascular cells and lymphocytes (De Palma et al., 2017, Mantovani et al., 2017). This regulation is known to primarily involve the production of cytokines and matrix-remodeling enzymes, but the potential participation of macrophage-derived EVs to heterotypic cell communication in tumors has been poorly studied. Owing to the lack of established procedures for isolating macrophage-derived EVs directly from tumors, most studies have investigated EVs purified from cultured macrophages (Chen et al., 2019, Lan et al., 2018, Squadrito et al., 2014, Zhou et al., 2018, Zhu et al., 2015). Notably, TAMs exhibit a high degree of phenotypic and functional plasticity, which depends on the exact properties of the TME in which they reside (Baer et al., 2016, Cassetta and Pollard, 2018, Mantovani et al., 2017). In this study, we characterize the proteomic and lipidomic profiles of TAM-derived EVs, as well as their effects on cancer cells and T cells. Our results suggest that TAM-derived EVs may have functions in the TME that do not necessarily reflect the well-established properties of source TAMs.
Results
TAM Elimination through CSF1R Blockade Enables Differential Enrichment of TAM-EVs from MC38 Colorectal Tumors
We used macrophage-rich MC38 colorectal tumors (Baer et al., 2016, Hoves et al., 2018, Ries et al., 2014) to isolate TAM-derived EVs. We inoculated MC38 cells subcutaneously in C57BL/6 mice and used the anti-CSF1R antibody 2G2 (Baer et al., 2016, Hoves et al., 2018, Ries et al., 2014) to eliminate TAMs from early established (day 4) tumors (Figure S1A). Two spaced doses of 2G2 slightly delayed tumor growth (Figure S1B) and, consistent with previous studies (Baer et al., 2016, Hoves et al., 2018, Ries et al., 2014), markedly reduced F4/80+ TAMs (Figures S1C and S1D). Both M2-like (MRC1+) and M1-like (CD11c+ or MHCII+) TAMs (Movahedi et al., 2010, Pucci et al., 2009, Squadrito et al., 2012) were effectively depleted, according to immunofluorescence staining of tumor sections. Flow cytometry analysis further revealed that ablation of F4/80+ TAMs was associated with a modest increase of Ly6G+Ly6C– neutrophils and granulocytic myeloid-derived suppressor cells (Gabrilovich, 2017) in the CD45+ hematopoietic cell compartment of anti-CSF1R-treated tumors (Figures S1E and S1F).
We reasoned that comparative analysis of intact and macrophage-depleted MC38 tumors could provide a model for investigating TAM-derived EVs. MC38 tumor-bearing mice, either treated with isotype-matched immunoglobulin G (IgG) or anti-CSF1R, were transcardially perfused with PBS shortly before tumor harvesting to limit co-purification of EVs from the intratumoral circulation. To enhance recovery of tumor-derived EVs, we pooled several tumors from the same treatment group prior to non-enzymatic (mild mechanical) tissue dissociation. We then isolated EVs by using established protocols based on sequential centrifugation steps (Cianciaruso et al., 2017, Keklikoglou et al., 2019, Thery et al., 2006). The final high-speed ultracentrifugation (110,000 × g) allows for recovery of enriched EVs, which can be processed through density gradient fractionation to further increase purity (Figure 1A). In MC38 tumors, viable tumor-derived cells accounted for about 90% and 80% of the total cells in IgG and anti-CSF1R treatment groups, respectively (Figure 1B).
Figure 1.

EV Isolation from MC38 Tumors of IgG- and Anti-CSF1R-Treated Mice
(A) Procedure to isolate EVs from IgG- and anti-CSF1R-treated tumors.
(B) Flow cytometry of MC38-tumor-derived cells (day 14 post-tumor challenge; see Figure S1A). Data show percentage values (mean ± SEM; n = 5 mice/condition). Statistics by unpaired two-tailed Student’s t test.
(C) Yield of EVs prior to sucrose fractionation, determined by BCA (mean ± SEM; n = 5 independent EV preparations). Statistics as in (B).
(D) Representative TEM images of EVs obtained as in (C). One representative EV preparation is shown for IgG and anti-CSF1R-treated tumors. Scale bars, 200 nm.
(E) EV concentration and size distribution by NTA (mean ± SEM; n = 3 acquisitions/sample). One representative EV preparation per condition is shown.
(F) Correlation between EV protein content and EV concentration, determined by BCA and NTA, respectively (mean ± SD; n = 3 serial dilutions/sample). A simple linear regression function was used. One representative EV preparation per condition is shown.
(G) WB analysis of cells and matched EVs from cultured MC38 cells or MC38 tumors. One representative cell or EV preparation per condition is shown.
(H) EV protein content and EV concentration in each sucrose fraction, determined by BCA and NTA, respectively (mean of 2–3 technical replicates). One representative EV preparation per condition is shown.
(I) EV concentration and size distribution by NTA (mean ± SEM; n = 3 acquisitions/sample). One representative EV preparation per condition is shown.
(J) Yield of EVs recovered from the third top fraction of the sucrose gradient, determined by BCA (mean ± SEM; n = 5 independent EV preparations). Statistics as in (B).
(K) Representative TEM images of EVs recovered from the third top sucrose fraction. One representative EV preparation per condition is shown. Scale bars, 200 nm.
(L) WB analysis of EVs after sucrose gradient fractionation. Upper panel shows a representative experiment; equal sample volumes were loaded in each lane. Lower panels show relative band intensities of MRC1 and GAPDH (mean ± SEM; n = 3 independent EV preparations, one of which is shown in the WB above). For each protein, the relative signal intensity in each fraction is indicated as percentage of the total signal from all fractions.
(M) Taqman analysis of selected microRNAs (normalized to miR-16-5p; fold-change versus anti-CSF1R-EVs) in EVs after sucrose gradient fractionation (mean ± SEM; n = 3 independent EV preparations). Statistics by two-way ANOVA with Sidak’s multiple comparison test.
Statistical significance of the data: ∗p < 0.05; ∗∗p < 0.01; ∗∗∗p < 0.001; ∗∗∗∗p < 0.0001.
See also Figures S1 and S2.
We first characterized EVs prior to sucrose density fractionation. The recovery yield was about 2 mg of EVs per gram of tumor, in both IgG and anti-CSF1R conditions (Figure 1C). Transmission electron microscopy (TEM) and nanoparticle-tracking analysis (NTA) of EVs did not reveal differences in morphology, concentration, or size distribution between EVs from IgG-treated tumors (IgG-EVs) and EVs from anti-CSF1R-treated tumors (anti-CSF1R-EVs) (Figures 1D–1F). Western blot (WB) analysis of EVs indicated enrichment of EV-associated proteins, such as ALIX and CD81, in EV preparations compared to tumor-derived cells (Figure 1G). However, these EV markers were less enriched in both IgG-EVs and anti-CSF1R-EVs compared to EVs isolated from MC38 cells cultured in a bioreactor (MC38-EVs; Figures 1G and S2A–S2C). These differences could be due to higher heterogeneity of tumor-derived EV populations (Jeppesen et al., 2019, Mathieu et al., 2019).
To improve EV purity, we performed sucrose gradient fractionation, which allows for removing large protein aggregates and enables the separation of membrane vesicles according to density. NTA and bicinchoninic acid assay (BCA) of the recovered sucrose fractions revealed heterogeneous EV populations with densities ranging from 1.10 to 1.20 g/ml in both IgG-EVs and anti-CSF1R-EVs (Figures 1H and 1I). Notably, the majority of EVs were found in the third top (1.14 g/ml) fraction, in agreement with previous work (Bobrie et al., 2012, Crewe et al., 2018, Kowal et al., 2016). The recovery yield after sucrose gradient fractionation was about 0.9 and 0.7 mg of EVs per gram of tumor for IgG-EVs and anti-CSF1R-EVs, respectively, indicating a loss of about 60% of starting EV material (Figure 1J). Similar to unfractionated EVs, TEM analysis of EVs from the third top fraction showed cup-shaped membrane vesicles of variable size (Figure 1K).
Post-fractionation analysis of EVs revealed enrichment of classical EV proteins (ALIX, CD63, TSG101, CD81, and CD9) in the third top fraction (Figure 1L). Expression of the macrophage-specific markers MRC1/CD206 and miR-511-3p, which are encoded by the Mrc1 gene (Squadrito et al., 2012), were markedly lower in anti-CSF1R-EVs (Figures 1L and 1M), consistent with efficient depletion of TAM-derived EVs after CSF1R blockade.
GP96, a protein associated with the endoplasmic reticulum (ER), was detected in the third top fraction. ER proteins are typically considered contaminants of EV preparations (Kowal et al., 2016, Thery et al., 2006); however, their association with secreted EVs has been recently documented (Cianciaruso et al., 2017, Kowal et al., 2016, Steenbeek et al., 2018). To assess whether our non-enzymatic digestion protocol liberated ER vesicles in excess of other methods, we also implemented a method minimally modified from protocols previously used to purify EVs from brain tissue (Vella et al., 2017) or tumors (Steenbeek et al., 2018). This protocol involved enzymatic (collagenase-based) incubation of the tissue and yielded slightly fewer and more heterogeneous EVs compared to isolation after non-enzymatic tissue dissociation, as shown by NTA (Figure S2D). Nevertheless, we did not observe major differences between the two methods when we examined EV- and ER-associated proteins by WB (Figure S2E), even after immunoprecipitation (IP) of EVs with anti-CD9-coated beads (Figure S2F). Overall, these results indicate that tumor-derived EVs, either comprising or depleted of TAM-derived EVs, display physical properties and features of bona fide small EVs.
Comparative Proteomic Analysis of IgG-EVs and Anti-CSF1R-EVs Identifies a TAM-EV Protein Profile
We then examined the proteome of IgG-EVs and anti-CSF1R-EVs by liquid chromatography-tandem mass spectrometry (LC-MS/MS). We selected proteins that were differentially represented in IgG-EVs and anti-CSF1R-EVs by setting a mean fold-change (FC) of >1.7 as arbitrary threshold (Tables S1 and S2). We then performed Gene Ontology (GO) enrichment analysis of differentially represented EV proteins identified prior to or after sucrose gradient fractionation (Figure 2A; Table S1). EV preparations prior to sucrose fractionation were enriched in RNA-associated proteins, whereas EVs recovered from the third top sucrose fraction were enriched in proteins implicated in immune responses, lipid metabolism, and vesicle trafficking. Interestingly, we did not detect RNA-related GO terms in EVs after sucrose fractionation, suggesting that proteins of the RNA machinery are likely contaminants of EV preparations, consistent with recent work (Jeppesen et al., 2019). These observations motivated us to focus subsequent studies on tumor-EVs obtained by sequential centrifugation followed by density fractionation.
Figure 2.

Enrichment and Interactome Analysis of EV Proteins
(A) LC-MS/MS-based GO enrichment analysis, prior to and after sucrose gradient fractionation, of MC38 EV-associated proteins, whose fold-change (FC) abundance was > 1.7 in IgG-EVs versus anti-CSF1R-EVs. Data were generated from 2 independent EV preparations.
(B and C) LC-MS/MS-based immune cell enrichment (B) and interactome (C) analysis of MC38 EV-associated proteins (IgG versus anti-CSF1R, FC > 1.7) obtained after sucrose gradient fractionation. Data were generated from 4 independent EV preparations. Three proteins (LRRC25, CYP4F3, and CD300LD4) were not detected in the Immuno-Navigator database.
An analysis of four independent tumor-derived EV preparations produced a list of 81 proteins (TAM-EV proteins) consistently decreased after anti-CSF1R treatment (IgG versus CSF1R, FC >1.7; Table S2). We then implemented the 81-protein profile to enrichment analysis with Immuno-Navigator, a database for gene co-expression in cells of the immune system (Vandenbon et al., 2016). As expected, many proteins matched to genes highly expressed in macrophages, dendritic cells, and monocytes (Figure 2B). The Search Tool for the Retrieval of Interacting Genes/Proteins (STRING)-based protein association analysis predicted multiple interactions (Figure 2C) among proteins involved in macrophage biology, Toll-like receptor (TLR) signaling, complement cascade, lipid metabolism, signal transduction, cell adhesion, and immune response and inflammation (Figures 3A–3G). We confirmed by WB analysis the enrichment of MRC1 and TMEM173, also known as stimulator of interferon genes (STING), in IgG-EVs compared to both tumor-derived cells and anti-CSF1R-EVs (Figure 3H). We obtained similar results when we applied an enzymatic incubation-based protocol (Steenbeek et al., 2018, Vella et al., 2017) to isolate EVs (Figures S2G and S2H).
Figure 3.

Proteomic Analysis of IgG-EVs and Anti-CSF1R-EVs and Comparison with BMM-EVs and MC38-EVs
(A–G) LC-MS/MS and classification of TAM-EV proteins (criteria: IgG versus anti-CSF1R FC > 1.7) according to their associated pathways. Data show normalized quantitative values (mean ± SEM; n = 4 independent EV preparations). Statistics by two-way ANOVA with Holm-Sidak’s multiple comparison test.
(H) WB analysis of cells and EVs from tumors, MC38 cells, and M2 macrophages (BMM). One representative EV preparation per condition is shown.
(I) Schematic of EV isolation (left) and Venn diagram (right) comparing proteins detected by LC-MS/MS in MC38-EVs (3 independent EV preparations) and M1 and M2 BMM-EVs (2 independent EV preparations).
(J) Classical macrophage markers in M1 and M2 BMM-EVs. Data show mean quantitative values normalized to ALIX (2 independent EV preparations).
(K and L) Venn diagrams comparing proteins enriched in IgG-EVs versus anti-CSF1R-EVs (FC > 1.7; K) or anti-CSF1R-EVs versus IgG-EVs (FC > 1.7; L) with those detected in MC38-EVs and M1 and M2 BMM-EVs.
(M) MC38-tumor-derived EV proteins of likely neutrophil origin (anti-CSF1R/IgG FC > 1.7). Data show normalized quantitative values (mean ± SEM; n = 4 independent EV preparations). Statistics as in (A).
We next asked if our comparative approach accurately identified macrophage-specific proteins. To this aim, we performed LC-MS/MS protein analysis of MC38-EVs and EVs isolated from cultured M1- or M2-polarized bone marrow macrophages (BMM-EVs) obtained after stimulation with interferon-gamma (IFNγ) plus lipopolysaccharide (LPS) or interleukin-4 (IL-4), respectively (Figures 3I and 3J; Table S3). Although many proteins were shared by all EV preparations, only 5 (∼6%) of the 81 TAM-EV proteins were detected in MC38-EVs, whereas 36 (∼44%) were also detected in BMM-EVs (Figure 3K). Moreover, we selected EV proteins increased in anti-CSF1R-EVs (i.e., after TAM elimination; FC >1.7; Table S3) and analyzed their degree of similarity with proteins detected in MC38-EVs and BMM-EVs. Out of the 68 proteins enriched in anti-CSF1R-EVs, 41 (∼60%) were also detected in MC38-EVs, whereas only 12 (∼18%) were detected in BMM-EVs, 9 of which were also present in MC38-EVs (Figure 3L). Of note, some of the enriched proteins were typical neutrophil-associated proteins (Figure 3M), consistent with the relative increase of neutrophils in TAM-depleted tumors (see Figures S1E and S1F).
In summary, the aforementioned data indicate that EV-associated proteins that decrease after anti-CSF1R treatment of MC38 tumors are strongly indicative of TAM-EV-associated proteins. Conversely, proteins that increase in tumor-derived EVs after anti-CSF1R are, at least partly, indicative of proteins associated with cancer cell- and neutrophil-derived EVs.
Macrophages and Cancer Cells Are the Main Cellular Sources of EVs in MC38 Tumors
We then sought to determine the relative contribution of distinct cell types to EVs in MC38 tumors. In LysM.Cre/ROSAmT/mG transgenic mice (Clausen et al., 1999, Muzumdar et al., 2007), the ROSAmT/mG locus directs ubiquitous expression of tdTomato, which switches to GFP expression in myeloid cells that express the Cre recombinase under the LysM promoter. Owing to their membrane-targeted localization, tdTomato and GFP may be transferred to EVs, thus allowing for tracing EVs of different cellular origin.
Confocal imaging and flow cytometry analysis indicated that that 99% of CD11b+F4/80+ BMMs derived from LysM.Cre/ROSAmT/mG mice were indeed GFP+ (Figures S3A and S3B). A small fraction of the cells (∼8%) were GFP/tdTomato double positive, possibly due to recent Cre recombination and incomplete fluorescence switch, whereas less than 1% were tdTomato single positive, hence of non-myeloid origin. As expected, we did not detect GFP in BMMs of wild-type and control ROSAmT/mG mice. Immunofluorescence analysis of the cells confirmed membrane localization of GFP, in particular, at the plasma membrane and in RAB7+ late endosomes (Figure S3C).
We characterized EVs purified from BMMs of LysM.Cre/ROSAmT/mG and ROSAmT/mG mice by WB, NTA, and TEM (Figures S3D–S3F). GFP was detected in BMM-EVs of LysM.Cre/ROSAmT/mG mice, whereas it was barely detectable in BMM-EVs of control ROSAmT/mG mice and absent in MC38-EVs, according to WB analysis. We also confirmed green and red fluorescence of BMM-EVs of LysM.Cre/ROSAmT/mG and ROSAmT/mG mice, respectively, by flow cytometry (Figure S3G).
We then inoculated MC38 cancer cells in LysM.Cre/ROSAmT/mG mice, which were treated as shown in Figure S1A above. In that setting, tumor-associated cells were fluorescent as follows: myeloid cells (mostly TAMs in the IgG condition) were largely GFP+/tdTomato– and partly GFP+/tdTomato+; non-myeloid host cells were GFP–/tdTomato+; and MC38 cancer cells were GFP–/tdTomato– (Figures 4A, S4A, and S4B). Next, we collected tumor-derived EVs (Figure 4A) and immunoprecipitated them with anti-CD9-coated magnetic beads. Notably, WB analysis revealed GFP in CD9+ IgG-EVs but much less so in CD9+ anti-CSF1R-EVs, confirming marked depletion of TAM-EVs after anti-CSF1R treatment. In line with results shown above, IP of MC38-EVs, IgG-EVs, and anti-CSF1R-EVs by anti-CD9-coated beads enriched both CD81 and the ER protein calnexin (CANX; Figure 4B).
Figure 4.

Quantification of TAM-EVs and Validation of the TAM-EV Protein Signature by IP of CD11b+ Tumor-Derived EVs
(A) Procedure to isolate EVs from MC38 tumors grown in LysM.Cre/ROSAmT/mG mice.
(B) WB analysis of EVs isolated from cultured MC38 cells or MC38 tumors grown in LysM.Cre/ROSAmT/mG mice, after IP with anti-CD9 or control-coated magnetic beads. One representative EV preparation per condition is shown.
(C and D) Flow cytometry analysis of tumor-EVs isolated from wild-type (WT) or LysM.Cre/ROSAmT/mG mice. Data show representative dot plots of GFP and tdTomato (C) and quantitative values (mean ± SD; n = 3 independent experiments; D). Statistics by two-way ANOVA, using Sidak’s multiple comparison test.
(E) LC-MS/MS analysis of EVs showing quantitative values (mean ± SEM; n = 4 or 3 independent preparations) for CD11b, ALIX, and CD81, normalized to CD9. Statistics by two-way ANOVA, using Tukey’s multiple comparison test.
(F) IP procedure for capturing CD11b+ EVs.
(G) Flow cytometry analysis of PKH67-labeled EVs bound to anti-CD9, anti-CD11b or isotype-control beads. Data show percentage values (mean ± SEM; n = 4 and 5 preparations for CD11b and CD9 IP, respectively).
(H) WB analysis of tumor-derived EVs after IP. One representative EV preparation per condition is shown.
(I) Venn diagrams comparing proteins enriched in IgG-EVs versus anti-CSF1R-EVs (FC > 1.7; see Table S2) with those detected in CD11b+ IgG-EVs after IP (FC versus isotype control beads > 2; see Table S4). IP was performed on the same IgG-EV preparation shown in (H).
(J) Radial table reporting the 62 proteins of the MC38 TAM-EV signature and their association with biological pathways. The graphical representation limits connection of each protein to two pathways (see also Table S5).
(K) The data in (I) are shown after removing potential protein contaminants identified according to the CRAPome database.
See also Figures S3, S4, S5, and S6.
To quantitate tumor-derived EVs of different cellular origin, we labeled them with the lipophilic fluorescent dye DiR before flow cytometry to distinguish them from background noise (Figures 4C, 4D, S4C, and S4D). GFP+/tdTomato– EVs (mostly deriving from TAMs) were the majority (average 57%) of IgG-EVs and the minority (average 18%) of anti-CSF1R-EVs (Figures 4C and 4D), consistent with TAM depletion. Cancer-cell-derived GFP–/tdTomato– EVs, which represented 29% of the total IgG-EVs, increased up to 64% in anti-CSF1R-EVs. GFP+/tdTomato+ and GFP–/tdTomato+ EVs were scarce in both IgG-EVs and anti-CSF1R-EVs, and their proportions did not significantly change after TAM depletion. Overall, these data indicate that TAMs and cancer cells are the main sources of EVs in IgG- and anti-CSF1R-treated MC38 tumors, respectively, consistent with the EV-associated protein profiles shown in Figure 3 above.
Lastly, we performed LC-MS/MS of GFP+/tdTomato– and GFP–/tdTomato– IgG-EVs isolated by fluorescence-activated cell sorting (FACS). Due to the limited amounts of GFP+ EVs recovered after sorting, we were only able to detect the most abundant proteins in the TAM-EV profile (Figure S4E). Nevertheless, all measurable TAM-EV proteins, as well as GFP, were either absent or exceedingly scarce in GFP–/tdTomato– EVs.
Immunoisolation and Analysis of CD11b+ EVs Corroborate a TAM-EV Protein Signature
The differential proteomic analysis of IgG-EVs and anti-CSF1R-EVs shown above could not rule out proteins associated with EVs from cellular sources other than TAMs, for example, cell types whose abundance and biology in tumors are indirectly altered by macrophage depletion (Cassetta and Pollard, 2018). Thus, we sought to validate the TAM-EV protein profile with a second approach. We used anti-CD11b-coated magnetic beads to immunoprecipitate CD11b+ EVs from MC38-tumor-derived EVs (Figure 4E). This procedure (Figure 4F) enriched EVs secreted by CD11b+ myeloid cells (Figures 4G and 4H; Figures S5A–S5C), of which macrophages and monocytes constitute the vast majority (> 90%) in IgG-treated tumors (see Figures S1E and S1F above). The IP was specific, as neither MC38-EVs (Figure 4G) nor HER2+-cancer-cell-derived EVs isolated from HER2+ MC38 tumors (Figures S5D, S5E and S5F) grown in human HER2-tolerant Wap-ERBB2 mice (Piechocki et al., 2003) did bind to anti-CD11b-coated beads. LC-MS/MS analysis showed that, of the 81 proteins in the TAM-EV profile determined by the comparative analysis of IgG-EVs and anti-CSF1R-EVs, 62 were also enriched in CD11b+ IgG-EVs (FC versus control beads, >2; Figures 4H–4J; Table S4). Importantly, the number of shared proteins was not altered by the removal of potential IP contaminants (Figure 4K) identified in the Contaminant Repository for Affinity Purification of Mass Spectrometry Data (CRAPome) database (Mellacheruvu et al., 2013).
In summary, two complementary strategies identified a 62-protein signature for TAM-EVs of MC38 tumors, which encompasses proteins involved in immune response and inflammation but also lipid transport and metabolism, cell adhesion, migration, and signal transduction (Figure 4J; Table S5). Notably, the contribution of non-macrophage, myeloid-derived EVs to the TAM-EV protein signature was arguably negligible, as IgG-treated MC38 tumors contained scarce granulocytic infiltrates.
TAM-EVs Display an M1-like TAM Signature and Promote T Cell Proliferation and Activation
As shown above, CD11b+ cells of MC38 tumors are mostly macrophages or monocytes (Figures S1E and S1F). To compare the TAM-EV protein signature with that of source cells (TAM-Cells), we performed LC-MS/MS of CD11b+ cells isolated by FACS from IgG- and anti-CSF1R-treated MC38 tumors (Figure S6A; Table S6). Of the consolidated 62-protein TAM-EV signature, 37 were also enriched in TAM-Cells of IgG-treated tumors (versus anti-CSF1R; FC > 1.7), indicating partial overlap between the profiles of TAM-Cells and TAM-EVs (Figure S6B). Similar to TAM-EVs, GO enrichment analysis of TAM-Cells identified processes involved in immune regulation (Figure S6C; Table S6). However, contrary to TAM-EVs, we did not identify lipid metabolism among the top 20 GO terms, suggesting a potential enrichment of lipid metabolism-associated proteins in EVs compared to source TAMs.
We then used previously described gene expression data of FACS-sorted murine M1-like and M2-like TAMs (Squadrito et al., 2012) to ask whether protein signatures of TAM-Cells and TAM-EVs reflected an M1-like or M2-like profile. Interestingly, although TAM-Cells bore resemblance to an M2-like phenotype, the TAM-EV signature better represented an M1-like phenotype (Figure 5A).
Figure 5.

Immunomodulatory Profile and Functions of TAM-EVs
(A and B) Gene set enrichment analysis (GSEA) plots showing the correlation of TAM (TAM-Cell) and TAM-EV protein signatures with genes expressed in FACS-sorted M1-like or M2-like TAMs (A) or prognostic genes across human cancers recorded in the PRECOG database (B).
(C) Flow cytometry analysis of CD8+ T cells obtained after priming OT-I splenocytes.
(D) Schematic of the experiment shown in (E–G).
(E and F) Flow cytometry analysis of CD8+ OT-I proliferation assessed by CellTrace dilution.
(E) Representative flow profiles.
(F) Quantification of the data (mean ± SEM; n = 4 cell cultures/condition). Statistics by two-way ANOVA, using Sidak’s multiple comparison test.
(G) ELISA-based quantification of IFNγ in medium conditioned by OT-I CD8+ T cells. Data are shown as mean ± SEM (n = 4 cell cultures/condition). Statistics as in (F).
(H) Flow cytometry analysis of CD8+ T cells purified from the spleen of C57BL/6 mice.
(I) Schematic of the experiment shown in (J and K).
(J) Flow cytometry analysis of CD8+ T cell proliferation assessed by CellTrace dilution (mean ± SEM; n = 4 cell cultures/condition). Statistics by one-way ANOVA, using Tukey’s multiple comparison test.
(K) ELISA-based quantification of IFNγ in medium conditioned by CD8+ T cells (mean ± SEM; n = 4 cell cultures/condition). Statistics as in (J).
(L) Flow cytometry analysis of CD4+ T cells purified from the spleen of BALB/c mice.
(M) Schematic of the experiment shown in (N).
(N) Flow cytometry analysis of CD4+ T cell proliferation assessed by CellTrace dilution (mean ± SEM; n = 4 cell cultures/condition). Statistics as in (J).
(O) Schematic of the experiment shown in (P).
(P) Flow cytometry analysis of activation markers (mean fluorescence intensity, MFI) in CD11b+CD11c+ BMDCs (mean ± SEM; n = 4 cell cultures/condition). Statistics by two-way ANOVA, using Dunnett’s multiple comparison test (each treatment condition versus control DMSO).
Because M1 and M2 TAM phenotypes correlate with anti- and pro-tumoral properties, respectively (Baer et al., 2016, Cassetta and Pollard, 2018, Mantovani et al., 2017), we asked whether the signatures of TAM-Cells and TAM-EVs could associate with differential clinical outcome in patients with cancer by using the Prediction of Clinical Outcomes from Genomics (PRECOG) database (Gentles et al., 2015). Interestingly, although the TAM-Cell signature correlated neither with a good nor bad clinical outcome, the TAM-EV signature strongly correlated with improved survival (Figure 5B).
M1-like TAMs may have T cell stimulatory activity in tumors (Baer et al., 2016, Cassetta and Pollard, 2018, Mantovani et al., 2017). Because TAM-EVs display an M1-like signature, we hypothesized that they could stimulate CD8+ T cell proliferation and activation. To this aim, we generated antigen-specific CD8+ T cells from transgenic OT-I mice, whose T cell receptor specifically recognizes the ovalbumin (OVA) peptide SIINFEKL loaded on MHC-I/H-2kB (Hogquist et al., 1994). We primed splenic OT-I cells with SIINFEKL for 1 h and expanded CD8+ T cells in the presence of IL-2 for 4 days (Figure 5C). We then exposed them to IgG-EVs or anti-CSF1R-EVs for 24 h (Figure 5D) and examined CD8+ T cell proliferation by using the CellTrace Violet tracer (Figure 5E). Notably, whereas anti-CSF1R-EVs did not affect cell proliferation, IgG-EVs significantly enhanced it, suggesting a TAM-EV-dependent effect (Figures 5E and 5F). Furthermore, the presence of TAM-EVs both accelerated and enhanced IFNγ secretion by CD8+ T cells, as shown by comparing results obtained at 24 h and 48 h (Figure 5G). To validate these results in another model, we used CD8+ T cells isolated from non-transgenic C57BL/6 mice (Figure 5H); in these experiments, naive CD8+ T cells were concomitantly primed with anti-CD3/CD28 beads and incubated with EVs (Figure 5I). As seen with OT-I cells, TAM-EV-containing IgG-EVs enhanced both the proliferation and IFNγ secretion by activated T cells (Figure 5J and 5K). Finally, we examined whether TAM-EVs could support CD4+ T cell proliferation in an allogenic assay involving incubation of CD4+ T cells of BALB/c origin (Figure 5L) with EVs of C57BL/6 origin (Figure 5M). Only IgG-EVs promoted CD4+ T cell proliferation (Figure 5N), again suggesting the requirement of TAM-EVs for T cell activation and proliferation. Of note, both IgG-EVs and anti-CSF1R-EVs had negligible effects on the expression of activation markers of bone-marrow-derived dendritic cells (BMDCs), such as CD80, CD86, MHC-II, and CD40 (Figures 5O and 5P). Together, these data argue that TAM-EVs may have direct T-cell-stimulatory capacity.
TAM-EVs Carry the Biosynthetic Machinery for Thromboxane Production
Several proteins in the TAM-EV signature (see Figure 4J above) are involved in lipid metabolism. In particular, CYP4F3, TBXAS1, COX1, and CYP4F16 participate in the biosynthesis of lipid metabolites derived from arachidonic acid (AA), such as prostaglandins (PGs), leukotrienes (LTs), and thromboxanes (TXs). These lipids, broadly referred to as eicosanoids, are signaling molecules of exceptional importance during inflammation and its resolution and have been extensively studied in the context of cancer (Colby et al., 2018, Li et al., 2017, Wang and Dubois, 2010). Eicosanoids are produced by both cancer cells and tumor-associated cells, including macrophages, and appear to possess both pro- and anti-tumoral properties (Colby et al., 2018). It was recently reported that the origin of eicosanoids might also involve transcellular mechanisms (Colby et al., 2018, Fabre et al., 2002), implicating EVs as carriers of these lipids or the enzymes involved in their biosynthesis (Boilard, 2018, Esser et al., 2010, Lukic et al., 2016, Lukic et al., 2018, Majumdar et al., 2016, Sagini et al., 2018, Subra et al., 2010). Therefore, we sought to examine lipids and enzymes of the AA pathway in tumor-derived EVs.
LC-MS/MS proteome analysis of IgG-EVs, anti-CSF1R-Evs, and MC38-EVs (see Tables S2 and S3 above) pinpointed enzymes involved in the three main branches of AA metabolism (Figure 6A): (1) cyclooxygenase (COX) pathway, which produces PGs and TXs; (2) lipoxygenase (LOX) pathway, involved in the biosynthesis of LTs and hydroxyeicosatetraenoic acids (HETEs); and (3) cytochrome P450 epoxygenase (CYP) pathway, which catalyzes the biosynthesis of diverse lipid intermediates, including epoxygenated fatty acids (EETs) (Wang and Dubois, 2010). The phospholipase A2 (PLA2), which releases AA from phospholipids, was detected at low levels in the three EV populations (Figure 6B). Both COX1 and TX A synthase 1 (TBXAS1) were strongly enriched in TAM-EVs (based on their differential representation in IgG-EVs versus anti-CSF1R-EVs) and virtually undetectable in MC38-EVs. Conversely, COX2 and PG E synthases (PTGES2 and PTGES3) were not enriched in TAM-EVs and were detectable in MC38-EVs, suggesting preferential loading into cancer-cell-derived EVs. With the exception of CYP1B1, enzymes of the CYP pathway were mostly associated with TAM-EVs. Enzymes of the LOX pathway, especially leukotriene-A4 hydrolase (LTA4H), were abundant in MC38-EVs and were not enriched in TAM-EVs. Glutathione-S-transferases (GSTO1, GSTO1, and GSTM1), which are common to both LOX and COX pathways, also appeared enriched in cancer-cell-derived EVs. We confirmed enrichment of TBXAS1 and COX1 in IgG-EVs compared to anti-CSF1R-EVs or source cells by WB analysis (Figure 6C).
Figure 6.

Molecular and Functional Lipidomic Profile of TAM-EVs
(A) Schematic illustrating AA metabolism.
(B) LC-MS/MS proteome analysis of EVs showing enzymes involved in eicosanoid synthesis. Data show quantitative values (mean ± SEM; n = 4 and 3 independent preparations of MC38-tumor-derived EVs and MC38-EVs, respectively). Statistics by two-way ANOVA, using Tukey’s multiple comparison test.
(C) WB analysis of cells and EVs from cultured MC38 cells or MC38 tumors. One representative EV preparation per condition is shown.
(D) AA concentration (mean ± SEM; n = 4 independent EV preparations) determined by LC-MS/MS-based absolute quantification using calibration curves of internal standards. Statistics by unpaired two-tailed Student’s t test.
(E) TXB2 concentration (mean ± SEM; n = 4 independent EV preparations) determined by LC-MS/MS-based relative quantification of ion counts. Statistics as in (D).
(F) Schematic illustrating putative thromboxane synthesis in TAM-EVs.
(G) Quantification of eicosanoids, mostly PGs (left) and their precursor AA (right), in MC38 tumors (mean ± SEM; n = 6 mice/condition) by LC-MS/MS lipidomics. Statistics by two-way ANOVA, using Sidak’s multiple comparison test (left) or unpaired two-tailed Student’s t test (right).
(H) CD8+ T cell proliferation in response to PGE2 or PGF2α; the left panel shows the experimental design. The right panel shows flow cytometry analysis of CD8+ T cell proliferation assessed by CellTrace dilution (mean ± SD; n = 3 cell cultures/condition). Statistics by one-way ANOVA, using Dunnett’s multiple comparison test (each PG concentration versus control DMSO).
(I) Confocal analysis of MC38 cells incubated with PKH67-labeled MC38 IgG-EVs (green). Nuclei are stained with 4′,6-diamidino-2-phenylindole (DAPI; blue). The merged panel is shown on the left. One representative experiment is shown. Scale bar, 10 μm.
(J) WB analysis of MC38 cells incubated with EVs isolated from LysM.Cre/ROSAmT/mG mice. One representative EV preparation per condition is shown.
(K) Schematic of the experiment shown in (L–N).
(L and M) Quantification of PUFAs (L) and eicosanoids (M) in medium conditioned by MC38 cells (mean ± SEM; n = 4 cell cultures/condition) by LC-MS/MS. Statistics as in (B).
(N) ELISA-based quantification of PGE2 and TXB2 (mean ± SEM; n = 4 cell cultures/condition) in medium conditioned by MC38 cells. Statistics by one-way ANOVA, using Tukey’s multiple comparison test.
See also Figure S7.
We then performed lipid profiling by reversed-phase liquid chromatography coupled to high-resolution mass spectrometry (RPLC-HRMS) of four independent preparations of IgG-EVs and anti-CSF1R-EVs isolated from MC38 tumors. Complex lipids (e.g., glycerophospholipids, glycerolipids, sphingolipids, and fatty acyls) were not differentially represented in IgG-EVs and anti-CSF1R-EVs (Figure S7A). In addition, IgG-EVs and anti-CSF1R-EVs did not differ in their content of eicosanoid precursors, including AA (Figure 6D) and other polyunsaturated fatty acids (PUFAs), such as eicosapentaenoic acid (EPA) and docosahexaenoic acid (DHA) (Figure S7B) (Dennis and Norris, 2015). Also, we did not detect differences in the content of eicosanoids (Figure S7C), with the exception of TX B2 (TXB2), an inactive metabolite of TX A2 (TXA2), which was identified only in IgG-EVs (Figure 6E). TXA2 is produced by TBXAS1 and, owing to its low chemical stability, is typically monitored by assessing its metabolite TXB2 (Colby et al., 2018).
In summary, proteomic and lipidomic analysis of TAM-EVs showed enrichment of precursor AA, COX1 and TBXAS1 enzymes, and final product TXB2, suggesting that TAM-derived EVs carry the biochemical machinery required for the synthesis of TXs (Figure 6F).
TAM-EVs Alter PG and TX Production by Cancer Cells
The aforementioned results prompted us to question whether TAM elimination may influence eicosanoid production in the TME. We performed lipidomic analysis of whole MC38 tumors after IgG or anti-CSF1R treatment. Several PGs and their metabolites (including PGF2α, PGE1, and PGE2), which are synthesized by COX enzymes, namely COX2 and PGESs (Wang and Dubois, 2010), increased significantly in TAM-depleted tumors (Figure 6G). Importantly, macrophage depletion did not affect the relative abundance of eicosanoids produced through COX-independent pathways, such as 8,9-DiHETrE and 9-KODE, as well as the concentration of the common precursor AA. Some PGs that increased in TAM-depleted MC38 tumors, such as PGE2 and PGF2α, possess protumoral and immunosuppressive properties (Wang and Dubois, 2010), as also shown by their capacity to suppress CD8+ T cell activation in vitro (Figure 6H).
We then asked if TAM-EVs could alter lipid metabolism in recipient cancer cells. To this aim, we performed functional assays with cultured MC38 cells exposed to IgG-EVs or anti-CSF1R-EVs. MC38 cells internalized both IgG-EVs and anti-CSF1R-EVs (Figures 6I, 6J, and S7D) without activating apoptotic pathways (Figure S7E). Twenty-four h after exposure to PBS, IgG-Evs, or anti-CSF1R-EVs, MC38 cells were washed and stimulated with a calcium ionophore. We then analyzed the conditioned media with LC-MS/MS targeted to eicosanoids and their precursors, PUFAs (Figures 6K–6M). Although we did not observe significant differences in the release of PUFAs, the levels of some PGs, including the PGF2α, dropped in media conditioned by MC38 cells pre-treated with IgG-EVs. We did not observe effects on 11-HETE and 9-KODE, which are produced through COX-independent pathways. Because these mass spectrometry (MS)-based analyses neither discriminated between PGE2 and PGD2 nor detected TXs, we processed conditioned media by ELISA of PGE2 and TXB2. Both IgG-EVs and anti-CSF1R-EVs enhanced the release of PGE2 and TXB2 from MC38 cells (Figure 6N). However, IgG-EVs stimulated MC38 to produce higher TXB2 and lower PGE2 amounts compared to anti-CSF1R-EVs, suggesting that TAM-EVs enhance the COX1/TBXAS1 while inhibiting the COX2/PGES-dependent pathway in cancer cells.
TAM-EVs Isolated from E0771 Mammary Tumors Contain PG and TX Biosynthetic Enzymes
To corroborate our results, we also examined IgG-EVs and anti-CSF1R-EVs obtained from the E0771 mammary tumor model. We injected E0771 cells subcutaneously in C57BL/6 mice and treated early established tumors with three doses of control IgG or anti-CSF1R (2G2) antibody (Figure 7A). Tumors were then harvested and processed individually.
Figure 7.

Molecular and Functional Analysis of E0771 TAM-EVs
(A) Schedule of subcutaneous E0771 cancer cell inoculation in C57BL/6 mice and drug administration.
(B) Flow cytometry analysis of immune infiltrates in E0771 tumors. Data show percentage values (mean ± SD; n = 3 mice/condition). Statistics by unpaired two-tailed Student’s t test (left and middle) or two-way ANOVA, using Sidak’s multiple comparison test (right).
(C) Yield of EVs recovered from E0771 tumors prior to and after sucrose gradient fractionation, determined by BCA (mean ± SD; n = 3 EV preparations/condition). Statistics by unpaired two-tailed Student’s t test.
(D) EV concentration and size distribution by NTA in the 6 sucrose fractions (mean ± SEM; n = 3 EV preparations/condition).
(E) EV protein content and EV concentration in each sucrose fraction determined by BCA and NTA, respectively (mean ± SD; n = 3 EV preparations/condition).
(F) Representative TEM images of EVs. One representative EV preparation per condition is shown. Scale bars, 200 nm.
(G) WB analysis of cultured E0771 cells and matched EVs. One representative EV preparation is shown.
(H and I) WB analysis of E0771 tumor-EVs (H). Relative signal quantification of MRC1, COX1, and TBXAS1 is shown in (I) as mean band intensity normalized to CD9 (n = 3 EV preparations/condition). Statistics as in (C).
(J) Venn diagrams comparing proteins enriched in IgG-EVs versus anti-CSF1R-EVs from E0771 tumors (FC > 1.7; see Table S7) with those of the MC38 TAM-EV signature (see Table S5).
(K) LC-MS/MS analysis of TBXAS1 in E0771 tumor-EVs (mean ± SD; n = 3 EV preparations/condition). Statistics as in (C).
(L) ELISA-based quantification of TXB2 in medium conditioned by E0771 cells (mean ± SD; n = 3 EV preparations/condition). Statistics by one-way ANOVA, using Tukey’s multiple comparison test.
Macrophages accounted for about 40%–50% of all myeloid cells in E0771 tumors (Figure 7B). Flow cytometry analysis demonstrated marked reductions of TAMs and compensatory expansion of monocytes in anti-CSF1R-treated tumors, whereas neutrophil numbers remained low irrespective of treatment (Figure 7B). We then isolated tumor-derived IgG-EVs and anti-CSF1R-EVs, as described for MC38 tumors above, and analyzed them by BCA, NTA, and TEM (Figures 7C–7F). Because E0771 cells lack CD81 expression (Vences-Catalán et al., 2015; Figure 7G), we performed quantitative WB analysis of proteins of interest in E0771 tumor-EVs by normalizing expression to CD9 (Figures 7H and 7I). MRC1 and both COX1 and TBXAS1 were lower in anti-CSF1R-EVs compared to IgG-EVs, consistent with data obtained in MC38 tumors.
We then performed LC-MS/MS of E0771 tumor-EVs (Table S7). Notably, 24 proteins in the 62-protein MC38 TAM-EV signature (see Figures 4I–4K above) were also enriched in IgG-EVs versus anti-CSF1R-EVs (FC > 1.7) of E0771 tumor-EVs (Figure 7J). These included TBXAS1, which was significantly depleted in anti-CSF1R-EVs (Figure 7K).
Lastly, we exposed E0771 cancer cells to E0771-tumor-derived IgG-EVs and anti-CSF1R-EVs and, 24 h later, measured PGE2 and TXB2 release in the conditioned media by ELISA (Figure 7L). Whereas PGE2 was below the detection limit of the assay in all conditions, IgG-EVs and to a lesser extent anti-CSF1R-EVs increased TXB2 production by cancer cells. Taken together, these results confirm key findings in MC38-tumor-derived TAM-EVs and support the notion that TAM-derived EVs may stimulate TX production by recipient cancer cells in the TME.
Discussion
Although many studies have demonstrated EV-mediated transfer of biological molecules to recipient cells (Kowal et al., 2016, Majumdar et al., 2016, Squadrito et al., 2014, van Niel et al., 2018), attention has been drawn recently on the implications of EV heterogeneity (Bobrie et al., 2012, Mathieu et al., 2019). Indeed, the repertoire of EVs that are secreted in complex systems, such as tumors or normal tissues, is expected to greatly exceed that of cultured cells. For example, we found that although the relative abundance of cancer cells and macrophages was similar in MC38 tumors, the large majority (60%) of EVs were TAM-derived. This suggests that TAMs may produce amounts of EVs that could influence the biology of other cell types of the TME, including cancer cells and T cells, either through membrane contacts or upon EV fusion and transfer of functional molecules.
In this study, we performed comparative analysis of the proteomes of EVs secreted from MC38 colorectal tumors treated with either an irrelevant antibody (IgG-EVs) or the macrophage-depleting antibody 2G2 (anti-CSF1R-EVs). By comparing datasets, we compiled a list of TAM EV-associated proteins, which was further refined by implementing an IP strategy based on positive selection of CD11b+-myeloid-cell-derived EVs. The resulting dataset identified a TAM-EV signature of 62 proteins, many of which were undetected in EVs from cultured macrophages. Of note, more than one-third of the MC38 TAM-EV-signature proteins were also detected in TAM-EVs isolated from E0771 mammary carcinomas.
Proteins associated with the ER compartment, such as CANX and GP96, are generally regarded as contaminants of EV preparations. We detected ER proteins in tumor-derived EV preparations also after sucrose gradient fractionation, which should separate bona fide EVs (1.14 g/ml mean density) and ER vesicles (1.20 g/ml mean density), as well as after direct IP of CD9+ EVs. In agreement with findings of Steenbeek et al. (2018), we detected ER-associated proteins in tumor-derived EVs also using a protocol based on enzymatic tissue digestion. Interestingly, ER proteins were not detected in brain-derived EVs after the same enzymatic procedure (Vella et al., 2017), suggesting that the EV repertoire in the TME is likely different from that of neuronal tissues. Although MC38 tumors contain small proportions of non-viable cells, it is possible that tumor-derived EVs also encompass small apoptotic bodies and other membrane vesicles derived from late endosomes or ER. Several studies have described contact sites between ER and late endosome membranes (Eden et al., 2010, Rowland et al., 2014) and the translocation of some ER proteins to the plasma membrane during cell stress and death (Galluzzi et al., 2012). These processes may be exacerbated in the inflammatory TME and may promote the release of EVs carrying proteins originating from various subcellular compartments.
TAMs largely display immunosuppressive functions in mouse cancer models (DeNardo and Ruffell, 2019). Unexpectedly, our findings indicate that TAM-EVs enriched from MC38 tumors, which are largely populated by immunosuppressive (M2-like) TAMs (Hoves et al., 2018, Neubert et al., 2018), display immunostimulatory molecular profiles and biological properties. Indeed, in addition to typical TAM markers, such as MRC1, F4/80, CD11c, and STAB1 (Pucci et al., 2009), the TAM-EV signature was enriched in proteins involved in diverse aspects of immunity, cell signaling, cell adhesion, and lipid metabolism. We detected several positive regulators of the immune response, including pattern recognition receptors such as STING and multiple proteins involved in TLR signaling. The TAM-EV signature also contained members of the DOCK (“dedicator of cytokinesis”) family, which are guanine nucleotide exchange factors involved in intracellular signaling networks, chemotaxis, and immunity (Nishikimi et al., 2013). Interestingly, DOCK2, together with its partner ELMO1, mediates the activation and recruitment of lymphocytes (Ippagunta et al., 2011, Stevenson et al., 2014). Furthermore, ITGA4 and F11R, which are involved in leukocyte adhesion and transmigration in brain tumors (Bowman et al., 2016, Pong et al., 2013), were also detected in the TAM-EV signature. Interestingly, the TAM-EV signature was more strongly associated with the gene expression profile of immunostimulatory M1-like than immunosuppressive M2-like TAMs (Squadrito et al., 2012). Also, TAM-EV proteins were associated with a good prognosis in patients with cancer, whereas proteins specifically expressed in the source TAMs associated with neither a good nor bad clinical outcome. Finally, EV preparations enriched in TAM-EVs enhanced T cell proliferation and IFNγ production ex vivo, whereas EV preparations obtained from TAM-depleted tumors neither suppressed nor activated T cells. Collectively, these findings suggest that TAM-regulated immunomodulatory circuits in the TME might also involve activatory signals conveyed by secreted EVs. EVs isolated from antigen-presenting cells carry MHC-peptide complexes and TLR ligands that can directly activate CD4+ and CD8+ T cells (Lindenbergh and Stoorvogel, 2018, Veerman et al., 2019). However, the mechanisms involved in the direct activation of T cells by TAM-EVs require further study.
TAMs produce multiple immunomodulatory lipids, and several proteins involved in lipid metabolism were enriched in TAM-EVs compared to source TAMs. Certain enzymes of the AA pathway (such as COX1, TBXAS1, and some CYP proteins) were found in TAM-EVs, whereas others (including COX2, some PTGEs, and LTA4H) appeared either associated with cancer-cell-derived EVs or other cellular sources in the TME, regardless of the presence of TAMs. Notably, we observed that TAM-EVs contain the machinery required for the production of TXs. This finding suggests that TAM-EV-cargo transfer to tumor-associated cells might regulate the biosynthesis of AA-derived lipid mediators. TAM depletion markedly increased the levels of several protumoral PGs, including PGF2α and PGE2, which are mostly produced through COX2 (Wang and Dubois, 2010). Although this increase might be explained by the proportional expansion of PG-producing cancer cells after TAM depletion, our results indicate that TAM-EVs can directly limit the production of some PGs and increase TX secretion by MC38 and E0771 cancer cells in vitro. Therefore, TAM-EVs may redirect AA catabolism from a COX2-dependent pathway toward a COX1-dependent pathway to possibly limit the protumoral effects of some PGs. The difficulty to recover pure TAM-EV preparations after IP or FACS has limited functional studies in mice. Nevertheless, the TAM-EV protein signature and lipidomic datasets presented in this work may serve as a springboard for further investigations into the roles of TAM-derived EVs in the TME.
STAR★Methods
Key Resources Table
| REAGENT or RESOURCE | SOURCE | IDENTIFIER |
|---|---|---|
| Antibodies | ||
| Rat anti-mouse CD16/CD32 (clone 2.4G2) | BD PharMingen | Cat# 553142; RRID: AB_394657 |
| Rat anti-CD11b-BV711 (clone M1/70) | BioLegend | Cat# 101241; RRID: AB_11218791 |
| Rat anti-CD11b-PE-Cy7 (clone M1/70) | eBioscience | Cat# 25-0112-82; RRID: AB_469588 |
| Rat anti-CD45-V500 (clone 30-F11) | BD Biosciences | Cat# 561487; RRID: AB_10697046 |
| Rat anti-CD45-PerCP-Cy5.5 (clone 30-F11) | eBioscience | Cat# 45-0451-82; RRID: AB_1107002 |
| Rat anti-F4/80-APC-Cy7 (clone BM8) | BioLegend | Cat# 123115; RRID: AB_893493 |
| Rat anti-F4/80-AF647 (clone BM8) | BioLegend | Cat# 123121; RRID: AB_893492 |
| Rat anti-Ly6G-BV605 (clone 1A8) | BioLegend | Cat# 127639; RRID: AB_2565880 |
| Rat anti-Ly6C-AF700 (clone HK1.4) | BioLegend | Cat# 128023; RRID: AB_10640119 |
| Rat anti-F4/80-AF488 (clone BM8) | BioLegend | Cat# 123119; RRID: AB_893491 |
| Rat anti-MRC1-AF647 (clone C068C2) | BioLegend | Cat# 141711; RRID: AB_10900240 |
| Hamster anti-CD11c-PE (clone HL3) | BD Biosciences | Cat# 553802; RRID: AB_395061 |
| Rat anti-CD11b-FITC (clone M1/70) | BD Biosciences | Cat# 553310; RRID: AB_394774 |
| Rat anti-MHC II-AF647 (clone M5/114.15.2) | BioLegend | Cat# 107617; RRID: AB_493526 |
| Rabbit anti-RAB7-AF647 (clone EPR7589) | Abcam | Cat# ab198337; RRID: AB_2783538 |
| Mouse anti-ACTB (clone AC-15) | Sigma | Cat# A1978; RRID: AB_476692 |
| Mouse anti-ALIX (clone 3A9) | Abd Serotec | Cat# MCA2493; RRID: AB_872031 |
| Rabbit anti-CANX | Abcam | Cat# ab22595; RRID: AB_2069006 |
| Mouse anti-CASP9 (clone C9) | Cell Signaling | Cat# 9508; RRID: AB_2068620 |
| Rat biotin anti-CD9 antibody (clone KMC8) | BD Biosciences | Cat# 558749; RRID: AB_397103 |
| Rat anti-CD63 (clone R5G2) | MBL International | Cat# D263-3; RRID: AB_1278815 |
| Rat anti-CD68 (clone FA-11) | GeneTex | Cat# GTX41864; RRID: AB_11176186 |
| Mouse anti-CD81 (clone B-11) | Santa Cruz | Cat# sc-166029; RRID: AB_2275892 |
| Mouse anti-COX1 (clone 5F6/F4) | Abcam | Cat# ab695; RRID: AB_305674 |
| Rat biotin anti-F4/80 (clone BM8) | BioLegend | Cat# 123105; RRID: AB_893499 |
| Rabbit anti-GAPDH (clone 16C10) | Cell Signaling | Cat# 2118; RRID: AB_561053 |
| Rabbit anti-GFP | Thermo Fisher Scientific | Cat# A11122; RRID: AB_221569 |
| Rat anti-GP96 (clone 9G10) | Enzo | Cat# ADI-SPA-850-D; RRID: AB_2039133 |
| Mouse biotin anti-HER2 (clone e2-4001) | Thermo Fisher Scientific | Cat# MA5-13102; RRID: AB_10984470 |
| Goat anti-MRC1 | R&D | Cat# AF2535; RRID: AB_2063012 |
| Rabbit anti-PARP9 | Cell Signaling | Cat# 9542; RRID: AB_2160739 |
| Rabbit anti-Syntenin-1 | Invitrogen | Cat# PA5-28826; RRID: AB_2546302 |
| Rabbit anti-STING (clone D2P2F) | Cell Signaling | Cat# 13647; RRID: AB_2732796 |
| Rabbit anti-TBXAS1 (clone EPR7333(2)) | Abcam | Cat# ab157481; RRID: AB_2783536 |
| Mouse anti-TSG101 (clone 4A10) | Abcam | Cat# ab83; RRID: AB_306450 |
| Rabbit anti-VINCULIN (clone EPR8185) | Abcam | Cat# ab129002; RRID: AB_11144129 |
| Rat biotin anti-CD11b (clone M1/70) | eBioscience | Cat# 13-0112-82; RRID: AB_466359 |
| Rat biotin IgG2a, κ isotype control (clone RTK2758) | BioLegend | Cat# 400503; RRID: AB_2783537 |
| Mouse-hamster chimeric IgG1 anti-mouse CSF1R (clone 2G2) | Roche | N/A |
| Mouse IgG1 (clone MOPC-21) | BioXCell | Cat# BE0083; RRID: AB_1107784 |
| Rabbit anti-TBXAS1 | Abcam | Cat# ab187176; RRID: AB_2800358 |
| CD3-APC (clone 17A2) | BioLegend | Cat# 100235; RRID: AB_2561455 |
| CD8a-APC/Cy7 (clone 53-6.7) | BioLegend | Cat# 100713; RRID: AB_312752 |
| CD4-APC/eFluor780 (clone GK1.5) | eBioscience | Cat# 47-0041-82; RRID: AB_11218896 |
| CD40-PE (clone: 3/23) | BD Biosciences | Cat# 561846; RRID: AB_10896482 |
| CD86-PerCP-Cy5.5 (clone GL-1) | BioLegend | Cat# 105027; RRID: AB_893420 |
| CD80-FITC (clone 16-10A1) | BioLegend | Cat# 104705; RRID: AB_313126 |
| MHC II-AF647 (clone M5/114.15.2) | BioLegend | Cat# 107617; RRID: AB_493526 |
| CD11c-PacBlue (clone N418) | BioLegend | Cat# 117321; RRID: AB_755987 |
| Chemicals, Peptides, and Recombinant Proteins | ||
| Recombinant murine IFN-γ | Peprotech | Cat# 315-05 |
| Recombinant murine IL-4 | Peprotech | Cat# 214-14 |
| Collagenase IV | Life Technologies | Cat# 17104019 |
| Dispase | Life Technologies | Cat# 17105041 |
| DNase I | Life Technologies | Cat# 18047019 |
| Red blood cell lysis buffer Hybri-Max™ | Sigma | Cat# R7757 |
| Poly-L-lysine | Sigma | Cat# P6282 |
| DAPI | Sigma | Cat# D9542 |
| Protease inhibitor cocktail cOmplete™ | Roche | Cat# 11697498001 |
| Halt™ protease and phosphatase inhibitors | Thermo Fisher Scientific | Cat# 1861281 |
| RIPA buffer | Sigma | Cat# R0278 |
| Uranyl acetate | Electron Microscopy Sciences | Cat# 22400 |
| DiOC18(7) (DiR) | Thermo Fisher Scientific | Cat# D12731 |
| PKH67 | Sigma | Cat# MINI67-1KT |
| PKH26 | Sigma | Cat# MINI26-1KT |
| Calcium ionophore A23187 | Sigma | Cat# C7522 |
| Prostaglandin E2 | Cayman Chemical | Cat# 14010 |
| Prostaglandin F2α | Cayman Chemical | Cat# 16010 |
| OVA257-264 SIINFEKL peptide | GenScript | Cat# RP10611 |
| Recombinant murine IL-2 | Peprotech | Cat# 212-12 |
| Recombinant murine GM-CSF | Peprotech | Cat# 315-03 |
| Recombinant murine M-CSF | Peprotech | Cat# 315-02 |
| Critical Commercial Assays | ||
| LIVE/DEAD Fixable Violet Dead Cell Stain Kit | Thermo Fisher Scientific | Cat# L34963 |
| BCA protein assay reagent Kit | Thermo Fisher Scientific | Cat# 23225 |
| Exosome-Streptavidin Isolation/Detection Reagent | Thermo Fisher Scientific | Cat# 10608D |
| PGE2 ELISA kit | Enzo | ADI-901-001 |
| TXB2 ELISA kit | Enzo | ADI-901-002 |
| EasySep Mouse CD8+ T Cell Isolation Kit | STEMCELL | Cat# 19853 |
| Dynabeads Mouse T-Activator CD3/CD28 | Thermo Fisher Scientific | Cat# 11456D |
| EasySep Mouse CD4+ T Cell Isolation Kit | STEMCELL | Cat# 19852 |
| RNeasy RNA Isolation Mini Kit | QIAGEN | Cat# 74104 |
| TaqMan MicroRNA Reverse Transcription Kit | Thermo Fisher Scientific | Cat# 4366596 |
| TaqMan Universal PCR Master Mix | Thermo Fisher Scientific | Cat# 4304437 |
| CellTrace Violet Cell Proliferation Kit | Thermo Fisher Scientific | Cat# C34571 |
| LIVE/DEAD Fixable Red Dead Cell Stain Kit | Thermo Fisher Scientific | Cat# L34971 |
| IFN-γ ELISA kit | Thermo Fisher Scientific | Catalog# BMS606 |
| Deposited Data | ||
| Raw RNA sequencing data of in vivo-derived tumor-associated macrophages (Squadrito et al., 2012) | NCBI Gene Expression Omnibus | GEO: GSE34903 |
| Unprocessed blots | Mendeley Data | https://doi.org/10.17632/zj43mmthr8.1 |
| Experimental Models: Cell Lines | ||
| Cancer cell line: MC38 | P. Romero (Lausanne, Switzerland) | RRID:CVCL_B288 |
| Cancer cell line: MC38 expressing the human HER2 | M. De Palma (Lausanne, Switzerland) (Squadrito et al., 2018) | N/A |
| Cancer cell line: E0771 | J. Huelsken (Lausanne, Switzerland) | RRID:CVCL_GR23 |
| Experimental Models: Organisms/Strains | ||
| Mouse: WT C57BL/6J | Charles River Laboratories | Stock# 000664 RRID:IMSR JAX:000664 |
| Mouse: B6.Cg-Tg(Wap-ERBB2)229Wzw/J | The Jackson Laboratory | Stock# 010562 RRID:IMSR_JAX:010562 |
| Mouse: C57BL/6/ROSAmT/mG mice | Muzumdar et al., 2007 | N/A |
| Mouse: C57BL/6/LysM.Cre | Clausen et al., 1999 | N/A |
| Mouse: C57BL/6/LysM.Cre/ROSAmT/mG | Baer et al., 2016 | N/A |
| Mouse: C57BL/6-Tg(TcraTcrb)1100Mjb/J | Charles River Laboratory | Stock #003831 RRID:IMSR JAX:003831 |
| Mouse: Balb/cByJ | The Jackson Laboratory | Stock #001026 RRID:IMSR_JAX:001026 |
| Oligonucleotides | ||
| hsa-miR-21 | Thermo Fisher Scientific | Assay ID 000397 |
| U6 ssRN | Thermo Fisher Scientific | Assay ID 001973 |
| hsa-miR-16 | Thermo Fisher Scientific | Assay ID 000391 |
| mmu-miR-511-3 | Thermo Fisher Scientific | Assay ID 463069_mat |
| hsa-let-7a | Thermo Fisher Scientific | Assay ID 000377 |
| Software and Algorithms | ||
| Scaffold™ Version 4.8.7 | Proteome Software | www.proteomesoftware.com, RRID:SCR_014345 |
| MassHunter Version B.07.00 | Agilent | https://www.agilent.com, RRID:SCR_015040 |
| Circos Table Viewer Version 0.63-9 | Krzywinski et al., 2009 | http://mkweb.bcgsc.ca/tableviewer/ |
| Graphpad Prism Version 7 | GraphPad Prism | RRID:SCR_002798 |
| FlowJo v.10.4.2 | FlowJo, LLC | RRID:SCR_008520 |
| Molecular Signature Database (MSigDB) | Liberzon et al., 2011 | RRID:SCR_016863 |
| Immuno-Navigator | Vandenbon et al., 2016 | https://genomics.virus.kyoto-u.ac.jp/immuno-navigator/ |
| R package version 1.0.10 | Raivo Kolde | https://cran.r-project.org/web/packages/pheatmap/index.html, RRID:SCR_003005 |
| String | Szklarczyk et al., 2017 | RRID:SCR_005223 |
| Gene Set Enrichment Analysis (GSEA) | Subramanian et al., 2005 | http://software.broadinstitute.org/gsea/index.jsp, RRID:SCR_003199 |
| ARCHS4 database | Lachmann et al., 2018 | https://amp.pharm.mssm.edu/archs4/, RRID:SCR_015683 |
| EdgeR Bioconductor package | Robinson et al., 2010 | RRID:SCR_012802 |
| Fgsea Bioconductor package | Sergushichev 2016 | https://bioconductor.org/packages/release/bioc/html/fgsea.html |
| PRECOG | Gentles et al., 2015 | https://precog.stanford.edu |
| NTA software version 3.0 | Malvern | RRID:SCR_014239 |
| SDS software version 2.4 | Thermo Fisher Scientific | https://www.thermofisher.com/us/en/home.html |
| FIJI ImageJ Version 2.0 | NIH | https://fiji.sc; RRID: SCR_002285 |
Contact for Reagent and Resource Sharing
Further information and requests for reagents and resources, including proteomic raw data, should be directed to and will be fulfilled by the Lead Contact, Michele De Palma (michele.depalma@epfl.ch).
Experimental Model and Subject Details
Mice
C57BL/6 mice were purchased from Charles River Laboratories and Balb/cByJ mice from The Jackson Laboratory. OT-I C57BL/6-Tg(TcraTcrb)1100Mjb/J (Hogquist et al., 1994), Wap-ERBB2 B6.Cg-Tg(Wap-ERBB2)229Wzw/J (Piechocki et al., 2003), C57BL/6/ROSAmT/mG (Muzumdar et al., 2007) and C57BL/6/LysM.Cre (Clausen et al., 1999) transgenic mice were available in the EPFL mouse facility. Homozygous LysM.Cre mice were crossed with ROSAmT/mG mice to obtain LysM.Cre/ROSAmT/mG mice, as previously described (Baer et al., 2016). Pups were genotyped by Transnetyx, as detailed on the company’s website (https://www.transnetyx.com). All mice employed in this study were maintained in pathogen-free barrier animal facilities in accord with Swiss regulations for the care and use of mice in experimental research. All procedures were performed according to protocols approved by the Veterinary Authorities of the Canton Vaud according to the Swiss Law (licenses VD2916, VD3049 and VD3435).
Cell lines
Untransduced MC38 cells (P. Romero, Lausanne, Switzerland), MC38 cells expressing human HER2 (Squadrito et al., 2018) and E0771 cells (J. Huelsken, Lausanne, Switzerland), all of female C57BL/6 origin, were maintained in Iscove’s modified Dulbecco’s medium (IMDM, Sigma) supplemented with 10% fetal bovine serum (FBS, Thermo Fisher Scientific), 2 mM L-glutamine (GIBCO) and a combination of 50 units/ml penicillin and 50 μg/ml streptomycin (Life Technologies). Cells were routinely tested and resulted negative for Mycoplasma.
Bone marrow-derived macrophages (BMMs)
To generate primary BMMs, we obtained BM cells by flushing the long bones of 6-week-old female C57BL/6, C57BL/6/ROSAmT/mG or LysM.Cre/ROSAmT/mG mice, as described previously (Squadrito et al., 2018). BM cells were plated in Macrophage-SFM medium (Thermo Fisher Scientific) supplemented with penicillin–streptomycin and mouse macrophage colony-stimulating factor (CSF1, 100 ng/ml, Peprotech) to promote macrophage differentiation, and cultured for 14 days. In some experiments, BMMs were polarized toward an M1 or M2 phenotype. M1 polarization was induced in presence of IFNγ (20 ng/ml, Peprotech) and lipopolysaccharide (LPS, 5 ng/ml, Sigma), whereas M2 polarization was induced with IL-4 (40 ng/ml, Peprotech), as described (Murray et al., 2014). BMM polarization was initiated at day 7-9 and terminated at day 14 after cell isolation.
T cells
Antigen-primed OT-I CD8+ T cells were prepared as described previously (Barreira da Silva and Albert, 2017). Briefly, freshly-isolated splenocytes from 6- up to 8- week-old female C57BL/6-Tg(TcraTcrb)1100Mjb/J (OT-I) mice were incubated for 1h with the OVA257-264 SIINFEKL peptide (10 nM, GenScript) in RPMI 1640 medium supplemented with 10% FBS, L-glutamine, penicillin/streptomycin, beta-mercaptoethanol (70 μM, GIBCO), gentamycin (23 μg/ml, Sigma), non-essential amino acids (0.1 mM, Sigma) and sodium pyruvate (1 mM, GIBCO). Cells were then cultured in presence of IL-2 (Peprotech) for 4 days to allow for OT-I cell expansion.
Naive CD8+ and CD4+ T cells were purified from the spleen of 6- up to 8- week-old female C57BL/6 or BALB/c mice using the EasySep™ CD8+ and CD4+ T cell isolation kits (STEMCELL), according to the manufacturer’s instructions.
Bone marrow-derived dendritic cells (BMDCs)
To generate primary BMDCs, we obtained BM cells by flushing the long bones of 6-week-old female C57BL/6 mice, as described previously (Squadrito et al., 2018). BM cells were cultured for six days in RPMI 1640 medium with 10% FBS, L-glutamine, penicillin/streptomycin and granulocyte-macrophage colony-stimulating factor (GM-CSF, 100 ng/ml, Peprotech), prior to functional assays.
Subcutaneous tumor models
MC38 cells (1.2x10⁶) or E0771 cells (1.5x10⁶) were injected subcutaneously in the right flank of 6 to 8-week old mice. Specifically, C57BL/6 received injections of MC38 or E0771 cells, whereas LysM.Cre/ROSAmT/mG mice and Wap-ERBB2 mice received injections of MC38 cells or HER2+ MC38 cells, respectively. Both female and male mice were employed after randomization to the various experimental groups. MC38 and E0771 tumors were grown for 14 and 20 days, respectively. Tumor growth was monitored every 2-3 days and tumor size determined by caliper measurements. Tumor volume was calculated using the formula: tumor volume [mm3] = (length [mm])2 × (height [mm]) × π / 6.
Method Details
Treatment of mice carrying subcutaneous tumors
Mice were treated intraperitoneally (i.p.) with 30 mg/kg of either mouse-hamster chimeric IgG1 anti-mouse CSF1R, clone 2G2 (Roche) (Ries et al., 2014); or a control mouse IgG1 (clone MOPC-21; BioXCell), both dissolved in PBS (Dulbecco’s PBS, Bioconcept). Treatments were initiated 4 days after cancer cell inoculation. All mice received two (MC38 model) or three (E0771 model) doses of the drugs, once per week.
Preparation of tumor-derived cells for flow cytometry
Before euthanasia, deeply anesthetized mice were perfused with PBS to remove intravascular blood cells. Tumors were then harvested, washed in PBS and minced before digestion with collagenase IV (0.2 mg/ml, Life Technologies), dispase (2 mg/ml, Life Technologies) and DNase I (0.002 mg/ml, Life Technologies) in IMDM medium for 20 min at 37°C. The cell suspensions were filtered using a nylon filtration tissue of 150 μm mesh (Sefar). Red blood cells were lysed using a red blood cell lysis buffer (Sigma). Tumor-derived cells were incubated with PBS containing rat anti-mouse FcγIII/II receptor (CD16/CD32) blocking antibodies (4 μg/ml, BD PharMingen, clone 2.4G2) and a fixable viability dye (LIVEDEAD® Fixable Violet or Red, 1:1000, Thermo Fisher Scientific) for 15 min at 4°C before staining with antibodies.
Tumor-derived cell types were identified using the following combinations of cell markers:
TAMs: CD45+CD11b+Ly6ClowLy6G−F4/80+;
Tumor monocytes: CD45+CD11b+Ly6C+Ly6G−;
Tumor neutrophils: CD45+CD11b+Ly6G+;
MC38 cancer cells (from LysM.Cre/ROSAmT/mG mice only): CD45−GFP−tdTomato−.
Flow cytometry
After blocking and live-dead staining, tumor-derived and cultured immune cells (BMMs, T cells and BMDCs) were stained with the following antibodies (all diluted 1:100) for 30 min at 4°C: rat anti-CD11b-BV711 (clone M1/70, BioLegend), rat anti-CD11b-PE-Cy7 (clone M1/70, eBioscience), rat anti-CD45-V500 (clone 30-F11, BD Biosciences), rat anti-CD45-PerCP-Cy5.5 (clone 30-F11, eBioscience), rat anti-F4/80-APC-Cy7 (clone BM8, BioLegend), rat anti-F4/80-AF647 (clone BM8, BioLegend), rat anti-Ly6G-BV605 (clone 1A8, BioLegend), rat anti-Ly6C-AF700 (clone HK1.4, BioLegend), CD3-APC (clone 17A2, BioLegend), CD8a-APC/Cy7 (clone 53-6.7, BioLegend), CD4-APC/eFluor780 (clone GK1.5, eBioscience), CD40-PE (clone: 3/23, BD Biosciences), CD86-PerCP-Cy5.5 (clone GL-1, BioLegend), CD80-FITC (clone 16-10A1, BioLegend), MHC II-AF647 (clone M5/114.15.2, BioLegend) and CD11c-PacBlue (clone N418, BioLegend). All samples were analyzed with an Attune NxT apparatus (Life Technologies). Compensation was performed using single-stained OneComp eBeads (Thermo Fisher Scientific).
Immunofluorescence staining of tumor sections
After intracardiac perfusion of the mice with PBS, tumors were harvested, extensively washed with PBS and immediately embedded in O.C.T compound (Cryomatrix, Thermo Fisher Scientific) on dry ice with iso-pentane (VWR Chemicals) before storage at −80°C. Tissue sections of 8-10 μm were obtained using Leica cryostat CM1950 (Leica Biosystems). Before staining, sections were fixed in methanol for 20 minutes at −20°C, washed three times with PBS for 5 minutes and incubated with blocking solution (1% BSA, 5% FBS in PBS) for 2h at room temperature. Sections were then incubated overnight at 4°C in 100-200 μL of blocking solution containing fluorophore-conjugated antibodies. After staining, nuclei were labeled with DAPI (1 μg/ml, Sigma) and sections mounted in Dako fluorescence mounting medium, covered with cover glass (Heathrow Scientific) and stored at 4°C. The following antibodies were used (all diluted 1:50): rat anti-F4/80-AF488 (clone BM8, BioLegend), rat anti-MRC1-AF647 (clone C068C2, BioLegend), hamster anti-CD11c-PE (clone HL3, BD Biosciences), rat anti-CD11b-FITC (clone M1/70, BD Biosciences) and rat anti-MHC II-AF647 (clone M5/114.15.2, BioLegend).
Immunofluorescence staining of cultured cells
BMMs were seeded on FluoroDish™ cell culture dishes (Fisher Scientific) or on glass coverslips (Electron Microscopy Sciences), both previously coated with 50 μg/ml poly-L-lysine (Sigma), and incubated at 37°C until fully adherent (16-24h). In some experiments, cells were imaged live using a confocal microscope, as described below. Alternatively, the medium was aspirated and the cells washed three times with PBS and fixed with 4% paraformaldehyde for 20 min. Cells were then permeabilized with a solution containing 0.3% Triton X-100 in PBS for 20 min and blocked with 10% goat serum in PBS for 1h at room temperature. The primary antibody RAB7-AF647 (EPR7589, Abcam) was diluted 1:200 in blocking solution and applied overnight at 4°C. Nuclei were labeled with DAPI (1 μg/ml, Sigma) and slides were mounted as described above.
Acquisition of confocal microscopy images
We used a Zeiss LSM700 confocal microscope coupled to a high sensitivity Axiocam MRm (B/W) camera. A stage-mounted incubation chamber at 37°C, 5% CO2 was used for live cell imaging acquisition. Fluorescent signals from individual fluorophores were acquired sequentially from single optical sections.
Non-enzymatic isolation of EVs from tumor tissue
Before euthanasia, deeply anesthetized mice were perfused with PBS to remove intravascular blood cells and EVs. Tumors were then harvested, washed in PBS and minced in PBS containing 2 mM EDTA. Tumors were filtered through a 70 μm cell strainer (Corning) using a syringe plunger and transferred to 50 mL tubes. Typically, we obtained 200 mL of tumor-cell suspension after pooling several MC38 tumors (generally between 5 and 15, each of 0.1-1.0 g) from mice of the same treatment group. E0771 tumors from each mouse were harvested and processed individually.
EVs were isolated from tumor-cell suspensions using sequential ultracentrifugation, as previously described (Cianciaruso et al., 2017, Keklikoglou et al., 2019, Thery et al., 2006). Briefly, supernatants were centrifuged at 500 x g for 5 min, 2000 x g for 10 min to remove dead cells and debris, and ultracentrifuged at 10,000 x g for 30 min at 4°C to remove large vesicles. Supernatants were then transferred to new tubes and ultracentrifuged at 110,000 x g for 70 min at 4°C to collect small EVs (Kowal et al., 2016). EV pellets were then washed in 35 mL of PBS and ultracentrifuged again at 134,000 x g for 70 min at 4°C. All ultracentrifugation steps were performed using a Beckman ultracentrifuge and a SW32Ti rotor. The resulting EV preparations were resuspended in PBS and either used immediately or stored at −80°C.
Unless stated differently, purified tumor-derived EVs were subject to continuous sucrose gradient fractionation using established procedures (Chiou and Ansel, 2016, Keklikoglou et al., 2019). Briefly, 12 stock solutions with decreasing sucrose concentrations were layered on top of purified EVs (400-1000 μg, in 100 μL PBS) in a total volume of 12 ml, followed by ultracentrifugation at 100,000 x g (acceleration, 7; deceleration, no brake) for 16h at 4°C with a Beckman ultracentrifuge and a SW40Ti rotor. Six fractions (2 mL each) were then collected and transferred to new tubes; the density of each fraction was measured using a refractometer. Each fraction was washed with 33 mL of PBS and ultracentrifuged at 134,000 x g for 70 min at 4°C using a SW32Ti rotor. EVs were finally resuspended in 100-200 μL PBS prior to subsequent analyses.
Enzymatic isolation of EVs from tumor tissue
When indicated, in parallel to the EV isolation protocol described above, we adapted a recently described procedure for EV purification from tissue (Steenbeek et al., 2018, Vella et al., 2017). Briefly, IgG control- or anti-CSF1R-treated MC38 tumors were minced before digestion with collagenase IV (0.2 mg/ml, Life Technologies), dispase (2 mg/ml, Life Technologies) and DNase I (0.002 mg/ml, Life Technologies) in IMDM medium for 20 min at 37°C. Tumor cell suspensions were then cooled down on ice and protease inhibitors (cOmplete™, Roche) added in a final volume of 35 ml. EVs were then isolated using sequential ultracentrifugation and sucrose gradient fractionation, as described above. The average yield of EVs was 1.1 and 0.2 mg per g of tumor before and after sucrose fractionation, respectively.
Isolation of EVs from continuous and primary cell cultures
In most of the experiments, MC38 cells (2.2 x10⁷) were seeded in a CELLine™ bioreactor flask (Argos Technologies) in 15 mL of medium containing 5% EV-depleted FBS, which was obtained by ultracentrifugation of standard FBS at 134,000 x g for 16h at 4°C followed by filtration through a 0.1 μm vacuum filtration bottle. One liter of complete medium was then added to the medium compartment. After 7, 14 and 21 days, the supernatant was collected from the cell compartment for EV isolation and replaced with 15 mL of fresh EV-depleted medium. In a minority of the experiments, MC38 cells or E0771 cells were seeded in 15 cm cell culture dishes in complete medium. When cells were at about 50% confluence, they were moved to medium containing 5% EV-depleted FBS (see above).
BMMs were seeded in 10 cm cell culture dishes in SFM medium as described above. Collection of the cell culture supernatant was done every 2-3 days, starting from 8 and up to 14 days after cell seeding. EVs were isolated from the conditioned medium using sequential ultracentrifugation, as described above, with the exception that purified EVs were not subject to sucrose gradient fractionation.
The average yield of EVs obtained with the bioreactor system was 40-55 μg (determined by BCA, see below) per ml of cell culture medium. The average yield of EVs obtained from MC38 cells, E0771 cells and BMMs seeded in cell culture dishes was 1.1 μg, 1.4 μg and 2.8 μg (by BCA) per ml of supernatant, respectively.
Quantification of EVs
EV preparations were analyzed for protein content using the BCA protein assay reagent Kit (Thermo Fisher Scientific). The size and concentration of EVs were determined by NTA using a Nanosight NS300 device (Malvern Instruments, UK), as described previously (Keklikoglou et al., 2019). Briefly, we tested different sample dilutions (1:100 to 1:5000, in PBS) whereby particle concentration was within the optimal range of detection (5x10⁷ - 1x10⁹ particles/ml). All camera settings were set at the beginning of the session and kept fixed during all acquisitions in a given experiment: camera level, 7; camera gain, 13; detection threshold, 4. For each sample, three videos of 60 s for at least one EV dilution were taken and analyzed using the NTA software 3.0 with default settings.
Transmission electron microscopy (TEM) of purified EVs
Purified EVs (5 μg in 15 μL of PBS) were applied to carbon-coated 400 mesh grids (Electron Microscopy Sciences) for 5 min, washed with PBS and negatively stained with 2% uranyl acetate (Electron Microscopy Sciences) for 30 s, as described previously (Cianciaruso et al., 2017, Keklikoglou et al., 2019). Images were obtained using a transmission electron microscope (Tecnai Spirit, FEI Company).
Western blotting (WB)
Cells were lysed in ice-cold RIPA buffer (Sigma) containing Halt™ protease and phosphatase inhibitors (Thermo Fisher Scientific). EVs were used without lysis. Protein concentration was determined with the BCA protein assay reagent Kit (Thermo Fisher Scientific). In most experiments, proteins were denatured at 90°C for 10 min with 4x LDS Sample buffer and 10x Reducing agent (both from Life Technologies). In some experiments (namely for blotting of CD63 and F4/80), protein denaturation was performed in the absence of the 10x Reducing agent. Unless stated otherwise, matched protein amounts for each sample were analyzed in each experiment. Proteins (10 to 20 μg) were separated by 4%–12% (gradient) SDS-PAGE (Life Technologies) and blotted onto PVDF membranes (Amersham Hybond 0.45 μm, GE Healthcare).
In most experiments, membranes were blocked with Odyssey Blocking Buffer (LI-COR Biosciences) for 1h at room temperature, incubated with primary antibodies in blocking solution for 24h at 4°C. Membranes were then incubated with IRDye 800CW and 680RD-conjugated secondary antibodies (LI-COR Biosciences) or streptavidin 800CW and 680RD (LI-COR Biosciences) in blocking solution containing 0.1% Tween 20 and 0.01% SDS for 35 min at room temperature. Blots were then imaged using the LI-COR Odyssey scanner.
In some experiments (WB of CD9 and TBXAS1), membranes were blocked with 5% milk and 0.1% Tween 20 in tris-buffered saline (TBS-T) for 1h at room temperature, incubated with primary antibodies in blocking solution for 24h at 4°C and then with horseradish peroxidase (HRP)-conjugated secondary antibodies (GE Healthcare) for 1h at room temperature. The proteins of interest were visualized using the ECL Western Blotting substrate (Pierce) and a Fusion FX device (Vilber Lourmat).
The following antibodies were used: mouse anti-ACTB (clone AC-15, Sigma), mouse anti-ALIX (clone 3A9, Abd Serotec), rabbit anti-CANX (Abcam, ab22595), mouse anti-CASP9 (clone C9, Cell Signaling), rat biotin anti-CD9 (clone KMC8, BD Biosciences), rat anti-CD63 (clone R5G2, MBL), rat anti-CD68 (clone FA-11, GeneTex), mouse anti-CD81 (clone B-11, Santa Cruz), mouse anti-COX1 (clone 5F6/F4, Abcam), rat biotin anti-F4/80 (clone BM8, Biolegend), rabbit anti-GAPDH (clone 16C10, Cell Signaling), rabbit anti-GFP (Thermo Fisher Scientific, A11122), rat anti-GP96 (clone 9G10, Enzo), mouse biotin anti-HER2 (clone e2-4001, Thermo Fisher Scientific), goat anti-MRC1 (R&D, AF2535), rabbit anti-PARP9 (Cell Signaling, 9542), rabbit anti-Syntenin-1 (Invitrogen, PA5-28826,), rabbit anti-STING (clone D2P2F, Cell Signaling), rabbit anti-TBXAS1 (clone EPR7333(2), Abcam), rabbit anti-TBXAS1 (Abcam, ab187176), mouse anti-TSG101 (clone 4A10, Abcam) and rabbit anti-VINCULIN (clone EPR8185, Abcam).
All primary antibodies were used at 1:1000 dilution (except for goat anti-MRC1, mouse anti-TSG101 and rabbit anti-TBXAS1, which were used at 1:500). HRP-conjugated secondary antibodies (GE Healthcare) were incubated at 1:3000 to 1:6000 dilution in TBS-T containing 5% milk for 1h at room temperature. LI-COR secondary antibodies and streptavidins were diluted in Odyssey Blocking Buffer with 0.1% Tween 20 and 0.01% SDS at 1:15,000 and 1:2000, respectively, and incubated for 30 min at room temperature.
miRNA profiling
Total RNA was extracted from MC38 tumor-derived EVs (10 μg in 20 μl of PBS) by using the miRNeasy Mini kit (QIAGEN), according to the manufacturer’s instructions. RNA was quantified using NanoDrop 2000 (Thermo Fisher Scientific). Reverse transcription (RT) and individual miRNA profiling were performed using TaqMan MicroRNA Reverse Transcription Kit (Thermo Fisher Scientific), TaqMan Universal PCR Master Mix (Thermo Fisher Scientific) and the following miR TaqMan Assays (Thermo Fisher Scientific): U6, Assay ID: 001973; miR-16-5p, Assay ID: 000391; miR-511-3p, Assay ID: 463069_mat; let-7a-5p, Assay ID: 000377; miR-21, Assay ID: 00397. TaqMan reactions were run for 40 cycles in standard mode using an ABI7900HT apparatus (Applied Biosystems).
Labeling EVs with fluorescent membrane dyes
EV labeling with the near IR fluorescent, lipophilic carbocyanine DiOC18(7) (DiR) was performed by modifying the manufacturer’s protocol (Thermo Fisher Scientific). Briefly, EVs were diluted in PBS prior to addition of the dye (5 μM as final concentration). Labeling was performed for 15 min at room temperature in the dark and terminated using 0.1% BSA (Sigma) in PBS. EVs were loaded onto Vivaspin® 500 columns (300,000 MW cutoff, Sartorius) and centrifuged three times at 4000 x g for 20 min in 0.1% BSA in PBS to retain EVs and discharge free dye/s. Concentrated EVs were resuspended in PBS prior to use.
EV labeling with PKH67 and PKH26 was performed by modifying the manufacturer’s protocol (Sigma). Briefly, the EV preparations were diluted in diluent C prior to addition of the dye (1 μl per 100 μl of solution). Labeling was performed for 10 min at room temperature in the dark and terminated using 0.1% BSA (Sigma) in PBS. EVs were washed using Vivaspin® 500 columns (300,000 MW cutoff, Sartorius) as described above.
Flow cytometry analysis of EVs
In most of the experiments, EVs were labeled with the fluorescent membrane dye DiR or PKH67 (see above) to distinguish EVs from background noise. MC38-EVs were blocked with rat anti-mouse FcγIII/II receptor (CD16/CD32) blocking antibodies (2 μg/ml) for 15 min at 4°C and stained with mouse anti-HER2-AF647 (1:50, clone 24D2, BioLegend) for 1h at 4°C. Between each step, EVs were washed using Vivaspin® 500 columns (300,000 MW cutoff, Sartorius), as described above.
EV samples were typically diluted in PBS at 50-100 μg/ml, and analyzed using an Attune NxT apparatus (Life Technologies). Acquisition settings were optimized for detection of EV populations carrying green, red or near-infrared fluorescence, or a combination thereof. The conventional blue side scatter (SSC, 488 nm) was replaced by the violet side scatter (vSSC, 405 nm) and the acquisition threshold was set at 0.2 on the vSSC. EVs were gated based on their positivity for DiR and vSSC properties. Compensation was performed using single-stained OneComp eBeads (Thermo Fisher Scientific).
EV sorting by fluorescence-activated cell sorting (FACS)
IgG-EVs isolated from MC38 tumors of LysM.Cre/ROSAmT/mG mice were stained with DiR as described above and then diluted in PBS at 30 μg/ml. FACS was performed using a 4-laser MoFlo ASTRIOS EQ cell sorter (Beckman Coulter). EVs were first gated based on DiR fluorescence and side scatter (SSC) properties and then subdivided according to GFP signal. The 488 nm laser was used to assess the SSC and GFP fluorescence (526/52). The 640 nm laser combined with a 795/70 band pass filter was instead used to measure DiR fluorescence. To maximize the amount of collected light, no beam splitter or FSC masks were used. After 6h of continuous sorting, 1x10⁶ GFP+/tdTomato– and GFP–/tdTomato– EVs were obtained, transferred to polypropylene ultracentrifuge tubes (Beckman) and precipitated by adding four times the sample volume of cold (−20°C) acetone. Samples were incubated for 1h at −20°C prior to centrifugation at 15,000 x g for 15 min. After removing the supernatant, acetone was allowed to evaporate for 30 min at room temperature. Pellets were finally resuspended in 4x LDS Sample buffer and 10x Reducing agent (both from Life Technologies) and denatured at 90°C for 10 min, prior to LC-MS/MS analysis, as described below.
Immunoprecipitation (IP) of EVs
IP of EVs was performed using the Exosome-Streptavidin Isolation kit with minor modifications to the manufacturer’s instructions (Thermo Fisher Scientific). Briefly, biotinylated antibodies were conjugated to magnetic beads for 1h at room temperature. Meanwhile, 25 μg of EVs were blocked for 30 min at 4°C in a PBS solution containing 0.1% BSA and rat anti-mouse FcγIII/II receptor (CD16/CD32) blocking antibodies (2 μg/ml). EVs were washed twice using Vivaspin® 500 columns (300,000 MW cutoff, Sartorius), as described above. EVs were then incubated with antibody-conjugated beads for 24h at 4°C on a rotating mixer.
Unbound EVs were removed by three consecutive washes using a magnetic separation rack (DynaMag-2, Thermo Fisher Scientific). Immunoprecipitated EVs were denatured at 90°C for 10 min with 4x LDS Sample buffer and 10x Reducing agent (both from Life Technologies) for WB and LC-MS/MS analysis. Alternatively, immunoprecipitated EVs were stained with PKH67 (see above) and washed using the magnetic rack for flow cytometry analysis. The following biotin-conjugated antibodies were used in the IP procedures: rat anti-CD11b (clone M1/70, eBioscience), rat anti-CD9 (clone KMC8, BD PharMingen) and the rat isotype control IgG2 (clone RTK2758, BioLegend).
FACS isolation of CD11b+ cells from MC38 tumors
Cells were obtained from harvested tumors as described above, and stained with LIVEDEAD® Fixable Violet and rat anti-CD11b-BV711 (clone M1/70, BioLegend), rat anti-F4/80-AF488 (clone BM8, BioLegend) and rat anti-CD45-PerCP-Cy5.5 (clone 30-F11, eBioscience) antibodies. CD45+CD11b+ cells were sorted using a 5-laser FACSAria Fusion SORP cell sorter (Becton Dickinson). FSC, SSC and CD45 (695/40) fluorescence were assessed using the 488 nm laser, whereas LD (450/50) and CD11b (710/50) fluorescence were measured with the 405 nm laser. All gates were set based on Fluorescence Minus One (FMO) controls and the temperature was kept at 4°C throughout the entire process.
Cell lysate preparation
Tumor-derived cells and cultured cells were washed in PBS and centrifuged at 500 x g for 5 min. Cell pellets were resuspended in ice-cold RIPA lysis buffer (Sigma) containing Halt™ protease and phosphatase inhibitors (Thermo Fisher Scientific) and incubated for 30 min at 4°C. FACS-sorted CD11b+ cells were lysed in PBS containing 2% SDS for 30 min at 4°C. Cell homogenates were centrifuged at 13,000 x g for 20 min and recovered supernatants were stored at −20°C.
Proteomic analysis by liquid chromatography-mass spectrometry (LC-MS/MS)
EVs (10 μg, in PBS solution) and cell lysates (10 μg, obtained as described above) were analyzed by LC-MS/MS, as previously described (Chopra et al., 2014, Cianciaruso et al., 2017, Keklikoglou et al., 2019). EVs obtained after sorting or immunoprecipitation were first resolved on a denaturing 4%–12% polyacrylamide gradient gel (Life Technologies) for a short (10 min at 150V) SDS-PAGE separation; proteins were directly eluted from gels. All samples were then digested in solution and peptides desalted using StageTips, dried in a vacuum concentrator and separated by reverse phase chromatography using a Dionex Ultimate 3000 RSLC nano UPLC system connected in-line with an Orbitrap Elite (Thermo Fisher Scientific).
For analysis, a database search was performed using Mascot 2.5 (Matrix Science) and SEQUEST in Proteome Discoverer v.1.4. against a murine Uniprot protein database. Data were further processed and inspected in Scaffold™ 4.8.7 (Proteome Software), as described below.
T cell proliferation and activation assays
Antigen-primed OT-I CD8+ T cells (see “T cells” section above) were labeled with the CellTrace Violet Cell Proliferation Kit, according to the to manufacturer’s instructions. Cells were then plated in U-bottom 96-well plates (Corning) at 5x10⁵ cells/ml in T cell medium prepared as described above, with the exception that no IL-2 was supplemented and 5% EV-depleted FBS was used instead of standard FBS. Control PBS or MC38-tumor-EVs (12.5 and 25 μg/ml) were then incubated with the cells for a total of 48h.
Naive CD8+ and CD4+ T cells from C57BL/6 mice were labeled with the CellTrace Violet (see above) and then incubated for 72h with MC38 tumor-EVs (25 μg/ml) or PBS in EV-depleted medium together with Mouse T-Activator CD3/CD28 Dynabeads (Thermo Fisher Scientific) at a 1:10 ratio (bead:T cell). Similarly, naive CD8+ were incubated for 48h with control DMSO or increasing concentrations of PGE2 and PGF2α (both from Cayman Chemical) together with CD3/CD28 Dynabeads at a 1:5 ratio (bead:T cell). In the allogenic assay, no CD3/CD28 Dynabeads were used, and CellTrace-labeled naive CD4+ T cells from BALB/c mice were incubated solely with MC38 tumor-EVs (25 μg/ml) or PBS for 24h-48h.
T cell proliferation was assessed by flow cytometry analysis, whereas IFNγ secretion in conditioned media was measured with the IFNγ mouse ELISA kit (Thermo Fisher Scientific).
BMDC assays
BMDCs were plated in U-bottom 96-well plates at 5x10⁵ cells/ml in BMDC medium prepared as described above, with the exception that 5% EV-depleted FBS was used instead of standard FBS. MC38 tumor-EVs (25 μg/ml) or PBS were then added. Expression of activation markers was assessed by flow cytometry after 24h.
Analysis of EV-treated cancer cells
Cancer cells were seeded on poly-L-lysine-coated glass chamber slides (Lab-Tek) or in 48- or 96-well plates (Corning) at a concentration of about 1x10⁵ cells/ml. Cells were incubated with unlabeled or PKH67-labeled tumor-derived EVs for 24h in EV-depleted medium. After incubation with the EVs, cells were washed with PBS and either fixed for immunofluorescence analysis or harvested for WB and flow cytometry analyses.
Analysis of media conditioned by EV-treated cancer cells
Cancer cells were seeded in 48- or 96-well plates (Corning) at a concentration of about 1x10⁵ cells/ml. Cells were incubated with tumor-derived EVs for 24h in EV-depleted medium. After incubation with the EVs, cells were washed with PBS and incubated with EV-depleted medium containing the calcium ionophore A23187 (2 μM, Sigma) for 20 min at 37°C. Conditioned media were collected and snap-frozen in liquid nitrogen prior to ELISA and LC-MS/MS lipidomic analysis.
ELISA
The concentration of PGE2 and TXB2 in media conditioned by EV-treated cancer cells was analyzed by ELISA (Enzo) according to the manufacturer’s instructions. Absorbance was measured using a TECAN Safire2 plate-reader.
Analysis of eicosanoid and other oxylipins by LC-MS/MS
Tumor-derived EVs (100 μg in 45 μL of PBS) and conditioned media (490 μL) were spiked with 10 μL of internal standard (IS) solution and extracted with 200 μL and 500 μL of extraction buffer solution (Na2HPO4: citric acid, pH 5.6), respectively (Kolmert et al., 2018). Sample extracts were then loaded onto the Solid Phase Extraction (SPE) cartridge (Oasis HLB 60 mg 96-well Plate, Waters) previously conditioned with methanol and water. Loaded samples were then washed with water/methanol (90:10, v/v) and eluted with methanol (2x750 μL). The eicosanoid extracts were further evaporated to dryness using N2 gas (Turbo Vap LV, Biotage) and reconstituted in 60 μL of methanol prior to injection into the LC-MS/MS system.
Snap-frozen MC38 tumors (∼100 mg) were transferred to lysis tubes with ceramic beads (tissue homogenization CK 14 tubes). Samples were homogenized and extracted with 1 mL of ice-cold methanol:water (4:1, v/v) in the Cryolys Percellys homogenizer (5 × 10 s at 10000 rpm, Bertin Technologies). The bead beater was air-cooled at a flow rate of 110 L/min at 10 bar. Homogenized tissue lysates were centrifuged (15 min, 4000 x g at 4°C) and the supernatants (lipid extracts) were evaporated to dryness in a SpeedVac (Labconco) at constant temperature (20°C, CentriVap Cold Trap). The dry extracts were reconstituted by the addition of 90 μl of methanol, 10 μL of IS solution and 900 μl of extraction buffer and subject to SPE, as described above.
Eicosanoid analysis was performed by ultra high performance LC-MS/MS in negative ionization mode using a 1290 UHPLC system coupled to a 6495 triple quadrupole instrument (Agilent). Chromatographic separation was carried out using the Acquity UPLC BEH C18 (1.7 μm, 2.1 mm ID x 150 mm) column (Waters). Mobile phase was composed of 0.1% acetic acid in water (solvent A) and ACN/2-propanol (9:1, v/v) (solvent B) at a flow rate of 0.5 mL/min at 60°C using a gradient elution as described by Kolmert et al. (2018). Dynamic multiple reaction monitoring (DMRM) was used to acquire the data with a total cycle time of 600 ms. Raw LC-MS/MS data were processed using MassHunter (version B.07.00, Agilent). Absolute quantification was performed using standard calibration curves and stable isotope-labeled internal standards. Relative quantification of eicosanoids was based on the areas of extracted ion chromatograms (EICs). Concentration of specific metabolites was calculated as the ratio between the analyte and the internal standard. For analytes for which the standards were not available, relative quantification was performed using the peak areas of extracted ion chromatograms (EICs).
Lipidome analysis by reversed phase liquid chromatography coupled to high-resolution mass spectrometry (RPLC-HRMS)
Tumor-derived EVs (100 μg in 45 μL of PBS) were extracted with ice-cold methanol (200 μL). Samples were vortexed for 20 s and centrifuged at 15,000 x g for 10 min at 4°C. An aliquot of supernatant was transferred to an injection vial for the analysis by RPLC-HRMS. The analysis was carried out in a 1290 Infinity II ultra high-performance liquid chromatography (UHPLC) system coupled to a 6550 iFunnel quadrupole-time-of-flight (Q-TOF) mass spectrometer equipped with a dual AJS electrospray ionization source (Agilent) operating in both positive and negative mode. Lipids were separated on a RP Zorbax Eclipse Plus C18, RRHD (Agilent) (100 mm × 2.1 mm, 1.8 μm particle size) column coupled to a guard column (5 mm × 2 mm, 1.8 μm particle size). Analysis in both positive and negative mode was performed using water with 0.1% formic acid (solvent A) and 2-propanol: acetonitrile (90:10, v/v) with 0.1% formic acid (solvent B). The gradient elution was set as follows: isocratic step of 5% B for 3 min, 5% to 30% B in 2 min, then B was increased to 98% in 13.5 min, maintained at 98% B for 1.5 min, and returned to initial conditions over 0.5 min, then held for a further 4.5 min for column re-equilibration. The flow rate was 0.4 ml/min, injection volume was 2 μL, and the column oven was maintained at 50°C.
The acquisition was done in AIF mode with a mass range of 50-1200 m/z, where a single full scan high-resolution data was acquired in three sequential experiments at three alternating collision energies (one full-scan at 0 eV, followed by one MS/MS scan at 10 eV and then followed by one MS/MS scan at 30 eV). The data acquisition rate was 6 scans/s (Naz et al., 2017). Raw LC-HRMS files were processed using the MassHunter Profinder software (Agilent). The relative quantification of lipids was based on EIC (Extracted Ion Chromatograms) areas at the MS level. Lipid identification was performed by AMRT (accurate mass retention time) matching against an in-house database containing several hundreds of lipids using the MassHunter PCDL software (Agilent).
Quantification and Statistical Analysis
Image processing
Confocal microscopy images and WB images were analyzed and quantified using FIJI ImageJ.
TaqMan analysis of miRNAs
The SDS 2.4 software was used to extract gene expression raw data (Ct). To determine gene expression of miRs, we calculated the difference (ΔCt) between the threshold cycle (Ct) of each gene and that of the reference gene (miR-16-5p). The lower the ΔCt, the higher the gene expression level. Gene expression results are indicated as relative copies calculated with the 2-ΔCT method. Ct values were normalized as indicated in the figure legends.
Analysis of LC-MS/MS proteomic data
All peptide/protein data were processed using the Scaffold 4.8.7 (Proteome Software). False discovery rate (FDR) calculation was set to 1% at both peptide and protein levels for the whole study. A protein was considered present if identified by at least three distinct peptides, with the exception of the CD11b IP experiment, in which we used a threshold of at least two peptides. To compare the proteomic profiles of EVs, quantitative values (normalized to total spectra) were used in all experiments, with the exception of the CD11b IP experiment, in which exclusive spectrum counts were used instead.
Proteins enriched in IgG-EVs versus anti-CSF1R-EVs from MC38 tumors were positively selected according to the following criteria: i) detection in all IgG-EV preparations; ii) fold-change abundance > 1.5 within each experiment; iii) mean fold-change abundance among all experiments > 1.7. Reciprocally, proteins enriched in anti-CSF1R-EVs versus IgG-EVs were selected based on: i) detection in all anti-CSF1R-EV preparations; ii) fold-change abundance > 1.5 within each experiment; iii) mean fold-change abundance among all experiments > 1.7.
Proteins enriched in IgG-Cells versus anti-CSF1R-Cells from MC38 tumors were positively selected according to the following criteria: i) detection in all preparations of FACS-sorted CD11b+ cells from IgG-treated tumors; ii) mean fold-change abundance versus FACS-sorted CD11b+ cells from anti-CSF1R-treated tumors > 1.7.
Proteins of MC38-EVs and BMM-EVs were positively selected only if detected in all tested EV preparations.
Proteins of CD11b-immunoprecipiated MC38 IgG-EVs were positively selected if their fold-change abundance versus isotype control-immunoprecipitated IgG-EVs was > 2. Because IP data were generated from only one IgG-EV preparation, we employed a stricter threshold (FC > 2) in the IP experiment compared to the differential analyses of IgG-EVs versus anti-CSF1R-EVs (see above). In addition, proteins that were recovered nonspecifically in numerous IP experiments (namely in at least 10% of all the experiments reported in the CRAPome database) were excluded from the final list (Kowal et al., 2016, Mellacheruvu et al., 2013).
Proteins enriched in IgG-EVs versus anti-CSF1R-EVs from E0771 tumors were positively selected according to the following criteria: i) detection in all IgG-EV preparations; ii) mean fold-change abundance versus anti-CSF1R-EVs > 1.7.
Bioinformatics analysis
Over-representation analysis of Gene Ontology (GO) terms was performed using the hypergeometric test as implemented in the Molecular Signature Database (MSigDB) web tool (Liberzon et al., 2011). Immune cell type specificity of genes encoding for candidate proteins was assessed using Immuno-Navigator database (Vandenbon et al., 2016). In brief, mouse gene expression data was obtained from the Immuno-Navigator database, summarized per cell type using median expression, and visualized using the pheatmap R package (see Pheatmap: Pretty Heatmaps. R package version 1.0.10), Pheatmap: Pretty Heatmaps. R package version 1.0.10. https://cran.r-project.org/web/packages/pheatmap/index.html) with clustering distance and method set to Euclidean and ward.D2, respectively. Protein-protein interaction (PPI) network including both direct (physical) and indirect (functional) interaction of candidate proteins was generated using String database web tool (Szklarczyk et al., 2017).
The radial table of the TAM-EV signature was generated using Circos Table Viewer software (v0.63-9) (Krzywinski et al., 2009).
Enrichment of genes encoding for candidate proteins in sorted TAMs was performed using publicly available data (GEO repository, accession number GSE34903) from Squadrito et al., (2012) and gene set enrichment analysis (GSEA) (Subramanian et al., 2005). In brief, matrix of gene-by-sample raw counts was obtained from ARCHS4 database (Lachmann et al., 2018) and count data were normalized using the cpm functionality within edgeR Bioconductor package (Robinson et al., 2010). Consequently, GSEA was performed using fgsea Bioconductor package (Sergushichev, 2016), with signal to noise statistic defined in (Subramanian et al., 2005) as gene ranking criterion.
To assess the association of genes encoding for candidate proteins with prognosis across human cancers, meta-z values summarizing the extent and directionality of association between gene expression and clinical outcome were obtained from the PRECOG database (Gentles et al., 2015). Enrichment analysis was performed using the fgsea Bioconductor package (Sergushichev, 2016), with meta-z values as gene ranking criterion.
Statistical analysis and reproducibility
Information on the study outline, sample size and statistical analysis is presented in the main text, figures, and figure legends. Each study involving tumor-bearing mice was designed to use the minimum number of animals required to obtain sufficient material for further studies (i.e., EV isolation and quantitative data suited to statistical analysis). In the MC38 tumor model, multiple tumors were pooled together from the same experimental cohort before EV isolation; in the E0771 tumor model, each EV preparation was obtained from one tumor.
The investigators were not blinded when assessing the results or analyzing data. Outliers at end-point were not excluded. No specific statistical tests were used to predetermine the sample size. The number of biological replicates for each experiment is indicated in the figure legends; statistics were only computed on independent, non-technical replicates. Multiple EV preparations were obtained and assayed in independent experiments. All functional assays involving EVs and cultured cells were repeated at least in two independent experiments, each containing at least three biological replicates. However, representative samples are often shown in the figures; additional experiments can be requested from the corresponding authors.
Statistical analysis was performed using GraphPad Prism software. Data are shown as mean values ± standard error of the mean (s.e.m.) for most of the analyses, with the exception of experiments with a sample size n = 3, in which mean values ± standard deviation (s.d.) are reported. Statistics were not derived for experiments in which the sample size was < 3.
Statistical analysis of experiments that involved more than two experimental groups was conducted using one-way ANOVA with Tukey’s or Dunnett’s correction for multiple comparisons. When the influence of two nominal variables on one measurement variable was examined, a two-way ANOVA followed by Sidak’s, Dunnett’s or Tukey’s correction was used in most of the experiments; Holm-Sidak’s correction was used only in the analysis of pre-selected differentially-abundant EV proteins. When specified, in some analyses of lipid MS data, multiple t tests using Holm-Sidak’s multiple comparison correction were used to compare multiple variables between two groups. Experiments with a single variable measured in two groups were analyzed with unpaired two-tailed Student’s t test with 95% confidence interval.
Statistical significance of the data is indicated as follows: ∗p < 0.05; ∗∗p < 0.01; ∗∗∗p < 0.001; ∗∗∗∗p < 0.0001.
Data and Software Availability
We have submitted all relevant EV data to the EV-TRACK knowledgebase (EV-TRACK Consortium et al., 2017), available with EV-TRACK ID: EV190011. Uncropped western blots are available as Mendeley Dataset with https://doi.org/10.17632/zj43mmthr8.1. Processed proteomic data are shown in Tables S1, S2, S3, S4, S5, S6, and S7. Proteomic raw data are available from the Lead Contact upon request.
Acknowledgments
We thank Alan Guichard, Celine Rmili-Wyser, Amedeo Giussani (M.D.P.’s lab), and Tony Teav (J.I.’s lab) for help with some experiments. The EPFL core facilities of mass spectrometry (PCF), flow cytometry (FCCF), bioimaging-optics (BIOp), electron microscopy (BioEM) and histology (HCF), and the UNIL Metabolomics Unit are acknowledged for advice and skilled technical assistance. T.B. was supported by the MD-PhD Program of the Swiss National Science Foundation (SNF) and the Swiss Academy of Medical Sciences (SAMS) (SNF 323530-171136/1). This work was funded by grants from the European Research Council (ERC-EVOLVE-725051) and the Swiss National Science Foundation (SNF 31003A-165963) to M.D.P.
Author Contributions
C.C., T.B., and F.D. designed and performed experiments and analyzed and interpreted the data. S.N. performed bioinformatics analyses. R.H. performed protein MS experiments. A.M. performed FACS isolation of EVs. H.G.-A. and J.I. performed and interpreted lipid MS experiments. G.C.T. and B.T. helped with some experiments. C.H.R. provided 2G2 and advised on treatment schedules. C.C. co-supervised research and wrote the manuscript with T.B. and F.D. M.D.P. co-supervised research, interpreted the data, and edited the manuscript. All authors provided intellectual input and reviewed the data.
Declaration of Interests
C.H.R. is a Roche employee and filed patent applications on CSF1R blockade for targeting macrophages (WO2011107553A1 and WO2013132044A1). M.D.P. reports honoraria from Merck and Sanofi-Regeneron Pharmaceuticals, received sponsored research grants from Hoffmann La-Roche, MedImmune and Deciphera Pharmaceuticals, and serves on the Scientific Advisory Boards of Deciphera Pharmaceuticals and Genenta. The other authors declare no competing interests.
Published: June 4, 2019
Footnotes
Supplemental Information can be found online at https://doi.org/10.1016/j.celrep.2019.05.008.
Contributor Information
Chiara Cianciaruso, Email: chiara.cianciaruso@epfl.ch.
Michele De Palma, Email: michele.depalma@epfl.ch.
Supplemental Information
References
- Baer C., Squadrito M.L., Laoui D., Thompson D., Hansen S.K., Kiialainen A., Hoves S., Ries C.H., Ooi C.H., De Palma M. Suppression of microRNA activity amplifies IFN-γ-induced macrophage activation and promotes anti-tumour immunity. Nat. Cell Biol. 2016;18:790–802. doi: 10.1038/ncb3371. [DOI] [PubMed] [Google Scholar]; Baer, C., Squadrito, M.L., Laoui, D., Thompson, D., Hansen, S.K., Kiialainen, A., Hoves, S., Ries, C.H., Ooi, C.H., and De Palma, M. (2016). Suppression of microRNA activity amplifies IFN-γ-induced macrophage activation and promotes anti-tumour immunity. Nat. Cell Biol. 18, 790-802. [DOI] [PubMed]
- Barreira da Silva R., Albert M.L. Mouse CD8+ T Cell Migration in vitro and CXCR3 Internalization Assays. Bio. Protoc. 2017;7:e2185. doi: 10.21769/BioProtoc.2185. [DOI] [PMC free article] [PubMed] [Google Scholar]; Barreira da Silva, R., and Albert, M.L. (2017). Mouse CD8+ T Cell Migration in vitro and CXCR3 Internalization Assays. Bio. Protoc. 7, e2185. [DOI] [PMC free article] [PubMed]
- Becker A., Thakur B.K., Weiss J.M., Kim H.S., Peinado H., Lyden D. Extracellular Vesicles in Cancer: Cell-to-Cell Mediators of Metastasis. Cancer Cell. 2016;30:836–848. doi: 10.1016/j.ccell.2016.10.009. [DOI] [PMC free article] [PubMed] [Google Scholar]; Becker, A., Thakur, B.K., Weiss, J.M., Kim, H.S., Peinado, H., and Lyden, D. (2016). Extracellular Vesicles in Cancer: Cell-to-Cell Mediators of Metastasis. Cancer Cell 30, 836-848. [DOI] [PMC free article] [PubMed]
- Bobrie A., Colombo M., Krumeich S., Raposo G., Théry C. Diverse subpopulations of vesicles secreted by different intracellular mechanisms are present in exosome preparations obtained by differential ultracentrifugation. J. Extracell. Vesicles. 2012;1:1. doi: 10.3402/jev.v1i0.18397. [DOI] [PMC free article] [PubMed] [Google Scholar]; Bobrie, A., Colombo, M., Krumeich, S., Raposo, G., and Thery, C. (2012). Diverse subpopulations of vesicles secreted by different intracellular mechanisms are present in exosome preparations obtained by differential ultracentrifugation. J. Extracell. Vesicles 1, 1. [DOI] [PMC free article] [PubMed]
- Boilard E. Extracellular vesicles and their content in bioactive lipid mediators: more than a sack of microRNA. J. Lipid Res. 2018;59:2037–2046. doi: 10.1194/jlr.R084640. [DOI] [PMC free article] [PubMed] [Google Scholar]; Boilard, E. (2018). Extracellular vesicles and their content in bioactive lipid mediators: more than a sack of microRNA. J. Lipid Res. 59, 2037-2046. [DOI] [PMC free article] [PubMed]
- Bowman R.L., Klemm F., Akkari L., Pyonteck S.M., Sevenich L., Quail D.F., Dhara S., Simpson K., Gardner E.E., Iacobuzio-Donahue C.A. Macrophage Ontogeny Underlies Differences in Tumor-Specific Education in Brain Malignancies. Cell Rep. 2016;17:2445–2459. doi: 10.1016/j.celrep.2016.10.052. [DOI] [PMC free article] [PubMed] [Google Scholar]; Bowman, R.L., Klemm, F., Akkari, L., Pyonteck, S.M., Sevenich, L., Quail, D.F., Dhara, S., Simpson, K., Gardner, E.E., Iacobuzio-Donahue, C.A., et al. (2016). Macrophage Ontogeny Underlies Differences in Tumor-Specific Education in Brain Malignancies. Cell Rep. 17, 2445-2459. [DOI] [PMC free article] [PubMed]
- Caruso S., Poon I.K.H. Apoptotic Cell-Derived Extracellular Vesicles: More Than Just Debris. Front. Immunol. 2018;9:1486. doi: 10.3389/fimmu.2018.01486. [DOI] [PMC free article] [PubMed] [Google Scholar]; Caruso, S., and Poon, I.K.H. (2018). Apoptotic Cell-Derived Extracellular Vesicles: More Than Just Debris. Front. Immunol. 9, 1486. [DOI] [PMC free article] [PubMed]
- Cassetta L., Pollard J.W. Targeting macrophages: therapeutic approaches in cancer. Nat. Rev. Drug Discov. 2018;17:887–904. doi: 10.1038/nrd.2018.169. [DOI] [PubMed] [Google Scholar]; Cassetta, L., and Pollard, J.W. (2018). Targeting macrophages: therapeutic approaches in cancer. Nat. Rev. Drug Discov. 17, 887-904. [DOI] [PubMed]
- Chen F., Chen J., Yang L., Liu J., Zhang X., Zhang Y., Tu Q., Yin D., Lin D., Wong P.P. Extracellular vesicle-packaged HIF-1α-stabilizing lncRNA from tumour-associated macrophages regulates aerobic glycolysis of breast cancer cells. Nat. Cell Biol. 2019;21:498–510. doi: 10.1038/s41556-019-0299-0. [DOI] [PubMed] [Google Scholar]; Chen, F., Chen, J., Yang, L., Liu, J., Zhang, X., Zhang, Y., Tu, Q., Yin, D., Lin, D., Wong, P.P., et al. (2019). Extracellular vesicle-packaged HIF-1α-stabilizing lncRNA from tumour-associated macrophages regulates aerobic glycolysis of breast cancer cells. Nat. Cell Biol. 21, 498-510. [DOI] [PubMed]
- Chiou N.-T., Ansel M.K. Improved exosome isolation by sucrose gradient fractionation of ultracentrifuged crude exosome pellets. Protoc. Exch. 2016 Published online August 23, 2016. [Google Scholar]; Chiou, N.-T., and Ansel, M.K. (2016). Improved exosome isolation by sucrose gradient fractionation of ultracentrifuged crude exosome pellets. Protoc. Exch. Published online August 23, 2016. 10.1038/protex.2016.057.
- Chopra T., Hamelin R., Armand F., Chiappe D., Moniatte M., McKinney J.D. Quantitative mass spectrometry reveals plasticity of metabolic networks in Mycobacterium smegmatis. Mol. Cell. Proteomics. 2014;13:3014–3028. doi: 10.1074/mcp.M113.034082. [DOI] [PMC free article] [PubMed] [Google Scholar]; Chopra, T., Hamelin, R., Armand, F., Chiappe, D., Moniatte, M., and McKinney, J.D. (2014). Quantitative mass spectrometry reveals plasticity of metabolic networks in Mycobacterium smegmatis. Mol. Cell. Proteomics 13, 3014-3028. [DOI] [PMC free article] [PubMed]
- Cianciaruso C., Phelps E.A., Pasquier M., Hamelin R., Demurtas D., Alibashe Ahmed M., Piemonti L., Hirosue S., Swartz M.A., De Palma M. Primary Human and Rat β-Cells Release the Intracellular Autoantigens GAD65, IA-2, and Proinsulin in Exosomes Together With Cytokine-Induced Enhancers of Immunity. Diabetes. 2017;66:460–473. doi: 10.2337/db16-0671. [DOI] [PubMed] [Google Scholar]; Cianciaruso, C., Phelps, E.A., Pasquier, M., Hamelin, R., Demurtas, D., Alibashe Ahmed, M., Piemonti, L., Hirosue, S., Swartz, M.A., De Palma, M., et al. (2017). Primary Human and Rat β-Cells Release the Intracellular Autoantigens GAD65, IA-2, and Proinsulin in Exosomes Together With Cytokine-Induced Enhancers of Immunity. Diabetes 66, 460-473. [DOI] [PubMed]
- Clausen B.E., Burkhardt C., Reith W., Renkawitz R., Förster I. Conditional gene targeting in macrophages and granulocytes using LysMcre mice. Transgenic Res. 1999;8:265–277. doi: 10.1023/a:1008942828960. [DOI] [PubMed] [Google Scholar]; Clausen, B.E., Burkhardt, C., Reith, W., Renkawitz, R., and Forster, I. (1999). Conditional gene targeting in macrophages and granulocytes using LysMcre mice. Transgenic Res. 8, 265-277. [DOI] [PubMed]
- Colby J.K., Jaoude J., Liu F., Shureiqi I. Oxygenated lipid signaling in tumor-associated macrophages-focus on colon cancer. Cancer Metastasis Rev. 2018;37:289–315. doi: 10.1007/s10555-018-9743-z. [DOI] [PubMed] [Google Scholar]; Colby, J.K., Jaoude, J., Liu, F., and Shureiqi, I. (2018). Oxygenated lipid signaling in tumor-associated macrophages-focus on colon cancer. Cancer Metastasis Rev. 37, 289-315. [DOI] [PubMed]
- Colombo M., Raposo G., Théry C. Biogenesis, secretion, and intercellular interactions of exosomes and other extracellular vesicles. Annu. Rev. Cell Dev. Biol. 2014;30:255–289. doi: 10.1146/annurev-cellbio-101512-122326. [DOI] [PubMed] [Google Scholar]; Colombo, M., Raposo, G., and Thery, C. (2014). Biogenesis, secretion, and intercellular interactions of exosomes and other extracellular vesicles. Annu. Rev. Cell Dev. Biol. 30, 255-289. [DOI] [PubMed]
- Crewe C., Joffin N., Rutkowski J.M., Kim M., Zhang F., Towler D.A., Gordillo R., Scherer P.E. An Endothelial-to-Adipocyte Extracellular Vesicle Axis Governed by Metabolic State. Cell. 2018;175:695–708.e613. doi: 10.1016/j.cell.2018.09.005. [DOI] [PMC free article] [PubMed] [Google Scholar]; Crewe, C., Joffin, N., Rutkowski, J.M., Kim, M., Zhang, F., Towler, D.A., Gordillo, R., and Scherer, P.E. (2018). An Endothelial-to-Adipocyte Extracellular Vesicle Axis Governed by Metabolic State. Cell 175, 695-708.e613. [DOI] [PMC free article] [PubMed]
- De Palma M., Lewis C.E. Macrophage regulation of tumor responses to anticancer therapies. Cancer Cell. 2013;23:277–286. doi: 10.1016/j.ccr.2013.02.013. [DOI] [PubMed] [Google Scholar]; De Palma, M., and Lewis, C.E. (2013). Macrophage regulation of tumor responses to anticancer therapies. Cancer Cell 23, 277-286. [DOI] [PubMed]
- De Palma M., Venneri M.A., Roca C., Naldini L. Targeting exogenous genes to tumor angiogenesis by transplantation of genetically modified hematopoietic stem cells. Nat. Med. 2003;9:789–795. doi: 10.1038/nm871. [DOI] [PubMed] [Google Scholar]; De Palma, M., Venneri, M.A., Roca, C., and Naldini, L. (2003). Targeting exogenous genes to tumor angiogenesis by transplantation of genetically modified hematopoietic stem cells. Nat. Med. 9, 789-795. [DOI] [PubMed]
- De Palma M., Biziato D., Petrova T.V. Microenvironmental regulation of tumour angiogenesis. Nat. Rev. Cancer. 2017;17:457–474. doi: 10.1038/nrc.2017.51. [DOI] [PubMed] [Google Scholar]; De Palma, M., Biziato, D., and Petrova, T.V. (2017). Microenvironmental regulation of tumour angiogenesis. Nat. Rev. Cancer 17, 457-474. [DOI] [PubMed]
- DeNardo D.G., Ruffell B. Macrophages as regulators of tumour immunity and immunotherapy. Nat. Rev. Immunol. 2019 doi: 10.1038/s41577-019-0127-6. Published online February 4, 2019. [DOI] [PMC free article] [PubMed] [Google Scholar]; DeNardo, D.G., and Ruffell, B. (2019). Macrophages as regulators of tumour immunity and immunotherapy. Nat. Rev. Immunol. Published online February 4, 2019. 10.1038/s41577-019-0127-6. [DOI] [PMC free article] [PubMed]
- Dennis E.A., Norris P.C. Eicosanoid storm in infection and inflammation. Nat. Rev. Immunol. 2015;15:511–523. doi: 10.1038/nri3859. [DOI] [PMC free article] [PubMed] [Google Scholar]; Dennis, E.A., and Norris, P.C. (2015). Eicosanoid storm in infection and inflammation. Nat. Rev. Immunol. 15, 511-523. [DOI] [PMC free article] [PubMed]
- Eden E.R., White I.J., Tsapara A., Futter C.E. Membrane contacts between endosomes and ER provide sites for PTP1B-epidermal growth factor receptor interaction. Nat. Cell Biol. 2010;12:267–272. doi: 10.1038/ncb2026. [DOI] [PubMed] [Google Scholar]; Eden, E.R., White, I.J., Tsapara, A., and Futter, C.E. (2010). Membrane contacts between endosomes and ER provide sites for PTP1B-epidermal growth factor receptor interaction. Nat. Cell Biol. 12, 267-272. [DOI] [PubMed]
- Egeblad M., Nakasone E.S., Werb Z. Tumors as organs: complex tissues that interface with the entire organism. Dev. Cell. 2010;18:884–901. doi: 10.1016/j.devcel.2010.05.012. [DOI] [PMC free article] [PubMed] [Google Scholar]; Egeblad, M., Nakasone, E.S., and Werb, Z. (2010). Tumors as organs: complex tissues that interface with the entire organism. Dev. Cell 18, 884-901. [DOI] [PMC free article] [PubMed]
- Esser J., Gehrmann U., D’Alexandri F.L., Hidalgo-Estevez A.M., Wheelock C.E., Scheynius A., Gabrielsson S., Radmark O. Exosomes from human macrophages and dendritic cells contain enzymes for leukotriene biosynthesis and promote granulocyte migration. J. Allergy Clin. Immunol. 2010;126:1032–1040. doi: 10.1016/j.jaci.2010.06.039. 1040.e1031–1034. [DOI] [PubMed] [Google Scholar]; Esser, J., Gehrmann, U., D’Alexandri, F.L., Hidalgo-Estevez, A.M., Wheelock, C.E., Scheynius, A., Gabrielsson, S., and Radmark, O. (2010). Exosomes from human macrophages and dendritic cells contain enzymes for leukotriene biosynthesis and promote granulocyte migration. J. Allergy Clin. Immunol. 126, 1032-1040, 1040.e1031-1034. [DOI] [PubMed]
- EV-TRACK Consortium. Van Deun J., Mestdagh P., Agostinis P., Akay O., Anand S., Anckaert J., Martinez Z.A., Baetens T., Beghein E. EV-TRACK: transparent reporting and centralizing knowledge in extracellular vesicle research. Nat. Methods. 2017;14:228–232. doi: 10.1038/nmeth.4185. [DOI] [PubMed] [Google Scholar]; EV-TRACK Consortium, Van Deun, J., Mestdagh, P., Agostinis, P., Akay, O., Anand, S., Anckaert, J., Martinez, Z.A., Baetens, T., Beghein, E., et al. (2017). EV-TRACK: transparent reporting and centralizing knowledge in extracellular vesicle research. Nat. Methods 14, 228-232. [DOI] [PubMed]
- Fabre J.E., Goulet J.L., Riche E., Nguyen M., Coggins K., Offenbacher S., Koller B.H. Transcellular biosynthesis contributes to the production of leukotrienes during inflammatory responses in vivo. J. Clin. Invest. 2002;109:1373–1380. doi: 10.1172/JCI14869. [DOI] [PMC free article] [PubMed] [Google Scholar]; Fabre, J.E., Goulet, J.L., Riche, E., Nguyen, M., Coggins, K., Offenbacher, S., and Koller, B.H. (2002). Transcellular biosynthesis contributes to the production of leukotrienes during inflammatory responses in vivo. J. Clin. Invest. 109, 1373-1380. [DOI] [PMC free article] [PubMed]
- Gabrilovich D.I. Myeloid-Derived Suppressor Cells. Cancer Immunol. Res. 2017;5:3–8. doi: 10.1158/2326-6066.CIR-16-0297. [DOI] [PMC free article] [PubMed] [Google Scholar]; Gabrilovich, D.I. (2017). Myeloid-Derived Suppressor Cells. Cancer Immunol. Res. 5, 3-8. [DOI] [PMC free article] [PubMed]
- Galluzzi L., Kepp O., Kroemer G. Enlightening the impact of immunogenic cell death in photodynamic cancer therapy. EMBO J. 2012;31:1055–1057. doi: 10.1038/emboj.2012.2. [DOI] [PMC free article] [PubMed] [Google Scholar]; Galluzzi, L., Kepp, O., and Kroemer, G. (2012). Enlightening the impact of immunogenic cell death in photodynamic cancer therapy. EMBO J. 31, 1055-1057. [DOI] [PMC free article] [PubMed]
- Gentles A.J., Newman A.M., Liu C.L., Bratman S.V., Feng W., Kim D., Nair V.S., Xu Y., Khuong A., Hoang C.D. The prognostic landscape of genes and infiltrating immune cells across human cancers. Nat. Med. 2015;21:938–945. doi: 10.1038/nm.3909. [DOI] [PMC free article] [PubMed] [Google Scholar]; Gentles, A.J., Newman, A.M., Liu, C.L., Bratman, S.V., Feng, W., Kim, D., Nair, V.S., Xu, Y., Khuong, A., Hoang, C.D., et al. (2015). The prognostic landscape of genes and infiltrating immune cells across human cancers. Nat. Med. 21, 938-945. [DOI] [PMC free article] [PubMed]
- Hanahan D., Coussens L.M. Accessories to the crime: functions of cells recruited to the tumor microenvironment. Cancer Cell. 2012;21:309–322. doi: 10.1016/j.ccr.2012.02.022. [DOI] [PubMed] [Google Scholar]; Hanahan, D., and Coussens, L.M. (2012). Accessories to the crime: functions of cells recruited to the tumor microenvironment. Cancer Cell 21, 309-322. [DOI] [PubMed]
- Hogquist K.A., Jameson S.C., Heath W.R., Howard J.L., Bevan M.J., Carbone F.R. T cell receptor antagonist peptides induce positive selection. Cell. 1994;76:17–27. doi: 10.1016/0092-8674(94)90169-4. [DOI] [PubMed] [Google Scholar]; Hogquist, K.A., Jameson, S.C., Heath, W.R., Howard, J.L., Bevan, M.J., and Carbone, F.R. (1994). T cell receptor antagonist peptides induce positive selection. Cell 76, 17-27. [DOI] [PubMed]
- Hoves S., Ooi C.H., Wolter C., Sade H., Bissinger S., Schmittnaegel M., Ast O., Giusti A.M., Wartha K., Runza V. Rapid activation of tumor-associated macrophages boosts preexisting tumor immunity. J. Exp. Med. 2018;215:859–876. doi: 10.1084/jem.20171440. [DOI] [PMC free article] [PubMed] [Google Scholar]; Hoves, S., Ooi, C.H., Wolter, C., Sade, H., Bissinger, S., Schmittnaegel, M., Ast, O., Giusti, A.M., Wartha, K., Runza, V., et al. (2018). Rapid activation of tumor-associated macrophages boosts preexisting tumor immunity. J. Exp. Med. 215, 859-876. [DOI] [PMC free article] [PubMed]
- Ippagunta S.K., Malireddi R.K., Shaw P.J., Neale G.A., Vande Walle L., Green D.R., Fukui Y., Lamkanfi M., Kanneganti T.D. The inflammasome adaptor ASC regulates the function of adaptive immune cells by controlling Dock2-mediated Rac activation and actin polymerization. Nat. Immunol. 2011;12:1010–1016. doi: 10.1038/ni.2095. [DOI] [PMC free article] [PubMed] [Google Scholar]; Ippagunta, S.K., Malireddi, R.K., Shaw, P.J., Neale, G.A., Vande Walle, L., Green, D.R., Fukui, Y., Lamkanfi, M., and Kanneganti, T.D. (2011). The inflammasome adaptor ASC regulates the function of adaptive immune cells by controlling Dock2-mediated Rac activation and actin polymerization. Nat. Immunol. 12, 1010-1016. [DOI] [PMC free article] [PubMed]
- Jeppesen D.K., Fenix A.M., Franklin J.L., Higginbotham J.N., Zhang Q., Zimmerman L.J., Liebler D.C., Ping J., Liu Q., Evans R. Reassessment of Exosome Composition. Cell. 2019;177:428–445.e418. doi: 10.1016/j.cell.2019.02.029. [DOI] [PMC free article] [PubMed] [Google Scholar]; Jeppesen, D.K., Fenix, A.M., Franklin, J.L., Higginbotham, J.N., Zhang, Q., Zimmerman, L.J., Liebler, D.C., Ping, J., Liu, Q., Evans, R., et al. (2019). Reassessment of Exosome Composition. Cell 177, 428-445.e418. [DOI] [PMC free article] [PubMed]
- Keklikoglou I., Kadioglu E., Bissinger S., Langlois B., Bellotti A., Orend G., Ries C.H., De Palma M. Periostin Limits Tumor Response to VEGFA Inhibition. Cell Rep. 2018;22:2530–2540. doi: 10.1016/j.celrep.2018.02.035. [DOI] [PubMed] [Google Scholar]; Keklikoglou, I., Kadioglu, E., Bissinger, S., Langlois, B., Bellotti, A., Orend, G., Ries, C.H., and De Palma, M. (2018). Periostin Limits Tumor Response to VEGFA Inhibition. Cell Rep. 22, 2530-2540. [DOI] [PubMed]
- Keklikoglou I., Cianciaruso C., Güç E., Squadrito M.L., Spring L.M., Tazzyman S., Lambein L., Poissonnier A., Ferraro G.B., Baer C. Chemotherapy elicits pro-metastatic extracellular vesicles in breast cancer models. Nat. Cell Biol. 2019;21:190–202. doi: 10.1038/s41556-018-0256-3. [DOI] [PMC free article] [PubMed] [Google Scholar]; Keklikoglou, I., Cianciaruso, C., Guç, E., Squadrito, M.L., Spring, L.M., Tazzyman, S., Lambein, L., Poissonnier, A., Ferraro, G.B., Baer, C., et al. (2019). Chemotherapy elicits pro-metastatic extracellular vesicles in breast cancer models. Nat. Cell Biol. 21, 190-202. [DOI] [PMC free article] [PubMed]
- Kolmert J., Fauland A., Fuchs D., Säfholm J., Gómez C., Adner M., Dahlén S.E., Wheelock C.E. Lipid Mediator Quantification in Isolated Human and Guinea Pig Airways: An Expanded Approach for Respiratory Research. Anal. Chem. 2018;90:10239–10248. doi: 10.1021/acs.analchem.8b01651. [DOI] [PubMed] [Google Scholar]; Kolmert, J., Fauland, A., Fuchs, D., Safholm, J., Gomez, C., Adner, M., Dahlen, S.E., and Wheelock, C.E. (2018). Lipid Mediator Quantification in Isolated Human and Guinea Pig Airways: An Expanded Approach for Respiratory Research. Anal. Chem. 90, 10239-10248. [DOI] [PubMed]
- Kowal J., Arras G., Colombo M., Jouve M., Morath J.P., Primdal-Bengtson B., Dingli F., Loew D., Tkach M., Théry C. Proteomic comparison defines novel markers to characterize heterogeneous populations of extracellular vesicle subtypes. Proc. Natl. Acad. Sci. USA. 2016;113:E968–E977. doi: 10.1073/pnas.1521230113. [DOI] [PMC free article] [PubMed] [Google Scholar]; Kowal, J., Arras, G., Colombo, M., Jouve, M., Morath, J.P., Primdal-Bengtson, B., Dingli, F., Loew, D., Tkach, M., and Thery, C. (2016). Proteomic comparison defines novel markers to characterize heterogeneous populations of extracellular vesicle subtypes. Proc. Natl. Acad. Sci. USA 113, E968-E977. [DOI] [PMC free article] [PubMed]
- Krzywinski M., Schein J., Birol I., Connors J., Gascoyne R., Horsman D., Jones S.J., Marra M.A. Circos: an information aesthetic for comparative genomics. Genome Res. 2009;19:1639–1645. doi: 10.1101/gr.092759.109. [DOI] [PMC free article] [PubMed] [Google Scholar]; Krzywinski, M., Schein, J., Birol, I., Connors, J., Gascoyne, R., Horsman, D., Jones, S.J., and Marra, M.A. (2009). Circos: an information aesthetic for comparative genomics. Genome Res. 19, 1639-1645. [DOI] [PMC free article] [PubMed]
- Lachmann A., Torre D., Keenan A.B., Jagodnik K.M., Lee H.J., Wang L., Silverstein M.C., Ma’ayan A. Massive mining of publicly available RNA-seq data from human and mouse. Nat. Commun. 2018;9:1366. doi: 10.1038/s41467-018-03751-6. [DOI] [PMC free article] [PubMed] [Google Scholar]; Lachmann, A., Torre, D., Keenan, A.B., Jagodnik, K.M., Lee, H.J., Wang, L., Silverstein, M.C., and Ma’ayan, A. (2018). Massive mining of publicly available RNA-seq data from human and mouse. Nat. Commun. 9, 1366. [DOI] [PMC free article] [PubMed]
- Lan J., Sun L., Xu F., Liu L., Hu F., Song D., Hou Z., Wu W., Luo X., Wang J. M2 macrophage-derived exosomes promote cell migration and invasion in colon cancer. Cancer Res. 2018;79:146–158. doi: 10.1158/0008-5472.CAN-18-0014. [DOI] [PubMed] [Google Scholar]; Lan, J., Sun, L., Xu, F., Liu, L., Hu, F., Song, D., Hou, Z., Wu, W., Luo, X., Wang, J., et al. (2018). M2 macrophage-derived exosomes promote cell migration and invasion in colon cancer. Cancer Res. 79, 146-158. [DOI] [PubMed]
- Lewis C.E., Harney A.S., Pollard J.W. The Multifaceted Role of Perivascular Macrophages in Tumors. Cancer Cell. 2016;30:18–25. doi: 10.1016/j.ccell.2016.05.017. [DOI] [PMC free article] [PubMed] [Google Scholar]; Lewis, C.E., Harney, A.S., and Pollard, J.W. (2016). The Multifaceted Role of Perivascular Macrophages in Tumors. Cancer Cell 30, 18-25. [DOI] [PMC free article] [PubMed]
- Li H., Lee M.H., Liu K., Wang T., Song M., Han Y., Yao K., Xie H., Zhu F., Grossmann M. Inhibiting breast cancer by targeting the thromboxane A2 pathway. NPJ Precis Oncol. 2017;1:8. doi: 10.1038/s41698-017-0011-4. [DOI] [PMC free article] [PubMed] [Google Scholar]; Li, H., Lee, M.H., Liu, K., Wang, T., Song, M., Han, Y., Yao, K., Xie, H., Zhu, F., Grossmann, M., et al. (2017). Inhibiting breast cancer by targeting the thromboxane A2 pathway. NPJ Precis Oncol 1, 8. [DOI] [PMC free article] [PubMed]
- Liberzon A., Subramanian A., Pinchback R., Thorvaldsdóttir H., Tamayo P., Mesirov J.P. Molecular signatures database (MSigDB) 3.0. Bioinformatics. 2011;27:1739–1740. doi: 10.1093/bioinformatics/btr260. [DOI] [PMC free article] [PubMed] [Google Scholar]; Liberzon, A., Subramanian, A., Pinchback, R., Thorvaldsdottir, H., Tamayo, P., and Mesirov, J.P. (2011). Molecular signatures database (MSigDB) 3.0. Bioinformatics 27, 1739-1740. [DOI] [PMC free article] [PubMed]
- Lin E.Y., Nguyen A.V., Russell R.G., Pollard J.W. Colony-stimulating factor 1 promotes progression of mammary tumors to malignancy. J. Exp. Med. 2001;193:727–740. doi: 10.1084/jem.193.6.727. [DOI] [PMC free article] [PubMed] [Google Scholar]; Lin, E.Y., Nguyen, A.V., Russell, R.G., and Pollard, J.W. (2001). Colony-stimulating factor 1 promotes progression of mammary tumors to malignancy. J. Exp. Med. 193, 727-740. [DOI] [PMC free article] [PubMed]
- Lindenbergh M.F.S., Stoorvogel W. Antigen Presentation by Extracellular Vesicles from Professional Antigen-Presenting Cells. Annu. Rev. Immunol. 2018;36:435–459. doi: 10.1146/annurev-immunol-041015-055700. [DOI] [PubMed] [Google Scholar]; Lindenbergh, M.F.S., and Stoorvogel, W. (2018). Antigen Presentation by Extracellular Vesicles from Professional Antigen-Presenting Cells. Annu. Rev. Immunol. 36, 435-459. [DOI] [PubMed]
- Loyer X., Zlatanova I., Devue C., Yin M., Howangyin K.Y., Klaihmon P., Guerin C.L., Kheloufi M., Vilar J., Zannis K. Intra-Cardiac Release of Extracellular Vesicles Shapes Inflammation Following Myocardial Infarction. Circ. Res. 2018;123:100–106. doi: 10.1161/CIRCRESAHA.117.311326. [DOI] [PMC free article] [PubMed] [Google Scholar]; Loyer, X., Zlatanova, I., Devue, C., Yin, M., Howangyin, K.Y., Klaihmon, P., Guerin, C.L., Kheloufi, M., Vilar, J., Zannis, K., et al. (2018). Intra-Cardiac Release of Extracellular Vesicles Shapes Inflammation Following Myocardial Infarction. Circ. Res. 123, 100-106. [DOI] [PMC free article] [PubMed]
- Lukic A., Ji J., Idborg H., Samuelsson B., Palmberg L., Gabrielsson S., Rådmark O. Pulmonary epithelial cancer cells and their exosomes metabolize myeloid cell-derived leukotriene C4 to leukotriene D4. J. Lipid Res. 2016;57:1659–1669. doi: 10.1194/jlr.M066910. [DOI] [PMC free article] [PubMed] [Google Scholar]; Lukic, A., Ji, J., Idborg, H., Samuelsson, B., Palmberg, L., Gabrielsson, S., and Radmark, O. (2016). Pulmonary epithelial cancer cells and their exosomes metabolize myeloid cell-derived leukotriene C4 to leukotriene D4. J. Lipid Res. 57, 1659-1669. [DOI] [PMC free article] [PubMed]
- Lukic A., Wahlund C.J.E., Gomez C., Brodin D., Samuelsson B., Wheelock C.E., Gabrielsson S., Radmark O. Exosomes and cells from lung cancer pleura exudates transform LTC4 to LTD4, promoting cell migration and survival via CysLT1. Cancer Lett. 2018;444:1–8. doi: 10.1016/j.canlet.2018.11.033. [DOI] [PubMed] [Google Scholar]; Lukic, A., Wahlund, C.J.E., Gomez, C., Brodin, D., Samuelsson, B., Wheelock, C.E., Gabrielsson, S., and Radmark, O. (2018). Exosomes and cells from lung cancer pleura exudates transform LTC4 to LTD4, promoting cell migration and survival via CysLT1. Cancer Lett. 444, 1-8. [DOI] [PubMed]
- Majumdar R., Tavakoli Tameh A., Parent C.A. Exosomes Mediate LTB4 Release during Neutrophil Chemotaxis. PLoS Biol. 2016;14:e1002336. doi: 10.1371/journal.pbio.1002336. [DOI] [PMC free article] [PubMed] [Google Scholar] [Retracted]; Majumdar, R., Tavakoli Tameh, A., and Parent, C.A. (2016). Exosomes Mediate LTB4 Release during Neutrophil Chemotaxis. PLoS Biol. 14, e1002336. [DOI] [PMC free article] [PubMed] [Retracted]
- Mantovani A., Marchesi F., Malesci A., Laghi L., Allavena P. Tumour-associated macrophages as treatment targets in oncology. Nat. Rev. Clin. Oncol. 2017;14:399–416. doi: 10.1038/nrclinonc.2016.217. [DOI] [PMC free article] [PubMed] [Google Scholar]; Mantovani, A., Marchesi, F., Malesci, A., Laghi, L., and Allavena, P. (2017). Tumour-associated macrophages as treatment targets in oncology. Nat. Rev. Clin. Oncol. 14, 399-416. [DOI] [PMC free article] [PubMed]
- Mathieu M., Martin-Jaular L., Lavieu G., Théry C. Specificities of secretion and uptake of exosomes and other extracellular vesicles for cell-to-cell communication. Nat. Cell Biol. 2019;21:9–17. doi: 10.1038/s41556-018-0250-9. [DOI] [PubMed] [Google Scholar]; Mathieu, M., Martin-Jaular, L., Lavieu, G., and Thery, C. (2019). Specificities of secretion and uptake of exosomes and other extracellular vesicles for cell-to-cell communication. Nat. Cell Biol. 21, 9-17. [DOI] [PubMed]
- Mellacheruvu D., Wright Z., Couzens A.L., Lambert J.P., St-Denis N.A., Li T., Miteva Y.V., Hauri S., Sardiu M.E., Low T.Y. The CRAPome: a contaminant repository for affinity purification-mass spectrometry data. Nat. Methods. 2013;10:730–736. doi: 10.1038/nmeth.2557. [DOI] [PMC free article] [PubMed] [Google Scholar]; Mellacheruvu, D., Wright, Z., Couzens, A.L., Lambert, J.P., St-Denis, N.A., Li, T., Miteva, Y.V., Hauri, S., Sardiu, M.E., Low, T.Y., et al. (2013). The CRAPome: a contaminant repository for affinity purification-mass spectrometry data. Nat. Methods 10, 730-736. [DOI] [PMC free article] [PubMed]
- Movahedi K., Laoui D., Gysemans C., Baeten M., Stangé G., Van den Bossche J., Mack M., Pipeleers D., In’t Veld P., De Baetselier P., Van Ginderachter J.A. Different tumor microenvironments contain functionally distinct subsets of macrophages derived from Ly6C(high) monocytes. Cancer Res. 2010;70:5728–5739. doi: 10.1158/0008-5472.CAN-09-4672. [DOI] [PubMed] [Google Scholar]; Movahedi, K., Laoui, D., Gysemans, C., Baeten, M., Stange, G., Van den Bossche, J., Mack, M., Pipeleers, D., In’t Veld, P., De Baetselier, P., and Van Ginderachter, J.A. (2010). Different tumor microenvironments contain functionally distinct subsets of macrophages derived from Ly6C(high) monocytes. Cancer Res. 70, 5728-5739. [DOI] [PubMed]
- Murray P.J., Allen J.E., Biswas S.K., Fisher E.A., Gilroy D.W., Goerdt S., Gordon S., Hamilton J.A., Ivashkiv L.B., Lawrence T. Macrophage activation and polarization: nomenclature and experimental guidelines. Immunity. 2014;41:14–20. doi: 10.1016/j.immuni.2014.06.008. [DOI] [PMC free article] [PubMed] [Google Scholar]; Murray, P.J., Allen, J.E., Biswas, S.K., Fisher, E.A., Gilroy, D.W., Goerdt, S., Gordon, S., Hamilton, J.A., Ivashkiv, L.B., Lawrence, T., et al. (2014). Macrophage activation and polarization: nomenclature and experimental guidelines. Immunity 41, 14-20. [DOI] [PMC free article] [PubMed]
- Muzumdar M.D., Tasic B., Miyamichi K., Li L., Luo L. A global double-fluorescent Cre reporter mouse. Genesis. 2007;45:593–605. doi: 10.1002/dvg.20335. [DOI] [PubMed] [Google Scholar]; Muzumdar, M.D., Tasic, B., Miyamichi, K., Li, L., and Luo, L. (2007). A global double-fluorescent Cre reporter mouse. Genesis 45, 593-605. [DOI] [PubMed]
- Naz S., Gallart-Ayala H., Reinke S.N., Mathon C., Blankley R., Chaleckis R., Wheelock C.E. Development of a Liquid Chromatography-High Resolution Mass Spectrometry Metabolomics Method with High Specificity for Metabolite Identification Using All Ion Fragmentation Acquisition. Anal. Chem. 2017;89:7933–7942. doi: 10.1021/acs.analchem.7b00925. [DOI] [PubMed] [Google Scholar]; Naz, S., Gallart-Ayala, H., Reinke, S.N., Mathon, C., Blankley, R., Chaleckis, R., and Wheelock, C.E. (2017). Development of a Liquid Chromatography-High Resolution Mass Spectrometry Metabolomics Method with High Specificity for Metabolite Identification Using All Ion Fragmentation Acquisition. Anal. Chem. 89, 7933-7942. [DOI] [PubMed]
- Neubert N.J., Schmittnaegel M., Bordry N., Nassiri S., Wald N., Martignier C., Tillé L., Homicsko K., Damsky W., Maby-El Hajjami H. T cell-induced CSF1 promotes melanoma resistance to PD1 blockade. Sci. Transl. Med. 2018;10:eaan3311. doi: 10.1126/scitranslmed.aan3311. [DOI] [PMC free article] [PubMed] [Google Scholar]; Neubert, N.J., Schmittnaegel, M., Bordry, N., Nassiri, S., Wald, N., Martignier, C., Tille, L., Homicsko, K., Damsky, W., Maby-El Hajjami, H., et al. (2018). T cell-induced CSF1 promotes melanoma resistance to PD1 blockade. Sci. Transl. Med. 10, eaan3311. [DOI] [PMC free article] [PubMed]
- Nishikimi A., Kukimoto-Niino M., Yokoyama S., Fukui Y. Immune regulatory functions of DOCK family proteins in health and disease. Exp. Cell Res. 2013;319:2343–2349. doi: 10.1016/j.yexcr.2013.07.024. [DOI] [PubMed] [Google Scholar]; Nishikimi, A., Kukimoto-Niino, M., Yokoyama, S., and Fukui, Y. (2013). Immune regulatory functions of DOCK family proteins in health and disease. Exp. Cell Res. 319, 2343-2349. [DOI] [PubMed]
- Pavlyukov M.S., Yu H., Bastola S., Minata M., Shender V.O., Lee Y., Zhang S., Wang J., Komarova S., Wang J. Apoptotic Cell-Derived Extracellular Vesicles Promote Malignancy of Glioblastoma Via Intercellular Transfer of Splicing Factors. Cancer Cell. 2018;34:119–135.e110. doi: 10.1016/j.ccell.2018.05.012. [DOI] [PMC free article] [PubMed] [Google Scholar]; Pavlyukov, M.S., Yu, H., Bastola, S., Minata, M., Shender, V.O., Lee, Y., Zhang, S., Wang, J., Komarova, S., Wang, J., et al. (2018). Apoptotic Cell-Derived Extracellular Vesicles Promote Malignancy of Glioblastoma Via Intercellular Transfer of Splicing Factors. Cancer Cell 34, 119-135.e110. [DOI] [PMC free article] [PubMed]
- Piechocki M.P., Ho Y.S., Pilon S., Wei W.Z. Human ErbB-2 (Her-2) transgenic mice: a model system for testing Her-2 based vaccines. J. Immunol. 2003;171:5787–5794. doi: 10.4049/jimmunol.171.11.5787. [DOI] [PubMed] [Google Scholar]; Piechocki, M.P., Ho, Y.S., Pilon, S., and Wei, W.Z. (2003). Human ErbB-2 (Her-2) transgenic mice: a model system for testing Her-2 based vaccines. J. Immunol. 171, 5787-5794. [DOI] [PubMed]
- Pixley F.J., Stanley E.R. CSF-1 regulation of the wandering macrophage: complexity in action. Trends Cell Biol. 2004;14:628–638. doi: 10.1016/j.tcb.2004.09.016. [DOI] [PubMed] [Google Scholar]; Pixley, F.J., and Stanley, E.R. (2004). CSF-1 regulation of the wandering macrophage: complexity in action. Trends Cell Biol. 14, 628-638. [DOI] [PubMed]
- Pong W.W., Walker J., Wylie T., Magrini V., Luo J., Emnett R.J., Choi J., Cooper M.L., Griffith M., Griffith O.L. F11R is a novel monocyte prognostic biomarker for malignant glioma. PLoS One. 2013;8:e77571. doi: 10.1371/journal.pone.0077571. [DOI] [PMC free article] [PubMed] [Google Scholar]; Pong, W.W., Walker, J., Wylie, T., Magrini, V., Luo, J., Emnett, R.J., Choi, J., Cooper, M.L., Griffith, M., Griffith, O.L., et al. (2013). F11R is a novel monocyte prognostic biomarker for malignant glioma. PLoS One 8, e77571. [DOI] [PMC free article] [PubMed]
- Pucci F., Venneri M.A., Biziato D., Nonis A., Moi D., Sica A., Di Serio C., Naldini L., De Palma M. A distinguishing gene signature shared by tumor-infiltrating Tie2-expressing monocytes, blood “resident” monocytes, and embryonic macrophages suggests common functions and developmental relationships. Blood. 2009;114:901–914. doi: 10.1182/blood-2009-01-200931. [DOI] [PubMed] [Google Scholar]; Pucci, F., Venneri, M.A., Biziato, D., Nonis, A., Moi, D., Sica, A., Di Serio, C., Naldini, L., and De Palma, M. (2009). A distinguishing gene signature shared by tumor-infiltrating Tie2-expressing monocytes, blood “resident” monocytes, and embryonic macrophages suggests common functions and developmental relationships. Blood 114, 901-914. [DOI] [PubMed]
- Quail D.F., Joyce J.A. Molecular Pathways: Deciphering Mechanisms of Resistance to Macrophage-Targeted Therapies. Clin. Cancer Res. 2017;23:876–884. doi: 10.1158/1078-0432.CCR-16-0133. [DOI] [PMC free article] [PubMed] [Google Scholar]; Quail, D.F., and Joyce, J.A. (2017). Molecular Pathways: Deciphering Mechanisms of Resistance to Macrophage-Targeted Therapies. Clin. Cancer Res. 23, 876-884. [DOI] [PMC free article] [PubMed]
- Ries C.H., Cannarile M.A., Hoves S., Benz J., Wartha K., Runza V., Rey-Giraud F., Pradel L.P., Feuerhake F., Klaman I. Targeting tumor-associated macrophages with anti-CSF-1R antibody reveals a strategy for cancer therapy. Cancer Cell. 2014;25:846–859. doi: 10.1016/j.ccr.2014.05.016. [DOI] [PubMed] [Google Scholar]; Ries, C.H., Cannarile, M.A., Hoves, S., Benz, J., Wartha, K., Runza, V., Rey-Giraud, F., Pradel, L.P., Feuerhake, F., Klaman, I., et al. (2014). Targeting tumor-associated macrophages with anti-CSF-1R antibody reveals a strategy for cancer therapy. Cancer Cell 25, 846-859. [DOI] [PubMed]
- Robinson M.D., McCarthy D.J., Smyth G.K. edgeR: a Bioconductor package for differential expression analysis of digital gene expression data. Bioinformatics. 2010;26:139–140. doi: 10.1093/bioinformatics/btp616. [DOI] [PMC free article] [PubMed] [Google Scholar]; Robinson, M.D., McCarthy, D.J., and Smyth, G.K. (2010). edgeR: a Bioconductor package for differential expression analysis of digital gene expression data. Bioinformatics 26, 139-140. [DOI] [PMC free article] [PubMed]
- Rowland A.A., Chitwood P.J., Phillips M.J., Voeltz G.K. ER contact sites define the position and timing of endosome fission. Cell. 2014;159:1027–1041. doi: 10.1016/j.cell.2014.10.023. [DOI] [PMC free article] [PubMed] [Google Scholar]; Rowland, A.A., Chitwood, P.J., Phillips, M.J., and Voeltz, G.K. (2014). ER contact sites define the position and timing of endosome fission. Cell 159, 1027-1041. [DOI] [PMC free article] [PubMed]
- Ruffell B., Coussens L.M. Macrophages and therapeutic resistance in cancer. Cancer Cell. 2015;27:462–472. doi: 10.1016/j.ccell.2015.02.015. [DOI] [PMC free article] [PubMed] [Google Scholar]; Ruffell, B., and Coussens, L.M. (2015). Macrophages and therapeutic resistance in cancer. Cancer Cell 27, 462-472. [DOI] [PMC free article] [PubMed]
- Ruivo C.F., Adem B., Silva M., Melo S.A. The Biology of Cancer Exosomes: Insights and New Perspectives. Cancer Res. 2017;77:6480–6488. doi: 10.1158/0008-5472.CAN-17-0994. [DOI] [PubMed] [Google Scholar]; Ruivo, C.F., Adem, B., Silva, M., and Melo, S.A. (2017). The Biology of Cancer Exosomes: Insights and New Perspectives. Cancer Res. 77, 6480-6488. [DOI] [PubMed]
- Sagini K., Costanzi E., Emiliani C., Buratta S., Urbanelli L. Extracellular Vesicles as Conveyors of Membrane-Derived Bioactive Lipids in Immune System. Int. J. Mol. Sci. 2018;19:E1227. doi: 10.3390/ijms19041227. [DOI] [PMC free article] [PubMed] [Google Scholar]; Sagini, K., Costanzi, E., Emiliani, C., Buratta, S., and Urbanelli, L. (2018). Extracellular Vesicles as Conveyors of Membrane-Derived Bioactive Lipids in Immune System. Int. J. Mol. Sci. 19, E1227. [DOI] [PMC free article] [PubMed]
- Sergushichev A. An algorithm for fast preranked gene set enrichment analysis using cumulative statistic calculation. bioRxiv. 2016 [Google Scholar]; Sergushichev, A. (2016). An algorithm for fast preranked gene set enrichment analysis using cumulative statistic calculation. bioRxiv, doi: 10.1101/060012.
- Squadrito M.L., Pucci F., Magri L., Moi D., Gilfillan G.D., Ranghetti A., Casazza A., Mazzone M., Lyle R., Naldini L., De Palma M. miR-511-3p modulates genetic programs of tumor-associated macrophages. Cell Rep. 2012;1:141–154. doi: 10.1016/j.celrep.2011.12.005. [DOI] [PubMed] [Google Scholar]; Squadrito, M.L., Pucci, F., Magri, L., Moi, D., Gilfillan, G.D., Ranghetti, A., Casazza, A., Mazzone, M., Lyle, R., Naldini, L., and De Palma, M. (2012). miR-511-3p modulates genetic programs of tumor-associated macrophages. Cell Rep. 1, 141-154. [DOI] [PubMed]
- Squadrito M.L., Baer C., Burdet F., Maderna C., Gilfillan G.D., Lyle R., Ibberson M., De Palma M. Endogenous RNAs modulate microRNA sorting to exosomes and transfer to acceptor cells. Cell Rep. 2014;8:1432–1446. doi: 10.1016/j.celrep.2014.07.035. [DOI] [PubMed] [Google Scholar]; Squadrito, M.L., Baer, C., Burdet, F., Maderna, C., Gilfillan, G.D., Lyle, R., Ibberson, M., and De Palma, M. (2014). Endogenous RNAs modulate microRNA sorting to exosomes and transfer to acceptor cells. Cell Rep. 8, 1432-1446. [DOI] [PubMed]
- Squadrito M.L., Cianciaruso C., Hansen S.K., De Palma M. EVIR: chimeric receptors that enhance dendritic cell cross-dressing with tumor antigens. Nat. Methods. 2018;15:183–186. doi: 10.1038/nmeth.4579. [DOI] [PMC free article] [PubMed] [Google Scholar]; Squadrito, M.L., Cianciaruso, C., Hansen, S.K., and De Palma, M. (2018). EVIR: chimeric receptors that enhance dendritic cell cross-dressing with tumor antigens. Nat. Methods 15, 183-186. [DOI] [PMC free article] [PubMed]
- Steenbeek S.C., Pham T.V., de Ligt J., Zomer A., Knol J.C., Piersma S.R., Schelfhorst T., Huisjes R., Schiffelers R.M., Cuppen E. Cancer cells copy migratory behavior and exchange signaling networks via extracellular vesicles. EMBO J. 2018;37:e98357. doi: 10.15252/embj.201798357. [DOI] [PMC free article] [PubMed] [Google Scholar]; Steenbeek, S.C., Pham, T.V., de Ligt, J., Zomer, A., Knol, J.C., Piersma, S.R., Schelfhorst, T., Huisjes, R., Schiffelers, R.M., Cuppen, E., et al. (2018). Cancer cells copy migratory behavior and exchange signaling networks via extracellular vesicles. EMBO J. 37, e98357. [DOI] [PMC free article] [PubMed]
- Stevenson C., de la Rosa G., Anderson C.S., Murphy P.S., Capece T., Kim M., Elliott M.R. Essential role of Elmo1 in Dock2-dependent lymphocyte migration. J. Immunol. 2014;192:6062–6070. doi: 10.4049/jimmunol.1303348. [DOI] [PMC free article] [PubMed] [Google Scholar]; Stevenson, C., de la Rosa, G., Anderson, C.S., Murphy, P.S., Capece, T., Kim, M., and Elliott, M.R. (2014). Essential role of Elmo1 in Dock2-dependent lymphocyte migration. J. Immunol. 192, 6062-6070. [DOI] [PMC free article] [PubMed]
- Subra C., Grand D., Laulagnier K., Stella A., Lambeau G., Paillasse M., De Medina P., Monsarrat B., Perret B., Silvente-Poirot S. Exosomes account for vesicle-mediated transcellular transport of activatable phospholipases and prostaglandins. J. Lipid Res. 2010;51:2105–2120. doi: 10.1194/jlr.M003657. [DOI] [PMC free article] [PubMed] [Google Scholar]; Subra, C., Grand, D., Laulagnier, K., Stella, A., Lambeau, G., Paillasse, M., De Medina, P., Monsarrat, B., Perret, B., Silvente-Poirot, S., et al. (2010). Exosomes account for vesicle-mediated transcellular transport of activatable phospholipases and prostaglandins. J. Lipid Res. 51, 2105-2120. [DOI] [PMC free article] [PubMed]
- Subramanian A., Tamayo P., Mootha V.K., Mukherjee S., Ebert B.L., Gillette M.A., Paulovich A., Pomeroy S.L., Golub T.R., Lander E.S., Mesirov J.P. Gene set enrichment analysis: a knowledge-based approach for interpreting genome-wide expression profiles. Proc. Natl. Acad. Sci. USA. 2005;102:15545–15550. doi: 10.1073/pnas.0506580102. [DOI] [PMC free article] [PubMed] [Google Scholar]; Subramanian, A., Tamayo, P., Mootha, V.K., Mukherjee, S., Ebert, B.L., Gillette, M.A., Paulovich, A., Pomeroy, S.L., Golub, T.R., Lander, E.S., and Mesirov, J.P. (2005). Gene set enrichment analysis: a knowledge-based approach for interpreting genome-wide expression profiles. Proc. Natl. Acad. Sci. USA 102, 15545-15550. [DOI] [PMC free article] [PubMed]
- Szklarczyk D., Morris J.H., Cook H., Kuhn M., Wyder S., Simonovic M., Santos A., Doncheva N.T., Roth A., Bork P. The STRING database in 2017: quality-controlled protein-protein association networks, made broadly accessible. Nucleic Acids Res. 2017;45:D362–D368. doi: 10.1093/nar/gkw937. [DOI] [PMC free article] [PubMed] [Google Scholar]; Szklarczyk, D., Morris, J.H., Cook, H., Kuhn, M., Wyder, S., Simonovic, M., Santos, A., Doncheva, N.T., Roth, A., Bork, P., et al. (2017). The STRING database in 2017: quality-controlled protein-protein association networks, made broadly accessible. Nucleic Acids Res. 45, D362-D368. [DOI] [PMC free article] [PubMed]
- Thery C., Amigorena S., Raposo G., Clayton A. Isolation and characterization of exosomes from cell culture supernatants and biological fluids. Curr. Protoc. Cell Biol. 2006;Chapter 3 doi: 10.1002/0471143030.cb0322s30. Unit 3.22. [DOI] [PubMed] [Google Scholar]; Thery, C., Amigorena, S., Raposo, G., and Clayton, A. (2006). Isolation and characterization of exosomes from cell culture supernatants and biological fluids. Curr. Protoc. Cell Biol. Chapter 3, Unit 3.22. [DOI] [PubMed]
- van Niel G., D’Angelo G., Raposo G. Shedding light on the cell biology of extracellular vesicles. Nat. Rev. Mol. Cell Biol. 2018;19:213–228. doi: 10.1038/nrm.2017.125. [DOI] [PubMed] [Google Scholar]; van Niel, G., D’Angelo, G., and Raposo, G. (2018). Shedding light on the cell biology of extracellular vesicles. Nat. Rev. Mol. Cell Biol. 19, 213-228. [DOI] [PubMed]
- Vandenbon A., Dinh V.H., Mikami N., Kitagawa Y., Teraguchi S., Ohkura N., Sakaguchi S. Immuno-Navigator, a batch-corrected coexpression database, reveals cell type-specific gene networks in the immune system. Proc. Natl. Acad. Sci. USA. 2016;113:E2393–E2402. doi: 10.1073/pnas.1604351113. [DOI] [PMC free article] [PubMed] [Google Scholar]; Vandenbon, A., Dinh, V.H., Mikami, N., Kitagawa, Y., Teraguchi, S., Ohkura, N., and Sakaguchi, S. (2016). Immuno-Navigator, a batch-corrected coexpression database, reveals cell type-specific gene networks in the immune system. Proc. Natl. Acad. Sci. USA 113, E2393-E2402. [DOI] [PMC free article] [PubMed]
- Veerman R.E., Güçlüler Akpinar G., Eldh M., Gabrielsson S. Immune Cell-Derived Extracellular Vesicles - Functions and Therapeutic Applications. Trends Mol. Med. 2019;25:382–394. doi: 10.1016/j.molmed.2019.02.003. [DOI] [PubMed] [Google Scholar]; Veerman, R.E., Guçluler Akpinar, G., Eldh, M., and Gabrielsson, S. (2019). Immune Cell-Derived Extracellular Vesicles - Functions and Therapeutic Applications. Trends Mol. Med. 25, 382-394. [DOI] [PubMed]
- Vella L.J., Scicluna B.J., Cheng L., Bawden E.G., Masters C.L., Ang C.S., Willamson N., McLean C., Barnham K.J., Hill A.F. A rigorous method to enrich for exosomes from brain tissue. J. Extracell. Vesicles. 2017;6:1348885. doi: 10.1080/20013078.2017.1348885. [DOI] [PMC free article] [PubMed] [Google Scholar]; Vella, L.J., Scicluna, B.J., Cheng, L., Bawden, E.G., Masters, C.L., Ang, C.S., Willamson, N., McLean, C., Barnham, K.J., and Hill, A.F. (2017). A rigorous method to enrich for exosomes from brain tissue. J. Extracell. Vesicles 6, 1348885. [DOI] [PMC free article] [PubMed]
- Vences-Catalán F., Rajapaksa R., Srivastava M.K., Marabelle A., Kuo C.C., Levy R., Levy S. Tetraspanin CD81 promotes tumor growth and metastasis by modulating the functions of T regulatory and myeloid-derived suppressor cells. Cancer Res. 2015;75:4517–4526. doi: 10.1158/0008-5472.CAN-15-1021. [DOI] [PubMed] [Google Scholar]; Vences-Catalan, F., Rajapaksa, R., Srivastava, M.K., Marabelle, A., Kuo, C.C., Levy, R., and Levy, S. (2015). Tetraspanin CD81 promotes tumor growth and metastasis by modulating the functions of T regulatory and myeloid-derived suppressor cells. Cancer Res. 75, 4517-4526. [DOI] [PubMed]
- Wang D., Dubois R.N. Eicosanoids and cancer. Nat. Rev. Cancer. 2010;10:181–193. doi: 10.1038/nrc2809. [DOI] [PMC free article] [PubMed] [Google Scholar]; Wang, D., and Dubois, R.N. (2010). Eicosanoids and cancer. Nat. Rev. Cancer 10, 181-193. [DOI] [PMC free article] [PubMed]
- Zhang F., Li R., Yang Y., Shi C., Shen Y., Lu C., Chen Y., Zhou W., Lin A., Yu L. Specific Decrease in B-Cell-Derived Extracellular Vesicles Enhances Post-Chemotherapeutic CD8(+) T Cell Responses. Immunity. 2019;50:738–750.e737. doi: 10.1016/j.immuni.2019.01.010. [DOI] [PubMed] [Google Scholar]; Zhang, F., Li, R., Yang, Y., Shi, C., Shen, Y., Lu, C., Chen, Y., Zhou, W., Lin, A., Yu, L., et al. (2019). Specific Decrease in B-Cell-Derived Extracellular Vesicles Enhances Post-Chemotherapeutic CD8(+) T Cell Responses. Immunity 50, 738-750.e737. [DOI] [PubMed]
- Zhou J., Li X., Wu X., Zhang T., Zhu Q., Wang X., Wang H., Wang K., Lin Y., Wang X. Exosomes Released from Tumor-Associated Macrophages Transfer miRNAs That Induce a Treg/Th17 Cell Imbalance in Epithelial Ovarian Cancer. Cancer Immunol. Res. 2018;6:1578–1592. doi: 10.1158/2326-6066.CIR-17-0479. [DOI] [PubMed] [Google Scholar]; Zhou, J., Li, X., Wu, X., Zhang, T., Zhu, Q., Wang, X., Wang, H., Wang, K., Lin, Y., and Wang, X. (2018). Exosomes Released from Tumor-Associated Macrophages Transfer miRNAs That Induce a Treg/Th17 Cell Imbalance in Epithelial Ovarian Cancer. Cancer Immunol. Res. 6, 1578-1592. [DOI] [PubMed]
- Zhu Y., Chen X., Pan Q., Wang Y., Su S., Jiang C., Li Y., Xu N., Wu L., Lou X., Liu S. A Comprehensive Proteomics Analysis Reveals a Secretory Path- and Status-Dependent Signature of Exosomes Released from Tumor-Associated Macrophages. J. Proteome Res. 2015;14:4319–4331. doi: 10.1021/acs.jproteome.5b00770. [DOI] [PubMed] [Google Scholar]; Zhu, Y., Chen, X., Pan, Q., Wang, Y., Su, S., Jiang, C., Li, Y., Xu, N., Wu, L., Lou, X., and Liu, S. (2015). A Comprehensive Proteomics Analysis Reveals a Secretory Path- and Status-Dependent Signature of Exosomes Released from Tumor-Associated Macrophages. J. Proteome Res. 14, 4319-4331. [DOI] [PubMed]
Associated Data
This section collects any data citations, data availability statements, or supplementary materials included in this article.
Supplementary Materials
Data Availability Statement
We have submitted all relevant EV data to the EV-TRACK knowledgebase (EV-TRACK Consortium et al., 2017), available with EV-TRACK ID: EV190011. Uncropped western blots are available as Mendeley Dataset with https://doi.org/10.17632/zj43mmthr8.1. Processed proteomic data are shown in Tables S1, S2, S3, S4, S5, S6, and S7. Proteomic raw data are available from the Lead Contact upon request.