

Abstract
Post-harvest hydrothermal processing of grains are targeted at improving milling performances and nutritional properties. In this study, the effects of two hydrothermal processes, namely steam parboiling and soaking in boiling water for different durations on properties of buckwheat (Fagopyrum esculentum L.) grown in the Indian Himalayan regions were assessed. Both treatments significantly improved milling yield. Changes in grain section morphology were evidenced under scanning electron microscope. Milder processing for 5 and 10 min mostly exerted annealing effect, represented by increased intensities of X-ray diffraction peaks. Starch gelatinization occurred upon prolonged processing for 15 and 20 min. This resulted in decreased crystallinity, increased sedimentation volume, paste thinning during rapid viscosity analysis and lower thermal transition in differential scanning calorimetry. Marginal changes in oil uptake suggested limited protein denaturation. Natural antioxidant compounds were variably denatured. Maillard browning was indicated by CIE L* a* b* colour and antioxidant levels. The starchy flour samples showed partial resistance to enzymatic amylolysis post retrogradation. Soaking in boiling water can be considered as a feasible alternative to conventional steam parboiling for better milling yield of buckwheat. Altered physicochemical and nutritional properties of buckwheat suggested that the hydrothermally modified flours can be used in ready to eat therapeutic food products.
Keywords: Buckwheat, Scanning, Crystallinity, Digestibility, Hydrothermal, Soaking
Introduction
Buckwheat (Fagopyrum esculentum L.) flour has attained much attention subjected to its dough forming properties and potential utility in gluten-free products. The Indian Himalayan state of Sikkim is known for organic buckwheat cultivation. Traditional milling of buckwheat involves mechanical removal (dehusking) of the brown seed coat to obtain a pale yellow groat. Buckwheat groats often fracture and break during dehusking due to its soft texture, contributing to significant process loss and handling difficulties. The obtained whole groats are ground to obtain buckwheat flour.
Physicochemical and cooking properties of grain flours are mostly governed by the molecular status of starch, which forms the major portion of their constituents. About 70% (db) of the buckwheat grain is made up of starch (Christa and Soral-Smietana 2008). The starch macromolecule is composed of d-glucose units linked together, forming glycosidic chains. The linear chains with α-1,4 linkages are called amylose while branched clusters with additional α-1,6 branch points are called amylopectin. While the branched regions of amylopectin contribute to the crystallinity of starch, linear chains of both amylose and amylopectin are considered responsible for its amorphousness (O’Sullivan and Perez 1999).
Parboiling, a popular paddy processing technique involving moistening of paddy by soaking in water, followed by steaming and drying. Steaming causes gelatinization of starch. The gel-like starch fills up the natural fissures in the rice kernels responsible for grain breakage during milling (Wang and Copeland 2013). Drying hardens the gelatinized rice kernels, resulting in higher head rice yield than raw rice (Bhattacharya 2011). Drying and subsequent storage also involves a molecular phenomenon called retrogradation, which is partially opposite to gelatinization. Gelatinization involves disruption of the native starch crystallites with entrapment of excess water molecules by the glycosidic chains. Retrogradation causes reformation of starch crystallites, partially releasing the entrapped water molecules. Physicochemical, functional and nutritional properties are significantly altered after parboiling due to the altered status of starch in the grains (Bhattacharya 2011). In a recent study, Pal et al. (2018) reported on the effect of parboiling on protein and phenolic compounds in different paddy varieties and also discussed the changes in the paste viscosity parameters when subjected to thermal cycles. Parboiling of buckwheat reportedly resulted in decreased protein, increased crude fibre, lipid and ash (Pandey et al. 2015). However, our review of available literature did not find any study on the characteristics of starch in parboiled buckwheat effecting the physical and physicochemical properties of the flour. State of starch digestibility has also never been reported.
Considering the necessity to reduce economic and time investments, several modifications to traditional parboiling techniques have been developed (Sarangapani et al. 2016; Rockembach et al. 2019). Simpler and effective hydrothermal processes are being designed. High temperature necessary for steaming is difficult to be maintained in the buckwheat growing cold Himalayan regions. In the present study, hydrothermal processing of buckwheat was carried out by both conventional steam parboiling as well as soaking the grains in boiling water for different intervals ranging from 5 to 10 min. The effect on milling yield was compared and alterations in physical, physicochemical and nutritional properties were studied.
Materials and methods
Materials
Organic buckwheat grown in Sikkim was purchased from Giskaa (Nature’s gift brand). The samples were received in commercially sealed polypropylene pouches and stored at 4 °C until processing. Chemicals were purchased from Merck (Germany) and Sigma-Aldrich (USA) and glassware were purchased from Tarson (USA). Double distilled water was used in all the processes and experiments.
Processing and coding of samples
Before processing, buckwheat grains was brought to room temperature (22–25 °C) and kept for 4 h. For steam parboiling, a 400 g grain sample was first soaked in 2 L water (20 ± 2 °C) and kept for 60 h till maximum moisture uptake (41.6%, wb). Excess water was decanted and the grains were immediately steamed at 121 °C (15 psig) for 5, 10, 15 and 20 min in a steaming unit of 1000 mL grain holding capacity. The steamed grains were then dried in a counter current tray drier at 35 °C till 12–13% moisture content (wb) was attained. For hot soaking, 400 g buckwheat grains at room temperature was soaked in 2 L boiling water for 5, 10, 15 and 20 min. The temperature of the water came down to 86–88 °C within 20 s of soaking and regained the boiling temperature in 90 s. The hot soaked grains were then dried and dehusked as was done for the steam parboiled samples. Dehusking of the raw and processed grains was carried out using a frictional mill (Saral, India). The gap between the abrasive stones of the mill was suitably adjusted as per the grain sizes for minimum breakage and sufficient dehusking. Milling yield was measured as the percentage weight of intact whole groats obtained after dehusking. A portion of each dehusked sample was pulverized in a mixer grinder (Philips, India) for 20 s and sieved through standard sieves to obtain flour particle sizes ranging from 106 to 180 microns with 11–12% final moisture content (wb). Both groat and flour samples were stored in separate polypropylene pouches at 4 °C for further analyses.
Raw sample was coded as R. Samples soaked in boiling water were prefixed with B followed by the time (minute) of soaking. Steam parboiled samples were prefixed with S followed by steaming time in minutes.
H/B ratio
Parboiling reportedly changes dimensions of husked grains (Patindol et al. 2008). Such dimensional changes result in alteration of important properties relating to packability of food grains. Each of the three edges of the raw and processed unhusked grains were measured using a Seed dial calliper (Baker, India) to take the average breadth (B). The height (H) was similarly measured and the ratio (H/B) were calculated.
Colour
The CIE L* a* b* colour values of all buckwheat flour samples were analyzed using a Colour Measurement Spectrophotometer (Hunter Color-Lab, Ultrascan Vis, USA) with pure air as reference.
Hardness
Unhusked buckwheat grains were measured for hardness (H) using a Texture Analyzer (TA.HD.plus, Stable Micro Systems, UK) fitted with a 25 kg load cell. Each grain was compressed with a 2 cm diameter stainless steel probe along its height at a speed of 0.5 mm/min, after which the probe was returned to its original position. The maximum force to completely crush the grain was taken as the hardness.
Morphology of groats
Longitudinal section (LS) of groat sample was prepared using a sharp blade, vacuum dried and sputter coated with gold before observing under a scanning electron microscope (SEM, JEOL 6993 V, USA) operating at an acceleration voltage of 15 kV. Magnifications of 30 × and 2000 × were used.
Sediment volume and solubility in water
Sediment volume (SV) is a physical qualitative measure of pregelatinized starch in any flour system (Bhattacharya 2011). A suspension of the flour sample was prepared at room temperature using 1 g flour (db) in 10 mL of 0.1 N hydrochloric acid in a stoppered graduated test tube and stirred vigorously after every 60 s till 1 h. The suspension was left to rest for another 2 h and the level of the sediment was measured as SV value. The slurry was centrifuged at 8000 g for 10 min (Hettich Zentrifugen, EBA 21, Germany). The supernatant was dried at 35 °C till constant weight. The percentage of dried weight of soluble matter to the original dried sample was reported as water solubility index (WSI, % db).
Oil absorption capacity
Oil absorption capacity (OAC) of a flour is important for its processability. Briefly, 1 g (db) of flour sample was mixed with 10 mL soybean oil (Fortune, India, Specific Gravity = 0.91) and allowed to stand at room temperature for 1 h. This was followed by centrifugation at 8000 g for 30 min and weighing the residue. The OAC was measured as the percent of oil bound to each gram of the flour.
Pasting properties
A rapid viscosity analyzer (RVA Starchmaster2, Newport Scientific Instruments, Australia) was used to evaluate and analyze the pasting profiles of the buckwheat flour suspensions (10% w/w, 28 g total weight). The samples were held at 50 °C for 1 min, heated from 50 °C to 95 °C at 12.16 °C/mine, held at 95 °C for 2.30 min, cooled from 95 °C to 50 °C at 11.84 °C/min, and held at 50 °C for 2 min. The peak viscosity (PV = Maximum viscosity during heating), hot paste viscosity (HPV = minimum viscosity at 95 °C), cold paste viscosity (CPV = final viscosity at 50 °C), breakdown (BD = PV − HPV) and setback (SB = CPV − HPV) were recorded. The paste was stored at for measuring the gel strength.
Gel strength
Gel obtained from RVA was stored at 4 °C for 4 h and measured for its hardness using a texture analyzer (Stable Micro Systems, TA. HD. plus, UK). The gel was compressed up to 10 mm at 1 mm/s with a bakelite cylindrical probe of 5 mm diameter and a 5 kg load cell. The maximum force required to fracture the gel was recorded as gel strength.
X-ray diffraction
Wide angle X-ray diffractograms (XRD) of dry flour samples were obtained with an X-ray diffractometer (Rigaku Miniflex, Japan, k = 1.54040, potential = 30 kV, current = 15 mA, copper target). A scanning range of 3–50º of 2θ values and a scan speed of 5º 2θ/min were employed. The crystalline patterns were analyzed using Origin 8.1 software (OriginLab, USA). The percentage crystallinity was determined using the following formula.
Differential scanning calorimetry
A Differential Scanning Calorimeter (DSC-60, Shimadzu, Japan), periodically calibrated with pure indium for heat flow and temperature was used to measure thermal properties of the samples. For this, 3 mg flour samples of raw and processed buckwheat were separately weighed in Aluminium DSC pans. To this, 3μL deionised water was added and left to saturate at 4 °C for 8 h. The pans were hermetically sealed and heated from 30 to 150 °C at a heating rate of 5 °C/min under N2 atmosphere. An empty pan served as the reference. The major peaks obtained in the thermograms were analyzed for onset (To), peak (Tp), conclusion (Tc) temperatures and the enthalpy (ΔH, in J/g).
Bioactive properties
Raw and processed buckwheat flour (5 mg) were extracted twice with hexane (1:10, w/v) and twice with a mixture of acetone, water and acetic acid (70:29.5:0.5, v/v/v) for 15 min each. The crude extracts were concentrated by evaporating, dissolved in methanol to a concentration of 1.0 mg/mL and kept at − 20 °C till analyses for total phenolic content (TPC), total flavonoid content (TFC) and ferric reducing antioxidant potential (FRAP) (Dutta et al. 2014).
Starch digestibility
The in vitro starch hydrolysis rate of starch in the flour samples were determined by a method modified from Goñi et al. (1996). Briefly, 50 mg flour was deproteinized using 0.2 mL of a solution containing 1 g Pepsin in 10 mL of HCI-KCI buffer (pH 1.5) at 40 °C for 1 h. The volume was then made up to 25 mL with Tris-maleate buffer (pH 6.9). Five milliliters of a solution of Tris-maleate buffer containing 2.6 IU pancreatic α-amylase was then added to it and incubated at 37 °C for 180 min. An aliquot of 5 mL was boiled to inactivate the enzyme. Three milliliters of 0.4 M sodium acetate buffer (pH 4.75) containing 60 μL of amyloglucosidase was then added and incubated at 60 °C for 45 min. The glucose liberated was estimated by 3,5-dinitrosalicylic acid method (AOAC 2012) and the amount of digested starch was calculated using the formula
Statistical analysis
All experiments were carried out with multiple sample replicates and mean results were reported. Pearson correlation between data patterns and tests of significant differences between the means by Duncan’s multiple range tests were carried out at a significance level of 95% using SPSS 11.5 software (SPSS Inc., USA).
Results and discussion
H/B ratio
The three faces of a groat were of equal dimensions. Values of H/B in raw and processed buckwheat groats are given in Table 1. The average thickness of buckwheat husk was 0.506 mm. Hydrothermal processing caused changes in H/B ratio of buckwheat, although the time of treatment had limited influence on the values. Minor increase in B and decrease in H was observed post processing. Hydrothermal processing causes displacement of gelatinized starchy material within husk causing spatial deformation (Dutta and Mahanta 2014).
Table 1.
Physical properties of raw and processed buckwheat samples
| H/B ratio | Colour values | Hardness and milling yield | ||||||
|---|---|---|---|---|---|---|---|---|
| Grain breadth (B, mm) | Grain height (H, mm) | H/B | L* | a* | b* | Hardness (H, kg) | Milling yield (MY, %) | |
| R | 3.01 ± 0.13a | 4.09 ± 0.12c | 1.35 ± 0.16b | 87.79 ± 2.31f | − 11.47 ± 0.63a | 13.47 ± 0.64a | 23.91 ± 1.16a | 46.46 ± 2.34a |
| B5 | 3.05 ± 0.05b | 4.05 ± 0.07bc | 1.32 ± 0.18ab | 84.94 ± 3.23e | − 8.63 ± 0.76b | 15.55 ± 0.77b | 38.66 ± 1.12bc | 54.13 ± 3.13b |
| B10 | 3.06 ± 0.12b | 4.05 ± 0.15bc | 1.32 ± 0.11ab | 82.65 ± 1.89d | − 3.10 ± 0.18d | 16.59 ± 0.39c | 40.08 ± 1.89c | 67.19 ± 1.57 cd |
| B15 | 3.17 ± 0.24c | 4.05 ± 0.14bc | 1.27 ± 0.08a | 75.11 ± 2.18c | − 2.10 ± 0.94de | 17.17 ± 0.43d | 47.15 ± 2.14d | 69.96 ± 2.11de |
| B20 | 3.19 ± 0.19c | 4.07 ± 0.12c | 1.27 ± 0.14a | 67.10 ± 3.14a | − 1.15 ± 0.56e | 18.23 ± 0.51e | 51.06 ± 1.42e | 73.34 ± 3.45ef |
| S5 | 3.12 ± 0.15bc | 4.03 ± 0.07a | 1.29 ± 0.16ab | 81.07 ± 3.08d | − 6.25 ± 0.48c | 14.66 ± 0.48b | 36.46 ± 1.28b | 66.25 ± 1.64 cd |
| S10 | 3.17 ± 0.15c | 4.04 ± 0.16a | 1.27 ± 0.08a | 76.35 ± 1.87c | − 5.58 ± 0.19c | 16.56 ± 0.06c | 41.30 ± 1.19c | 66.89 ± 1.65 cd |
| S15 | 3.27 ± 0.12d | 4.08 ± 0.13c | 1.24 ± 0.05a | 70.61 ± 2.98b | − 1.30 ± 0.27e | 17.28 ± 0.21d | 59.80 ± 1.28f | 71.47 ± 2.42de |
| S20 | 3.27 ± 0.16d | 4.08 ± 0.21c | 1.24 ± 0.19a | 66.80 ± 2.54a | 1.83 ± 0.59e | 18.43 ± 0.13e | 63.60 ± 1.90 g | 74.39 ± 3.16f |
Means superscripted by the same letter in a column do not differ significantly from one another (P > 0.05)
Colour
The colour values are reported in Table 1. Gelatinization resulted in change of starch colour from dirty white to translucent white, thereby reducing the L* value. Buckwheat husk is highly pigmented and rich in flavons and phenols (Christa and Soral-Smietana 2008). Visible loss in husk color after both processing treatments, indicated their inward penetration as well as outward leaching. The increased a* and b* values indicated change in colour towards red and yellow respectively, finally resulting in a pale amber colour in the processed flours (Pathare et al. 2013; Pal et al. 2018). Lamberts et al. (2006) suggested Maillard browning to be partially responsible for changed colour of parboiled rice. However, in case of hot soaking involving process temperature of 100 °C and below, the reaction between sugars and proteins was nullified.
Hardness and milling yield
Hardness value of buckwheat grains notably increased after both hydrothermal processing treatments. Hydrothermal processing causes swelling and gelatinization of starch granules, which fills the weak lines of fracture along the grain endosperm, making it more rigid and less susceptible to milling damages. This resulted in improved milling yields (Table 1). Severe hot soaking as well as severe steaming resulted in almost equal milling yields indicating that the hot soaking treatment can be used as a novel and efficient post-harvest buckwheat processing technique to increase milling yield.
Morphology
The SEM pictures of the LS of raw and processed buckwheat groats are given in Fig. 1. The raw buckwheat groat is a dicotyledonous seed with a distinct looped testa extending from one corner of the seed to another. Hydrothermal processing caused dislocation of the starchy groat material, thereby changing the groat morphology. The orientation of the testa also changed in the processed samples. The round and polygonal-shaped starch granules with sizes ranging from 5µ to 10µ exhibited progressive swelling, gelatinization and complete degeneration of the native structure on moderate and severe processing treatments as exhibited by B15, B20 and S10, S15 and S20 samples. Moderate and severe steaming for 15 and 20 min caused higher granule damage than hot soaking. The morphological images suggested improvement in overall structural integrity of the processed buckwheat groats. Formation of minor fractures in B10, B15, B20, S15 and S20 were attributed to abrasion and compression during milling or drastic temperature gradient experienced by the grains during the high temperature processes (Himmelsbach et al. 2008).
Fig. 1.
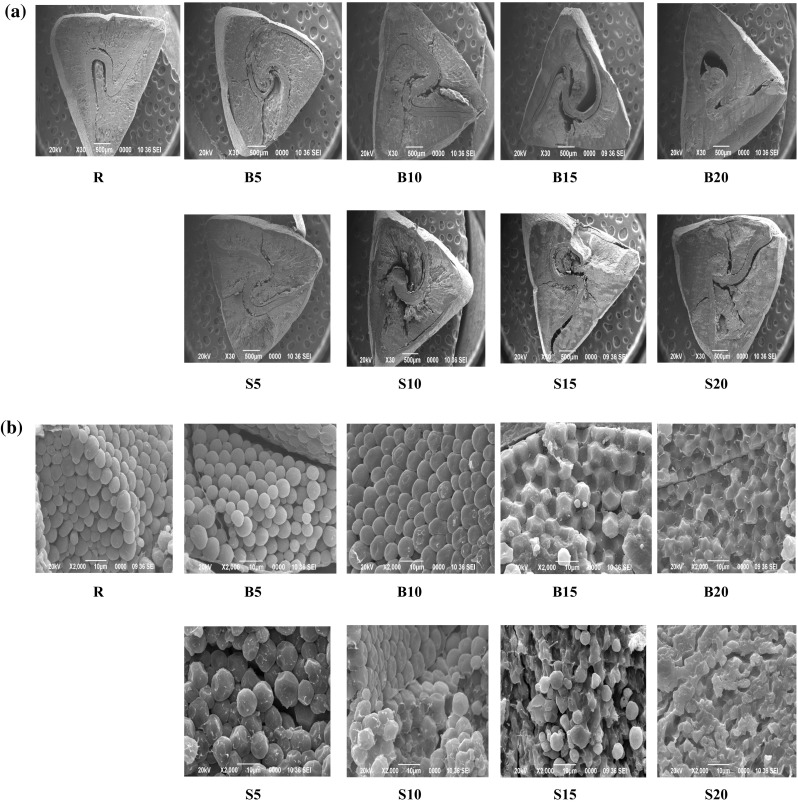
a × 30 and b × 2000 SEM images of groat transverse sections of raw buckwheat (R), buckwheat boiled for 5 (B5), 10 (B10), 15 (B15) and 20 (B20) minutes and buckwheat steamed for 5 (S5), 10 (S10), 15 (S15) and 20 (S20) minutes
Sediment volume and solubility
Hot soaking showed a minor rise of SV from 2.3 mL in R to 2.4 mL and 2.6 mL in B10 and B15 respectively. B15 and B20 exhibited values of 3.7 mL and 4.3 mL respectively (Fig. 2a). Steam processed samples exhibited more rapid increase in SV to 2.4 mL, 3.6 mL, 4.4 mL and 4.7 mL in S5, S10, S15 and S20 respectively, suggesting presence of higher amount of gelatinized starch in them. Sufficient moistening of the groats during soaking could be attributed to the substantial heat penetration and effect on starch microstructure during steaming. WSI values of the flour samples are presented in Fig. 2b. The increased WSI with severity of process showed close correlation with that of SV (R = 0.973). B20, S15 and S20 exhibited the highest WSI values of 19.3, 18.4 and 22.8% respectively, indicating thermal degeneration of starch and other macrostructures. The leached fraction contained both starch and protein structures (estimated quantities not reported). The values suggested enhanced effect of steaming over hot soaking on formation of leachable fractions.
Fig. 2.

a Sediment volume, b water solubility index, and c oil absorption capacities of raw and processed buckwheat samples
Oil absorption capacity
Oil absorption is primarily a function of the molecular composition and polarity of protein matter in a flour (Nithiyanantham et al. 2013). Marginal increase in the OAC on processing was observed (Fig. 2c). While R gave a value of 184.4%, OAC of B20 and S20 were 210.2% and 214.1% respectively. This may be attributed to decoiling and thermal denaturation of proteins in buckwheat flour resulting in exposure of the non-polar side chains capable of holding the additional amount of oil.
Pasting properties
RVA curves for raw and processed samples are given in Fig. 3a, b. R gave a PV of 1179 cP followed by a small BD (17 cP) to a hot paste viscosity HPV value of 1162 cP and a setback up to 2003 cP. B5 and S5 showed increased PV of 2714 cP and 1748 cP followed by small BD values of 9 cP and 7 cP respectively. This was suggestive of an altered molecular status and increase granular integrity of starch as observed for annealed starch. Starch annealing is carried out at temperature ranging between gelatinization and melting. Annealing strengthens the native crystalline structures of starch (Bhattacharjya et al. 2015). An increased crystallinity is related to reduced granular swelling and resistance to shear as was observed under SEM (Jacobs et al. 1997). A sharp setback to CPV of 4992 cP was attributed to release of long starch chains into the cooked slurry during heating phase. These chains formed a sediment during the cooling phase, thereby increasing the final viscosity of the paste. With increased severity of process temperature, the starch granules ruptured and were unable take up water on heating. B15, B20, S10, S15 and S20 showed PV values of 791 cP, 627 cP, 1293 cP, 644 cP and 218 cP respectively. The starch chains got further heat denatured and dissociated as much simpler fractions that were not able to retrograde and form the sediment as in B5 and S5, thereby showing lower SB. S15 and S20 showed the lowest CPV values of 834 cP and 421 cP respectively indicating the highest starch breakdown as was also indicated by their SV and WSIs. These samples showed a continuously rising curve as reported earlier for processed rice flour (Patindol et al. 2008).
Fig. 3.

RVA pasting curves of a hot soaked and b steam processed samples as compared to the that of raw sample, c strength of retrograded gel
Gel strength
Gel strength showed very strong positive correlation (R = 0.912) with the CPV values. Hardness of starch-based gel is primarily related to the extent of retrogradation and molecular structures associated with it (Wang et al. 2015). Mild hot soaking and steaming strengthened the starch chains by annealing and thereby gave stronger gels for B5 and S5 with gel strength values of 36.21 kg and 37.03 kg respectively (Fig. 3c). This also confirmed highest retrograded starch content in these paste samples. Higher temperature caused paste thinning by severe degradation of starch and lower retrogradation in the other samples. Severely processed buckwheat flour could be targeted as a base material for food systems requiring soft gel consistency upon cooking.
X-ray diffraction
The XRD curves of different buckwheat flour samples are presented in Fig. 4. Raw sample R demonstrated prominent peaks at 2θ values of 15.1, 18.1 and 23.1, which were characteristic of A-type starch crystalline pattern (Zobel 1964). Significant changes in the diffraction patterns occurred after hydrothermal processing. Marginal increase in crystallinity occurred from 26.8% in R to 27.3% and 27.5% in B5 and S5, respectively (Table 2). This confirmed the occurrence of annealed starch in the two samples. Increased process temperature resulted in gradual loss of crystallinity values to 7.2% and 7.4% in B20 and S20 respectively. Decoiling and melting of crystalline polymorphs upon hydrothermal processing of native starch have been reported (Wang and Copeland, 2013; De Pilli et al. 2012). The peak at 2θ = 23.1 showed notably higher stability than the other peaks, indicating hydrothermally stable lamellar arrangement at its locus. Apart from the native A-type peaks, presence of V-type peak at 2θ = 20.2 in the raw as well as processed samples was evident. This polymorphism occurs due to complex formation amongst starch chains with fatty acid molecules during thermal treatments (Putseys et al. 2009). The highest intensity of this peak in the XRD spectrum of S5 indicated that development of starch-lipid complex is not directly proportional to hydrothermal process severity. The lengths of amylose chains and long branches of amylopectin which form these complexes vary considerably in length. The lipid molecules that bind to form these complexes also vary in size and thermal behaviour (Zhang et al. 2010). Therefore, such differences between the structures and thermal stability of the complexes could be obvious. Steamed samples exhibited partial overlapping of B-type starch crystallinity with the native A-type pattern exhibited by new peaks at 2θ near 24.3 and 26.0. This mixed pattern indicated presence of retrograded starch in those samples (De Pilli et al. 2012). Gelatinized starch requires sufficient water in its environment to retrograde which also relates to their developed hygroscopicity (Mahanta and Bhattacharya 2010). Gelatinized starch in hot soaked samples exhibited very minor retrogradation owing to the limited availability of water during the brief span of hot soaking.
Fig. 4.

XRD curves of raw and a hot soaked, b steam parboiled samples
Table 2.
Physicochemical and nutritional properties of raw and processed buckwheat flour samples
| Crystallinity (%) | Thermal properties | Bioactive and antioxidant properties | Starch digestibility (%, db) | ||||||
|---|---|---|---|---|---|---|---|---|---|
| Onset temperature (To, °C) | Peak temperature (Tp, °C) | Conclusion temperature (Tc, °C) | Enthalpy change (ΔH, J/g) | TPC (mg GAE/g) | TFC (mg QE/g) | FRAP (mM/g) | |||
| R | 26.80 ± 1.27 g | 62.32 ± 0.28e | 66.63 ± 0.33c | 73.13 ± 0.04e | 9.36 ± 0.18d | 0.84 ± 0.14e | 0.96 ± 0.07 h | 70.21 ± 2.19i | 79.64 ± 0.94a |
| B5 | 27.30 ± 1.01f | 62.83 ± 0.18e | 66.85 ± 0.17c | 72.92 ± 0.16d | 10.06 ± 0.21e | 0.69 ± 0.18d | 0.68 ± 0.08 g | 41.19 ± 1.09 h | 79.71 ± 1.25b |
| B10 | 23.90 ± 1.44e | 53.74 ± 0.31c | 57.88 ± 0.35b | 63.10 ± 0.28c | 5.68 ± 0.23c | 0.64 ± 0.11c | 0.61 ± 0.03f | 36.09 ± 1.16 g | 88.39 ± 0.87c |
| B15 | 15.10 ± 0.98c | 52.29 ± 0.16a | 57.74 ± 0.07b | 63.43 ± 0.36c | 4.92 ± 0.41b | 0.62 ± 0.21c | 0.57 ± 0.02e | 31.15 ± 1.84f | 89.98 ± 1.21d |
| B20 | 7.20 ± 1.17a | 51.92 ± 0.22a | 56.79 ± 0.16ab | 61.86 ± 0.14a | 4.45 ± 0.10a | 0.58 ± 0.06bc | 0.56 ± 0.03e | 26.44 ± 1.92d | 91.81 ± 1.34e |
| S5 | 27.50 ± 1.67f | 61.87 ± 0.26d | 66.87 ± 0.28c | 72.16 ± 0.15d | 10.18 ± 0.16e | 0.54 ± 0.16b | 0.49 ± 0.03d | 27.88 ± 0.93e | 84.56 ± 0.72c |
| S10 | 18.60 ± 2.07d | 52.96 ± 0.19b | 56.81 ± 0.42ab | 63.02 ± 0.26c | 4.27 ± 0.09a | 0.51 ± 0.23b | 0.37 ± 0.09c | 23.12 ± 2.31c | 86.17 ± 1.01f |
| S15 | 13.80 ± 1.97b | 52.88 ± 0.18b | 56.48 ± 0.21a | 62.39 ± 0.31b | 4.34 ± 0.18a | 0.48 ± 0.02ab | 0.29 ± 0.10b | 22.01 ± 1.89bc | 87.02 ± 0.97 g |
| S20 | 7.40 ± 1.29a | 52.78 ± 0.25b | 56.44 ± 0.19a | 62.35 ± 0.29b | 4.48 ± 0.24a | 0.44 ± 0.19a | 0.21 ± 0.07a | 18.26 ± 1.43a | 88.36 ± 0.63 h |
Means superscripted by the same letter in a column do not differ significantly from one another (P > 0.05)
Differential scanning calorimetry
The thermal properties of the aqueous suspensions of raw and processed buckwheat flour are reported in Table 2. Raw buckwheat flour gave a single melting peak at Tp value of 66.63 °C indicative of starch gelatinization. Notable reduction inTo and Tc values were evident after processing and further reduction occurred with process severity. This was suggestive of alteration of thermal behaviors of starch crystallomorphs in the buckwheat samples during processing. Presence of annealed starch in B5 and S5 was indicated by the higher values of ΔH of the peaks between 66 and 67 °C, than that of R (Putseys et al. 2009). Melting peaks for retrograded starch was evident in samples hot soaked and steamed for 10, 15 and 20 min, with Tp values ranging between 56 and 58 °C and enthalpy values between 4.27 J/g and 5.68 J/g. DSC curves of both raw and processed samples showed weak peaks near 110 °C (values not shown), indicative of melting of starch-lipid complexes (Zhang et al. 2010). The enthalpy values, therefore, exhibited a weak positive correlation (R = 0.635) with the %crystallinity values of the samples.
Bioactive properties
The amount of bioactive compounds and antioxidant properties of raw and processed buckwheat flour samples are given in Table 2. Significant drop in TPC, TFC and FRAP values after processing indicated thermal denaturation and inactivation of antioxidant compounds (Qin et al. 2013). TFC values decreased more drastically than corresponding TPC values. Higher TPC in parboiled milled rice than raw rice was reported by Pal et al. (2018). The present contradictory finding may be attributed to differences in the type, distribution and heat stability of phenolic compounds in the two sources. This creates scope for a detailed bioactive analysis of buckwheat flour and groat layers. This difference was more prominent in case of the steam parboiled samples (R = 0.987) than in hot soaked sample (R = 0.992). Maillard compounds with antioxidant capacity may have formed in the most severely steamed samples, thereby masking the bioactivity of the native compounds (Amarowicz 2009). However, considering the process temperature, embedding of bioactive compounds in the gelatinized starch matrix can also be considered as another possibility. Zhang et al. (2010) reported formation of such compounds in tartary buckwheat processed by more severe thermal treatments like microwave and roasting.
Starch digestibility
Digestibility of starch in the flour samples after 180 min of incubation in enzymatic solution are presented in Table 2. Both hydrothermal processes resulted in increased digestibility of buckwheat starch. B20 exhibited the highest amount of digestible starch followed by S20. This difference was attributed to the abundance of gelatinized starch in the former, as was shown by the SV and XRD results (Dutta et al. 2015). The lower starch digestibility of steamed buckwheat samples could also be attributed to formation of resistant starch during retrogradation, which exhibited B-type starch polymorphism on XRD and DSC studies (Shin et al. 2005). High temperature hydrothermal processes resulting in formation of slowly digestible to non-digestible starch fractions have been reported by other authors (Amarowicz 2009).
Conclusion
Hydrothermal processing markedly altered the physical and physicochemical properties of buckwheat. Simple soaking in boiling water or steaming of moistened grains up to 20 min remarkably improved milling yield of buckwheat groats. Inward migration of pigment from the dark husk primarily caused the changes in flour colour. Maillard browning also occurred in severely processed samples as indicated by the antioxidant potential of the flours. Mild treatments for 5 to 10 min caused starch annealing. Starch breakdown on severe treatments resulted in increased water uptake capacity and release of water soluble fractions, finally forming a thinned paste after heating and cooling in RVA. Thermal denaturation of buckwheat proteins resulted in marginal increase in oil absorption capacity of the flour. Loss in starch crystallinity and formation of new starch crystallites was evident from XRD and DSC studies. Crystalline loci in native starch matrix showed specific tolerance against heat. While fractions of the native starch crystallites of buckwheat retain in the hot soaked samples, starch-lipid complexes develop on both hot soaking as well as steaming. Severe steam processing for 15 and 20 min caused retrogradation, forming amylolysis-resistant fractions. Rapid method of soaking buckwheat in boiling water to increase milling yield and altered physicochemical properties for targeted food uses may prove beneficial for high altitude Himalayan regions bearing cold climate.
Footnotes
Publisher's Note
Springer Nature remains neutral with regard to jurisdictional claims in published maps and institutional affiliations.
References
- Amarowicz R. Antioxidant activity of Maillard reaction products. Eur J Lipid Sci Technol. 2009;111(2):109–111. doi: 10.1002/ejlt.200900011. [DOI] [Google Scholar]
- AOAC . Official methods of analysis. 19. Arlington: Association of Official Analytical Chemists; 2012. [Google Scholar]
- Bhattacharjya B, Dutta H, Patwari K, Mahanta CL. Properties of annealed jackfruit (Artocarpus heterophyllus Lam.) seed starch. Acta Aliment. 2015;44(4):501–510. doi: 10.1556/066.2015.44.0021. [DOI] [Google Scholar]
- Bhattacharya KR. Rice quality: a guide to rice properties and analysis. Amsterdam: Elsevier; 2011. [Google Scholar]
- Christa K, Soral-Śmietana M. Buckwheat grains and buckwheat products–nutritional and prophylactic value of their components—a review. Czech J Food Sci. 2008;26(3):153–162. doi: 10.17221/1602-CJFS. [DOI] [Google Scholar]
- De Pilli T, Derossi A, Talja RA, Jouppila K, Severini C. Starch–lipid complex formation during extrusion-cooking of model system (rice starch and oleic acid) and real food (rice starch and pistachio nut flour) Eur Food Res Technol. 2012;234(3):517–525. doi: 10.1007/s00217-012-1662-6. [DOI] [Google Scholar]
- Dutta H, Mahanta CL. Laboratory process development and physicochemical characterization of a low amylose and hydrothermally treated ready-to-eat rice product requiring no cooking. Food Bioproces Technol. 2014;7:212–212. doi: 10.1007/s11947-012-1037-9. [DOI] [Google Scholar]
- Dutta H, Saikia S, Mahanta CL. A preliminary investigation on bioactive potential of milling fractions of Komal chaul of Assam processed from pigmented Kola chokua paddy. Int J Sci Technol. 2014;4(3):1–9. [Google Scholar]
- Dutta H, Mahanta CL, Singh V. Changes in the properties of rice varieties with different amylose content on dry heat parboiling. J Cereal Sci. 2015;65:227–235. doi: 10.1016/j.jcs.2015.07.016. [DOI] [Google Scholar]
- Goñi I, Garcia-Diz L, Mañas E, Saura-Calixto F. Analysis of resistant starch: a method for foods and food products. Food Chem. 1996;56(4):445–449. doi: 10.1016/0308-8146(95)00222-7. [DOI] [Google Scholar]
- Himmelsbach DS, Manful JT, Coker RD. Changes in rice with variable temperature parboiling: thermal and spectroscopic assessment. Cereal Chem. 2008;85(3):384–390. doi: 10.1094/CCHEM-85-3-0384. [DOI] [Google Scholar]
- Jacobs H, Eerlingen RC, Spaepen H, Grobet PJ, Delcour JA. Impact of annealing on the susceptibility of wheat, potato and pea starches to hydrolysis with pancreatin. Carbohydr Res. 1997;305(2):193–207. doi: 10.1016/S0008-6215(97)10035-0. [DOI] [Google Scholar]
- Lamberts L, Brijs K, Mohamed R, Verhelst N, Delcour JA. Impact of browning reactions and bran pigments on color of parboiled rice. J Agric Food Chem. 2006;54(26):9924–9929. doi: 10.1021/jf062140j. [DOI] [PubMed] [Google Scholar]
- Mahanta CL, Bhattacharya KR. Relationship of starch changes to puffing expansion of parboiled rice. J Food Sci Technol. 2010;47(2):182–187. doi: 10.1007/s13197-010-0038-9. [DOI] [PMC free article] [PubMed] [Google Scholar]
- Nithiyanantham S, Siddhurajua P, Francis G. Proximate composition and functional properties of raw and processed Jatropha curcas L. Kernel meal. Int J Res Pharm Biomed Sci. 2013;4(1):183–219. [Google Scholar]
- O’Sullivan AC, Perez S. The relationship between internal chain length of amylopectin and crystallinity in starch. Biopolym Orig Res Biomol. 1999;50(4):381–390. doi: 10.1002/(SICI)1097-0282(19991005)50:4<381::AID-BIP4>3.0.CO;2-W. [DOI] [PubMed] [Google Scholar]
- Pal P, Singh N, Kaur P, Kaur A. Effect of parboiling on phenolic, protein, and pasting properties of rice from different paddy varieties. J Food Sci. 2018;83(11):2761–2771. doi: 10.1111/1750-3841.14347. [DOI] [PubMed] [Google Scholar]
- Pandey S, Senthil A, Fatema K. Effect of hydrothermal treatment on the nutritional and functional properties of husked and dehusked buckwheat. J Food Process Technol. 2015;6(7):461–467. [Google Scholar]
- Pathare PB, Opara UL, Al-Said FAJ. Colour measurement and analysis in fresh and processed foods: a review. Food Bioprocess Technol. 2013;6(1):36–60. doi: 10.1007/s11947-012-0867-9. [DOI] [Google Scholar]
- Patindol J, Newton J, Wang YJ. Functional properties as affected by laboratory-scale parboiling of rough rice and brown rice. J Food Sci. 2008;73(8):E370–E377. doi: 10.1111/j.1750-3841.2008.00926.x. [DOI] [PubMed] [Google Scholar]
- Putseys JA, Derde LJ, Lamberts L, Ostman E, Bjorck IM, Delcour JA. Functionality of short chain amylose–lipid complexes in starch—water systems and their impact on in vitro starch degradation. J Agric Food Chem. 2009;58(3):1939–1945. doi: 10.1021/jf903523h. [DOI] [PubMed] [Google Scholar]
- Qin P, Wu L, Yao Y, Ren G. Changes in phytochemical compositions, antioxidant and α-glucosidase inhibitory activities during the processing of tartary buckwheat tea. Food Res Int. 2013;50(2):562–567. doi: 10.1016/j.foodres.2011.03.028. [DOI] [Google Scholar]
- Rockembach CT, El Halal SLM, Mesko MF, Gutkoski LC, Elias MC, de Oliveira M. Morphological and physicochemical properties of rice grains submitted to rapid parboiling by microwave irradiation. LWT Food Sci Technol. 2019;103:44–52. doi: 10.1016/j.lwt.2018.12.036. [DOI] [Google Scholar]
- Sarangapani C, Thirumdas R, Devi Y, Trimukhe A, Deshmukh RR, Annapure US. Effect of low-pressure plasma on physico–chemical and functional properties of parboiled rice flour. LWT Food Sci Technol. 2016;69:482–489. doi: 10.1016/j.lwt.2016.02.003. [DOI] [Google Scholar]
- Shin SI, Kim HJ, Ha HJ, Lee SH, Moon TW. Effect of hydrothermal treatment on formation and structural characteristics of slowly digestible non-pasted granular sweet potato starch. Starch Stärke. 2005;57(9):421–430. doi: 10.1002/star.200400377. [DOI] [Google Scholar]
- Wang S, Copeland L. Molecular disassembly of starch granules during gelatinization and its effect on starch digestibility: a review. Food Funct. 2013;4(11):1564–1580. doi: 10.1039/c3fo60258c. [DOI] [PubMed] [Google Scholar]
- Wang S, Li C, Copeland L, Niu Q, Wang S. Starch retrogradation: a comprehensive review. Compr Rev Food Sci Food Saf. 2015;14(5):568–585. doi: 10.1111/1541-4337.12143. [DOI] [Google Scholar]
- Zhang M, Chen H, Li J, Pei Y, Liang Y. Antioxidant properties of tartary buckwheat extracts as affected by different thermal processing methods. LWT Food Sci Technol. 2010;43(1):181–185. doi: 10.1016/j.lwt.2009.06.020. [DOI] [Google Scholar]
- Zobel HF. X-ray analysis of starch granules. Methods Carbohydr Chem. 1964;4:109–113. [Google Scholar]