

Abstract
Rotating components in mechanical systems produce tonal noises and the presence of these tones effect the quality and comfort of occupants leading to annoyance and a decrease in mental performance. The ISO 1996-2 and ANSI S1.13 standards have described metrics to quantify the effects of prominent tones, but more research on how noise attributes effect annoyance and performance, especially in different levels of task difficulty are necessary. This paper investigates relations between noise metrics, annoyance responses and mental performance under different task difficulty levels while exposed to background noise with tonal components. In this study, sixty participants were evaluated on subjective perceived annoyance and varying workloads while exposed to 18 noise signals with three different prominence tones at three frequency tones and two background noise levels while doing three different levels of n-back tasks in a controlled test chamber. Performance parameters were measured by recording the reaction time, the correct rate, and the number of misses. The results indicate an increasing trend for number of misses and reaction times at higher task difficulty levels, but a decrease for correct rate. The study results showed a significant difference for subjective responses except for annoyance and loudness under different levels of task difficulty. The participants were more annoyed with higher background noise levels, lower tone frequencies and increasing tone levels especially under increasing task difficulty. Loudness metrics highly correlate with other noise metrics. Three models for the prediction of perceived annoyance are presented based on the most strongly correlated noise metrics using neural network models. Each of the three models had different input parameters and different network structures. The accuracy and MSE of all three neural network models show it to be appropriate for predicting perceived annoyance. The results show the effect of tonal noise on annoyance and mental performance especially in different levels of task difficulty. The results also suggest that neural network models have high accuracy and efficiency, and can be used to predict noise annoyance. Model 1 is preferred in certain aspects, such as lower input parameters, making it more user-friendly. The best neural network model included both loudness metrics and tonality metrics. It seems that combined metrics have the least importance and are unnecessary in the proposed neural network model.
Keywords: Tonal noise annoyance, Mental performance, Task difficulty, Noise metrics, Neural network
Introduction
Effects of noise on annoyance and performance
With the expansion of work activities in office and control rooms, the problem of noise pollution due to background noise is an important issue in the maintaining of an optimal indoor environment as most mechanical systems are recognized as the main source of noise and background stressors [1–3]. Rotating components within mechanical systems decrease the assessment of sound quality in indoor environments while annoying the occupants [4]. Annoyance is the most common noise effect in the workplace although not defined presently. According to ISO / TS 15666: 2003, annoyance is defined as “the individual’s reaction to noise in various ways including dissatisfaction, bother, annoyance and disturbance” [4]. In addition to acoustic factors, non-acoustic factors also affect annoyance. Marquis-Favre et al. showed that fear and sensitivity to noise are one of the most important non-acoustic factors retaining to annoyance [5] while sensitivity to noise, especially regarding noise in mechanical systems without high-pressure levels, is considered as the factor with maximum effect.
Over the past few decades, extensive studies have been conducted on the relationship between tone components, annoyance and task performance. The expansion of noise producing sources, the lack of a comprehensive study in each area, inconsistency in the results of these studies and the lack of a general consensus on the effect of tonal noise has led to a failure in achieving comprehensive solutions in dealing with these types of noise [6]. There is no accepted allowable value for tonal noise, though a 5 dB penalty is incurred in a number of municipalities in the US, when detecting tone in components for a source by using a one-third octave band measurement technique determined by the ISO 1996-2:2007 standard, Annex D [7–9].
The development of jet engines in the 1960s caused researchers to conduct studies on tonal noises and the development of quantitative metrics for human perception of noise annoyance such as the perceived noise level (PNL) [10, 11]. Other metrics considering the tonality and loudness of noise in evaluation were gradually presented. The evaluation of the effects of tonal noises continued in the 1980s with the Hellman studies on the relationship between annoyance perception and tonal noise attributes including frequency and loudness [12, 13]. More and Davis evaluated the effect of noise tone components on annoyance using subjective investigation. In their study, human noise annoyance was evaluated without performing any tasks and a regression model was introduced that included the tonality and loudness metrics while having a good match with annoyance responses for those exposed to noise tones [14]. Balant and Hellweg showed that both the prominence ratio and the tone to noise ratio matched well with perceived annoyance of tone at 250 and 1000 Hz [15]. Ryherd and Wang showed an increasing trend in annoyance and distraction for higher tone levels but did not show significant differences between task performance and noise conditions. Their results show that a weak correlation exists between noise metrics and the perceived annoyance of noise tones.
Other studies also show no significant correlation between noise metrics and annoyance [16–18]. Landström et al. examined the relationship between noise levels and annoyance in actual working conditions. Their findings showed a weak correlation between noise levels and annoyance although the perceived annoyance showed an increasing trend with the presence of tone components [19].
The findings of Lee et al. indicated a very high correlation between annoyance responses and loudness metrics while they showed a lower correlation for tonal metrics [20]. Previous studies seriously suggest that when evaluating noise in building mechanical systems, tonality metrics must also be considered, though until now, none of the existing tonal metrics have been extensively used and there is still a limited understanding of the relationship between measurable objective metrics and perceived annoyance. This is why most studies show an inconsistent change in the relationship between annoyance perception and noise metrics. Although these studies consider this for the investigation of noise in mechanical systems, the tonality metrics should be considered as part of the noise metrics.
Certain studies have been conducted on the effects of tonal noise in mechanical systems on human perception and performance [6, 21]. Laird showed in laboratory studies that the presence of tone in noise increased error rates, especially when the frequency is raised up to 512 Hz [22]. Grjmaldi shows that tones in the frequency range of 2400 to 4800 Hz causes an increase in reaction times and error rates [23]. Ryherd and Wang’s study on the effect of background noise on performance showed an increasing trend between annoyance and distraction when increasing tone levels but showed no significant difference between task performance and noise conditions. Lee’s study showed a decrease in accuracy when tone levels are increased though this difference was not statistically meaningful [20]. Other studies showed no statistically significant difference in task performance while exposed to both broadband noise and tonal noise [16, 21].
It is worth noting that in all of these studies, the level of task difficulty has not been taken into account. The noise effect does seems to be dependent on task difficulty [24]. Studies have shown that exposure to loud noises at different levels of task difficulty has a different effect on performance [25]. The results of these studies have interpreted the decline in performance as a result of the distraction of one’s attention due to exposure to noise [26]. Recent studies have investigated the effect of noise on performance at different levels but no study has ever investigated the annoyance of tonal noises in different levels of task difficulty and its effect on performance.
In some studies, the theoretical and experimental result of the study found that psychoacoustical parameters are closely related to annoyance. Zwicker’s annoyance model combines metrics including psychoacoustic, loudness, sharpness, and fluctuation strength [27]. Based on the above, a psychoacoustic annoyance model is presented in this study that includes “roughness” also [28]. The evaluation of annoyance caused by noise is generally conducted through self-assessment using a variety of methods. In subjective evaluation, the test is repeated by changing sound stimuli. The repetition of the test increases the researcher’s workload heavily and this is considered a disadvantage for subjective evaluation.
On the other hand, findings show that most annoyance models are based on multiple linear regression algorithms. Lee et al. used a multiple regression model to develop a prediction of annoyance response to tonal noise. In such a model, the two metrics of ANSI and tonal audibility correlating with the perceived annoyance were used [20]. Linear approximation may lead to errors due to the complicated non-linear relationship between psychoacoustical parameters and human hearing perception. Therefore, using substitution methods provide more accurate results for annoyance prediction caused by noise stimuli.
Artificial neural networks are one of the substitution models used to solve the problem of classification and prediction. Such networks have been used extensively for nonlinear approximation in acoustic research. For example, Yang and Kang performed the soundscape evaluation using a neural network [29]. Genaro et al. provided an accurate prediction of urban noise using neural networks [30]. It can thus be concluded that the development of annoyance predictive models with nonlinear methods (such as neural networks) is necessary in order to better map the relationship between metrics of objective evaluation and auditory sensation and/or subjective perception.
Metrics used to predict tonality in noise and loudness
Noise evaluation was performed using noise metrics focusing mainly on pressure levels. Some currently applied noise metrics were modified to also consider tonality. Tonality metrics include the 1995 Standard for Outdoor Unitary Equipment [31], the United States Federal Aviation Regulations [32–34], and revised noise metrics for designing and rating of heating ventilation and air-conditioning systems [35]. According to ANSI S1.13 and ISO 1996-2, the metrics to tone to noise ratio, prominence ratio, and tonal audibility are considered for tonality quantification. The tone to noise ratio was defined as “the intended tone’s power ratio to the critical band power centered on said tone, regardless of tonal features within the spectrum. Prominence tone includes the critical band power ratio having the tone to the average power of the two adjacent bands [36]. Tonal Audibility is calculated by measuring the prominence tones from the frequency band spectrum and includes three steps: (a) analyzing the frequency narrow band, (b) determining the sound pressure level in the critical band spectrum including tone, and (c) calculating the tonal audibility using the information obtained from the first two steps [37].
The metrics of tonality are calculated from the Fast Fourier Transform (FFT) analysis of the frequency range of the noise recorded in a steady-state. The metric of tone to noise ratio and prominence tone ANSI are considered constant over the frequency and based on unweighted sound pressure levels. Such metrics are calculated by considering a frequency correction term. However, the tonal audibility ISO uses A-weighted sound pressure levels [4].
Loudness metrics were chosen to be considered because they are closely related to perceived annoyance. The ANSI S3.4 and ISO 532B instructions provide certain metrics for measuring loudness based on the Zwicker and Moore models using one-third octave values. The perceived noise level is used to quantify the subjective annoyance caused by tonal noise of aircrafts which is calculated using one-third of the octave band [38].
Combined metrics are among other metrics of noise evaluation that indicate good correlation with different levels of tone and subjective annoyance by considering both tonality and loudness of tonal noises. The Sound Quality Index (SQI), Tone-Corrected Perceived Noise Level (PNLT), and Joint Nordic Method (JNM) are some of these metrics [7, 8, 39, 40]. The Institute of Air Conditioning, Heating, and Refrigeration have proposed a Sound Quality Index for the rating of noise produced by mechanical systems [41]. The Joint Nordic Method was standardized in the ISO 1996-2: 2007 standard [40] which is calculated by extracting the k values from tonal audibility and adding them to the A-weighted sound pressure level. The tone-corrected perceived noise level is the modified version of the perceived noise level (PNL) which is calculated by adding the tone correction factor to the PNL [38].
The tonality metrics that have been proposed in this study include prominence ratio, tone to noise ratio, and tonal audibility. The ANSI, loudness level, and perceived noise level were evaluated from the loudness metrics. In addition, SQI, PNLT and JNM were evaluated as combined metrics while roughness, sharpness, and fluctuation strength were evaluated as psychoacoustical parameters.
Material and methods
Laboratory arrangements
All stages of this study were carried out in an acoustic room with a dimension of 5x6x2.5 m furnished as an office environment at the Shahid Beheshti University of Medical Sciences. All experiments were monitored from an adjacent room through a triple-glazed window. The surface of the ceiling and walls were covered with acoustic tiles and the floor was covered with carpet. The background ambient noise and the average time for the reverberation of sound in the room were 35 dBA and 0.31 s respectively (when the ventilation system is turned off). A JBL sound source in the middle of the room and a subwoofer in the corner were used to generate tonal noise signals. The speaker was hidden in order to ensure the same distance from participants as to the sound source is maintained and no interference with the testing process is introduced.
Test signals
Noise signals were generated at two background levels, three frequencies and three prominence tone levels using the Test Tone Generator software from Esser Audio. First, the audio signals were generated at two levels of 40 and 55 dBA which is the common sound pressure level for building equipment. Then, one of the three levels of tone were added to the background signal set to one of the three desired frequencies. Finally, 18 noise signals were produced. Table 1 shows the prominence ratios of tone, frequency tone of the background noise level, and tone level. The prominence ratios were determined according to the ANSI S12.10–2010 standard [39]. Measurement of the noise signals was done using a B & K 4191-A microphone through the B & K Pulse system at the listener’s ear and its mean over a minute was used to calculate the noise metric. The metrics were calculated using the B & K sound quality app and the MATLAB software solution. In order to prevent fatigue caused by prolonged exposure to sound stimuli and test conditions, test signals were randomly divided into five assessment groups of 4 sounds each. The Latin square was used for selecting the sound arrangement. As such, the effect of the sequential comparison of sounds was eliminated.
Table 1.
Prominence Ratios for tones in the noise stimuli used in subjective testing as listed by tonal frequency, background noise level, and tone level
| Sound | BNL | F T | T L | P R | Sound | BNL | F T | T L | P R | Sound | BNL | F T | T L | P R |
|---|---|---|---|---|---|---|---|---|---|---|---|---|---|---|
| 1 | 45 | 125 | 2 | 18 | 4 | 60 | 125 | 2 | 15 | 7 | 45 | 500 | 2 | 12 |
| 2 | 45 | 125 | 5 | 27 | 5 | 60 | 125 | 5 | 24 | 8 | 45 | 500 | 5 | 15 |
| 3 | 45 | 125 | 9 | 36 | 6 | 60 | 125 | 9 | 33 | 9 | 45 | 500 | 9 | 25 |
| 10 | 60 | 500 | 2 | 9 | 13 | 45 | 1000 | 2 | 6 | 16 | 60 | 1000 | 2 | 3 |
| 11 | 60 | 500 | 5 | 18 | 14 | 45 | 1000 | 5 | 15 | 17 | 60 | 1000 | 5 | 13 |
| 12 | 60 | 500 | 9 | 27 | 15 | 45 | 1000 | 9 | 25 | 18 | 60 | 1000 | 9 | 22 |
*BNL Background Noise Level (dBA), FT Frequency Tone (Hz), TL Tone Level, PR, Prominence Ratio for tone (dB)
Subject selection
A total of 60 right-handed males and females between the ages of 20 to 30 (24 ± 5) years old participated in this study. All subjects were screened for hearing loss and those subjects with normal hearing thresholds under 25 dB at frequencies of 125 to 8000 Hz were selected. In addition, the subjects completed a questionnaire on health and hearing sensitivity. The noise sensitivity questionnaire had a four-level rating scale (totally agree = 1, somewhat agree = 2, somewhat disagree = 3 and totally disagree = 4) [42]. Subjects with extreme high and low sensitivity to noise were excluded from the study. All participants were required to sign a consent form before the test. An orientation session was held for all participants. The orientation session included familiarity with the concept of noise annoyance, how to complete the subjective questionnaire for mental workloads and noise annoyance as well as practice runs on how to do the n-back task.
Research method
All subjects participated in two test sessions. Each session included seven five-minute tests (e.g. four noise conditions and three base conditions). The control conditions included the test noise without tone component. In each session, the participant was placed at the designated location and performed the n-back task with three degrees of difficulty (low, moderate and high) while exposed to noise. The order of the tasks for all subjects was the same going from low to high mental tasks.
The n-back task consisted of providing sequential stimuli at intervals of four seconds. The participants were to match the color and shape characteristics of the current stimulus with the previous stimuli according to the instructions. To increase difficulty, the n value was raised as well as the number of stimuli in the stage. At a low level of difficulty (LDL) or 1-back the subject must match the color and shape of nine stimuli with one previous stimulus. At a moderate level of difficulty (MDL) or 2-back the subject must match the color and shape of 14 stimuli with two previous stimuli and at a high level of difficulty (HDL) or 3-back the subject must match the color and shape of 21 stimuli with three previous stimuli. Performance in these tasks was measured by recording reaction times, correct rates, and number of misses (no responses). Reaction time was defined as the time interval between the presentation of the stimulus on the screen and pressing the button for reaction. The number of correct answers given was considered as the correct rate while not pressing the button was considered number of misses. The latter item likely reflects cognitive fatigue [43].
The participants had to completes the developed NASA task load index questionnaire (NASA-TLX) after the end of each exposure condition [20]. The developed questionnaire includes three questions regarding mental demand, performance, and effort during the task. In addition, it includes two questions about annoyance and loudness of the noise they were exposed to. Each question was answered on a 21-point scale.
Data analysis
The difference between subjective responses at three levels of task difficulty for three dimensions of mental workload, two dimensions of subjective annoyance, and the overall average of five dimensions of the NASA-TLX was analyzed using a linear mixed model approach. This approach was also used to analyze all performance parameters and to examine the differences between the three levels of task difficulty (low, medium and high). The Effect Size Index was reported and the Bonferroni multiple comparison method was used. The relationship between metric noises and subjective responses was evaluated for different task difficulty levels and noise conditions using correlation analysis. The statistical analysis was performed using the SPSS software solution version 21.0., and a 5% significance level was adopted in all tests. Prediction models for annoyance based on neural networks were performed using the MATLAB software solution.
Results and discussion
Changes in task performance and subjective responses at different levels of task difficulty
The subjective investigation was extracted from the responses of the subjects to the NASA-TLX questionnaire. In addition to the five subjective dimensions of Mental Demand (MD), Performance (P), Effort (EF), Annoyance, and Loudness, the TLX-avg score was set as the average of the five mentioned dimensions in order to show the overall score of the perceived mental load required by the task in terms of noise exposure. The performance parameters of the n-back task included correct rate, number of misses and reaction times. The results also include mean values and standard deviation from the NASA-TLX questionnaire’s subjective dimensions, as well as performance parameters in three levels of low, medium, and high task loads and the general status are presented in Table 2.
Table 2.
Comparison of Means ±S.D. for subjective parameters and performance in three task difficulty levels
| Parameters | Level of task difficulty | Results | Size effect | ||
|---|---|---|---|---|---|
| LDL | MDL | HDL | P value | ||
| M D | 18.97 ± 16.83 | 37.77 ± 20.2 | 64.4 ± 22.19 | <0.001 | 0.640 |
| P | 17.07 ± 13.05 | 35.79 ± 18.91 | 65.1 ± 21.56 | <0.001 | 0.647 |
| EF | 17.26 ± 14.09 | 35.34 ± 18.54 | 64.08 ± 21.63 | <0.001 | 0.626 |
| AN | 45.9 ± 30.71 | 45.47 ± 42.28 | 44.61 ± 31.06 | 0.365 | 0.002 |
| LO | 45.47 ± 30.29 | 44.18 ± 17.1 | 45.18 ± 30.82 | 0.355 | 0.004 |
| TLX-avg | 17.34 ± 12.25 | 36.3 ± 3.42 | 64.30 ± 19.76 | <0.001 | 0.723 |
| R T | 1.36 ± 0.37 | 1.85 ± 0.56 | 2.23 ± 0.56 | <0.001 | 0.340 |
| M R | 19.94 ± 12.58 | 15.47 ± 8.30 | 36.19 ± 13.3 | <0.001 | 0.574 |
| C R | 52.2 ± 15.4 | 61.47 ± 10.97 | 34.18 ± 9.32 | <0.001 | 0.424 |
MD Mental Demand, PD Performance, EF Effort, L Loudness, AN Annoyance, RT Reaction Time, MR missed responses, CR Correct Rate
The subjective ratings for each difficulty level are determined at different noise conditions and under separate evaluation conditions for different levels of task difficulty. On the other hand, the general condition evaluation was the result of the simultaneous effect of noise and the change in the levels of task difficulty. As Table 2 shows, except for annoyance and loudness, subjective responses as well as performance parameters significantly increased when the task difficulty was raised. Increasing the level of task difficulty has no effect on the perceived subjective annoyance and loudness. As expected, the results of perceived subjective annoyance and loudness were closely tied. The results of the linear mixed model analysis show a significant effect on the mean value of the NASA-TLX (TLX-avg) (F (2, 199.66) = 772.86, p < 0.001) for different levels of task difficulty. The results show that the TLX-avg was significantly greater during high task difficulty than during medium or low task difficulty (p < 0.001) (Fig. 1).
Fig. 1.
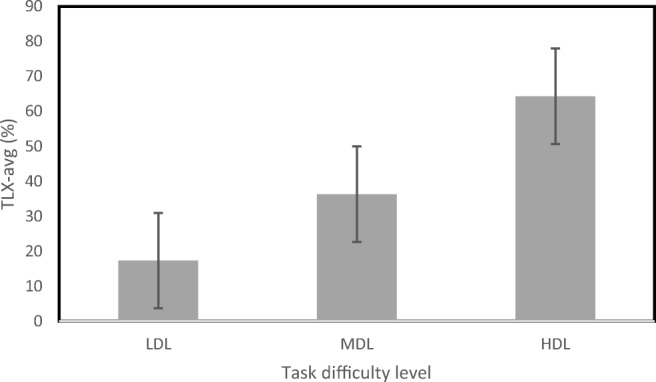
TLX-avg against different levels of task difficulty. Error bars indicate standard errors of the mean
Comparing TLX-avg results show that under high difficulty levels, the TLX-avg was significantly greater than in low and medium difficulty levels (p < 0.001). The linear mixed model analysis of mental parameters in the NASA-TLX shows a significant difference in HDL as compared to LDL and MDL for MD (F (2,102.83) = 638.7, p < 0.001), P (F (2,119.2) = 634.1, p < 0.001), EF (F (2,118.05) = 584.8, p < 0.001) but not for annoyance (F (2, 957.39) = 1.09, p = 0.337) and loudness (F (2, 866.78) = 2.711, p = 0.067).
The results show that changes in performance parameters were consistent such that the correct rate would decrease as the difficulty level was raised. An incremental trend was also observed in the number of missed responses and reaction times as the difficulty levels was raised. The linear mixed model analysis for performance parameters indicate significantly high correct rate (F (2, 118.52) = 412.008, p < 0.001), missed responses (F (2, 134.78) = 148.166.16, p < 0.001) and reaction times (F (2, 136.77) = 136.392, p < 0.001) for HDL as compared to LDL and MDL.
The results of the performance parameters and the three dimensions of MD, P, and EF in the NASA-TLX confirm that when the intensity of the mental workload is increased mental demand and the amount of effort needed from the subjects also increase as they experience more mental stress. This can lead to mental disorders and can affect performance parameters.
Changes in task performance and subjective responses to different noise attributes
Table 3 shows the mean values including standard deviations for changes in task performance and subjective responses under noise exposure at different tone levels. The results obtained for annoyance and loudness show a significant correlation with increasing tone levels such that increasing the tone level results in a significant effect on perceived annoyance and loudness. The dimensions of the NASA-TLX included mental demand, performance and effort and showed a significant relationship with increasing tone levels. The linear mixed model for the five dimensions of the NASA-TLX showed a significant difference for MD (F (3, 147.7) = 130.077, p < 0.001), P (F (3, 165.598) = 46.942, p < 0.001), EF (F (3,161.411) = 48.835, p < 0.001), annoyance (F (3, 176.71) = 1058.5, p < 0.001) and loudness (F (3, 155,012) = 2529.22, p < 0.001) in higher level tones as compared to lower level tones and also noise without tone.
Table 3.
Comparison of Means ± S.D. for subjective parameters and performance in different tone level of noise
| Prominence tone | Results | Size effect | ||||
|---|---|---|---|---|---|---|
| Parameters | Without tone | Level 2 | Level 5 | Level 9 | P value | |
| M D | 25.29 ± 18.33 | 47.98 ± 26.86 | 52.54 ± 26.7 | 55.1 ± 28.4 | <0.001 | 0.476 |
| P | 29.1 ± 19.1 | 44.7 ± 28.4 | 47.2 ± 28.5 | 48.05 ± 30.03 | <0.001 | 0.27 |
| EF | 27.9 ± 20.1 | 46 ± 27.3 | 49.5 ± 29.5 | 49.2 ± 29.7 | <0.001 | 0.296 |
| AN | 21.04 ± 4.9 | 57.9 ± 12.5 | 71.7 ± 8.39 | 89.41 ± 7.71 | <0.001 | 0.755 |
| LO | 21 ± 4.9 | 58.21 ± 14.3 | 73.8 ± 16.04 | 81.74 ± 19.76 | <0.001 | 0.967 |
| R T | 1.8 ± 0.66 | 1.79 ± 0.57 | 1.85 ± 0.54 | 1.88 ± 0.59 | 0.203 | 0.004 |
| M R | 18.7 ± 13.7 | 23.8 ± 14.4 | 25.4 ± 12.1 | 34.9 ± 14.1 | <0.001 | 0.057 |
| C R | 58.9 ± 15.1 | 50.1 ± 13.99 | 41.08 ± 12.2 | 33.4 ± 9.7 | <0.001 | 0.199 |
MD Mental Demand, PD Performance, EF Effort, L Loudness, AN Annoyance, RT Reaction Time, MR missed responses, CR Correct Rate
Evaluation of the performance parameters, except for reaction times, show consistent changes for the correct rate and the number of misses as tone levels are increased. Increasing tone showed a significant relationship with the increase in the number of misses and a reduction in the correct rate. Increases in the number of misses confirms cognitive fatigue as tone levels are increased. Although a difference was not observed between reaction time as tone levels are increased as compared with noise without tone. The linear mixed model analysis for performance parameters, except for reaction time (F (3, 176.56) =1.031, p = 0.38), indicate a significant difference for the correct rate (F (3, 174.124) = 35.414, p < 0.001) and the number of misses (F (3, 71.65) = 8.1, p < 0.001) in higher tone levels as compared to lower ones.
The mean values including standard deviations of changes in task performance and subjective responses under noise exposure with different frequencies are presented in Table 4. The results show that except for the reaction time, increasing frequency leads to consistent changes in subjective dimensions and performance parameters. The highest increase in subjective dimensions was related to annoyance and loudness while the correct rate showed the most change among performance parameters with an increase in frequency. Linear mixed model analysis showed a significant effect for MD (F (2, 103.101) = 11.975, p < 0.001), P (F (2, 149.654) = 7.326, p < 0.001) and EF (F (2, 137.81) = 4.001, p = 0.003) with increasing frequencies, although these changes for the two parameters of loudness (2, 145.215) = 98.499, p < 0.001) and annoyance (F (2, 264.29) = 15.99, p < 0.001) showed the main significant effect. Figure 2 shows the average change of annoyance for physical attributes of background noise levels, tone frequency, and tone level.
Table 4.
Comparison of Means ± S.D. for subjective parameters and performance in different tone frequency of noises
| Parameters | Tone frequency | Results | Size effect | ||
|---|---|---|---|---|---|
| 125 Hz | 500 Hz | 1000 Hz | P value | ||
| M D | 49.29 ± 18.33 | 47.66 ± 25.26 | 59.1 ± 26.64 | <0.001 | 0.049 |
| P | 44.67 ± 28.65 | 43.62 ± 28.32 | 52.51 ± 29.11 | <0.001 | 0.045 |
| EF | 44.56 ± 27.96 | 46.38 ± 26.51 | 51.4 ± 28.74 | 0.02 | 0.018 |
| AN | 74.61 ± 10.3 | 70.34 ± 13.61 | 62.1 ± 14.87 | <0.001 | 0.332 |
| LO | 74.78 ± 10.23 | 70.26 ± 15.48 | 64.7 ± 43.89 | <0.001 | 0.331 |
| R T | 1.81 ± 0.57 | 1.84 ± 0.59 | 1.87 ± 0.52 | 0.742 | 0.002 |
| M R | 27.68 ± 11.92 | 27.20 ± 13.63 | 17.18 ± 17,53 | 0.108 | 0.012 |
| C R | 39.64 ± 11.77 | 43.69 ± 14.25 | 43.98 ± 15.59 | 0.106 | 0.001 |
MD Mental Demand, PD Performance, EF Effort, L Loudness, AN Annoyance, RT Reaction Time, MR missed responses, CR Correct Rate
Fig. 2.

Changes in mean annoyance perception against noise attributes; upper right - background noise level, upper left - tonal frequency, bottom - tone level. Error bars indicate standard errors of the mean
The results of the linear mixed model analysis of performance parameters including correct rate, number of misses, and reaction time while increasing frequency of tones were (F (2, 139.5) = 0.742, p = 0.478), (F (2, 78.10) = 2.287, p = 0.108) and (F (2, 492.07) = 2.251, p = 0.106), respectively. All parameters did not show significant effects with a change in frequency.
The mean values including standard deviations of changes for task performance and subjective responses under noise exposure with different pressure levels of noises are presented in Table 5. Subjective responses in the three dimensions related to workload show inconsistent changes when increasing pressure levels of noise but was consistent for annoyance and loudness. It appears that tonal frequency effected subjective dimensions more than the background noise level. The performance parameters of the correct rate and the number of misses showed a significant change when increasing the pressure level of noises but not for the reaction time. This means that the subjects’ accuracy was affected under increasing background noise levels as well as the exhaustion of cognitive resources.
Table 5.
Comparison of Means ± S.D. for subjective parameters and performance in two pressure level of noises
| Background noise | Result | Size effect | ||
|---|---|---|---|---|
| Parameters | 40 dBA | 55 dBA | P value | |
| M D | 40.077 ± 0.27 | 40.56 ± 27.01 | 0.003 | 0.010 |
| P | 39.53 ± 26.4 | 38.04 ± 26.3 | 0.137 | <0.001 |
| EF | 39.52 ± 26.4 | 38.33 ± 26.71 | 0.001 | 0.001 |
| AN | 43.74 ± 28.81 | 46.71 ± 39.58 | <0.001 | 0.357 |
| LO | 43.8 ± 28.75 | 45.86 ± 31.91 | <0.001 | 0.312 |
| R T | 1.83 ± 0.58 | 1.82 ± 0.63 | 0.812 | <0.001 |
| M R | 21.92 ± 13.2 | 25.1 ± 15.62 | 0.236 | 0.001 |
| C R | 49.37 ± 16.51 | 49.37 ± 16.64 | 0.086 | 0.012 |
MD Mental Demand, PD Performance, EF Effort, L Loudness, AN Annoyance, RT Reaction Time, MR missed responses, CR Correct Rate
Performance parameters showed no significant effect in different background pressure level of noises and the results were: reaction time (1, 1074.28) = 0.057, p = 0.812), missed responses (F (1, 803.83) = 1.407, p = 0.236), correct rate (F (1, 1116.7) = 2.953, p = 0.086). The results show that, except for P (F (1, 61.31) = 2.274, p = 0.137), increasing the background noise level lead to consistent changes in EF (F (1, 157.56) = 11.173, p < 0.001) and MD (F (1, 46.629) = 9.961, p = 0.003), annoyance (F (1, 88.13) = 59.158, p < 0.001) and loudness (F (1, 56.82) = 195.9, p < 0.001).
Relating noise metrics to subjective responses
The correlation of noise metrics with the mean subjective perception of loudness, annoyance, and task load index for the three levels of difficulty was evaluated separately in three noise conditions (Table 6). When the signals were evaluated in their overall condition, the metrics pertaining to loudness (loudness, loudness level, and perceived noise level) showed a higher correlation with subjective responses of loudness and annoyance. The results emphasize that loudness is the most influencing factor in the perceived annoyance of noise. On the other hand, the loudness metrics had the highest correlation coefficient with the task load index mean at different levels of task difficulty and these coefficients show a stronger correlation when increasing the difficulty level, such that the correlation coefficient show a significant increase in high difficulty levels as compared to low difficulty levels. Among the tonality metrics, the highest correlation was observed between tonal audibility and subjective perception of loudness and annoyance. In addition, the prominence tone metrics show a higher correlation with the mean mental workload index while the correlation coefficient increases when task difficulty is raised. However, the tonality metrics such as the prominence ratio, tone to noise ratio, and tonal audibility show no statistical correlation with the task load index mean.
Table 6.
Correlation analysis of noise metrics against subjective responses and n-back task performance
| Metrics Param. | N5 | LN5 | PNL5 | R5 | S5 | F5 | dBA | TNR5 | PR | ΔLta | PNLT5 | TdBa-JNM | SQI |
|---|---|---|---|---|---|---|---|---|---|---|---|---|---|
| All signals | |||||||||||||
| Loudness | 0.864** | 0.872** | 0.871** | 0.877** | 0.727 | 0.853** | 0.806** | −0.124 | 0.149 | 0.008 | 0.865** | 0.819** | 0.697 |
| Annoyance | 0.870*** | 0.865** | 0.867** | 0.866** | 0.723 | 0.846** | 0.868** | −0.017 | 0.188 | 0.063 | 0.860** | 0.809** | 0.690 |
| TLX-avg -LDL | 0.448 | 0.445 | 0.427 | 0.451 | 0.510 | 0.467 | 0.766** | −0.148 | 0.123 | 0.015 | 0.436 | 0.487 | 0.378 |
| TLX-avg -MDL | 0.528 | 0.523 | 0.519 | 0.533 | 0.577 | 0.528 | 0.811** | −0.111 | 0.141 | 0.009 | 0.521 | 0.562 | 0.445 |
| TLX-avg -HDL | 0.643 | 0.643 | 0.635 | 0.642 | 0.658 | 0.636 | 0.863** | −0.094 | 0.152 | 0.02 | 0.637 | 0.678 | 0.541 |
| TLX-avg -Total | 0.339 | 0.337 | 0.331 | 0.341 | 0.368 | 0.344 | 0.73 | −0.011 | 0.139 | 0.011 | 0.334 | 0.364 | 0.290 |
| 40 dBA background noise level | |||||||||||||
| Loudness | 0.906** | 0.912** | 0.918** | 0.915** | 0.607 | 0.831** | 0.806** | 0.785 | 0.795 | 0.785 | 0.903** | 0.828** | 0.73 |
| Annoyance | 0.910** | 0.916** | 0.923** | 0.918** | 0.614 | 0.836** | 0.868** | 0.863** | 0.873 | 0.905** | 0.905** | 0.829** | 0.74 |
| TLX-avg -LDL | 0.377 | 0.364 | 0.359 | 0.368 | 0.443 | 0.430 | 0.766** | 0.515 | 0.535* | 0.580* | 0.380 | 0.505 | 0.34 |
| TLX-avg -MDL | 0.508 | 0.504 | 0.500 | 0.505 | 0.559 | 0.526 | 0.811** | 0.626* | 0.636* | 0.715** | 0.524 | 0.577 | 0.42 |
| TLX-avg -HDL | 0.647* | 0.634* | 0.631* | 0.640* | 0.621* | 0.633* | 0.863** | 0.78** | 0.785** | 0.815** | 0.654* | 0.697* | 0.51 |
| TLX-avg -Total | 0.28 | 0.33 | 0.32 | 0.32 | 0.35 | 0.34 | 0.754** | 0.625* | 0.611* | 0.698* | 0.33 | 0.38 | 0.28 |
| 55 dBA background noise level | |||||||||||||
| Loudness | 0.838** | 0.842** | 0.851** | 0.877** | 0.812** | 0.891** | 0.71* | 0.709* | 0.777* | 0.787* | 0.839** | 0.847** | 0.69 |
| Annoyance | 0.840** | 0.845** | 0.836** | 0.857** | 0.796* | 0.872** | 0.75* | 0.846** | 0.866** | 0.890** | 0.820** | 0.837** | 0.68 |
| TLX-avg -LDL | 0.477 | 0.471 | 0.487 | 0.503 | 0.568 | 0.492 | 0.512 | 0.615* | 0.615* | 0.677* | 0.498 | 0.488 | 0.44 |
| TLX-avg -MDL | 0.500 | 0.498 | 0.531 | 0.532 | 0.589 | 0.517 | 0.54 | 0.745** | 0.645* | 0.728** | 0.523 | 0.551 | 0.48 |
| TLX-avg -HDL | 0.622 | 0.621 | 0.637 | 0.627 | 0.676 | 0.624 | 0.58 | 0.845 | 0.758** | 0.82 | 0.628 | 0.663 | 0.56 |
| TLX-avg -Total | 0.33 | 0.33 | 0.35 | 0.35 | 0.38 | 0.34 | 0.499 | 0.723** | 0.634* | 0.731** | 0.35 | 0.35 | 0.31 |
N5: Loudness exceeded 5% of the time, LN5: Level Loudness, R5: Roughness exceeded 5% of the time, S5: Sharpness exceeded 5% of the time, F5: Fluctuation Strength exceeded 5% of the time, dBA: A-weighted Sound Pressure Level, PNL5: Perceived Noise Level, PNLT5: Tone-corrected Perceived Noise Level, TNR5: Tone-To-Noise Ratio exceeded 5% of the time, PR: Prominence Ratio, ΔLta: Tonal Audibility, TdBA- JNM: Joint Nordic Method based Tone-corrected Average A-weighted, SQI: Sound Quality Index, TLX-avg: the average value of the responses to all five questions on the modified task load index questionnaire for different level of n-back tests and conditions
*Correlation is considered significant at the 0.05 level (2-tailed)
**Correlation is considered significant at the 0.01 level (2-tailed)
In terms of evaluation, the relationship between noise metrics and subjective perception of loudness, annoyance, and the task load index for noises in two distinct groups (based on noise pressure levels) showed that tonality metrics were correlated with the general conditions under which noise was evaluated. In addition, correlation between tonality metrics and the mean of task load index increased significantly and became even stronger at higher task difficulty levels. The results showed that when the background noise levels are controlled or comparable, tonality becomes a more important factor in annoyance evaluation. On the other hand, tonality metrics showed a correlation with subjective perception of task load index when separate evaluation of noise based on pressure levels is considered, though this.
The performance of combined indices such as JNM, PNL, and SQI showed a meaningful relationship with subjective perception of annoyance, though they do not have any considerable performance advantage as compared to other metrics. They did however show a significant relationship with the task load index but the correlation coefficients were not high. Furthermore, the correlation coefficients decreased as the difficulty level was lowered and was even lower in general difficulty conditions. The results suggest that the tonality and loudness of building mechanical equipment must be considered as separate criterions. Merely reducing allowed loudness levels based on tone index is not the only way to improve overall understanding of subjective annoyance.
Neural network models for noise annoyance
The results of this study and similar studies elsewhere show that an acceptable correlation exists between noise metrics and annoyance, although this correlation is stronger for certain metrics than others. The aim of this study was to explore the feasibility of using neural networks to identify noise annoyance. For this purpose, 36 test signals were generated, of which, 18 was used in the before stages of the study, and 18 were generated with tone level 1, 3, 7 at the same tone frequency and background noise level (the results of a previous experiment using 18 other signals were used also). The annoyance reactions of 60 subjects while exposed to 36 tonal signals were investigated in order to determine the feasibility and accuracy of neural network in identifying noise annoyance. In order to determine influential metrics in the prediction of perceived annoyance, 3 neural network models were built with different noise metric inputs. These inputs were chosen from among those metrics that had the highest correlation with subjective annoyance from Table 6. Selection was made from 3 evaluation conditions of general exposure and also separate noise evaluations with a background noise pressure index of 40 and 55 dB.
The correlation between noise metrics and perceived annoyance were also examined. For model 1, the noise metrics, which had the highest correlation with annoyance perception in the general evaluation conditions were selected. For models 2 and 3, the metrics which had the highest correlation coefficient in separate evaluations of noise at 40 dB and 55 dB were selected as input parameters of the neural network models. First, the data was normalized between −1 and 1 due to the different values of the input variables. The KMO values obtained for the sample sufficiency of all three models were more than 0.799.
Network training was conducted using the MATLAB software. For the purpose of training and testing, 30 and 6 of the total test signals were considered. For each network with n number of signals, the dimensions of the input matrix can be extended to “number of input variables × n”. Considering 30 signals for training, n = 30. For each model, the output layer with one neuron was the rating score for the perceived annoyance. For each model, the output matrix for the training of the neural network was 1 × 30. After determining the input parameters, three models for predicting noise annoyance perception were made, each with three layers that contain a hidden layer while the number of neurons was determined by trial and error. The nonlinear transfer function tanh was selected since this function generates an output between −1 and 1 for the received input in the interval (−inf, inf). Initialization of weights and biases was performed using the Nguyen-Widrow (“NEWFF”) method. The GDM learning algorithm was used because of its faster convergence. By adding a Momentum parameter enabled the responding to slope changes and error-level variations. The back-propagation algorithm was used to learn the networks’ weights. In this experiment, each neural network model was developed for assessing parameters of model structures while considering the number of hidden layers and hidden nodes. The specifications of all three models are presented in Table 7. An input matrix m × n was defined and used to train each network where n is the number of samples and m is the number of input parameters as bellow:
Table 7.
BP neural network models for annoyance evaluation
| Prediction models | The network structure | Results | ||||
|---|---|---|---|---|---|---|
| Input parameters | Output parameter | Hidden layer and node | MSE | Accuracy | ||
| Training | Validation | |||||
| Model 1 | N5, LN5, R5, PNL5, ΔLta | Perceived annoyance prediction | 1, 8 | 0.057 | 0.061 | 0.901 |
| Model 2 | N5, LN5, R5, PNL5, JNM, PNLT5 | 1, 11 | 0.062 | 0.064 | 0.891 | |
| Model 3 | N5, LN5, R5, PNL5, F5, PNLT5, JNM, ΔLta | 1, 12 | 0.063 | 0.075 | 0.885 | |
The prediction accuracy of the models was determined using the mean-square error (MSE). MSE measures the difference between the network’s outputs and the desired outputs. After training was done for three models, the variables in the annoyance models were finally determined. The training and testing results of the three models are shown in Fig. 3. As can be seen from the 214, 165 and the 159 training epochs, the mean-squared error approached and finally reached the preset values of 0.057, 0.062 and 0.063 for models 1, 2, and 3 respectively. All three neural network models have a fast convergence speed and show good stability. There was no significant difference between the three models. The accuracy of the three models stood between 0.88 and 0.901. Accuracy did not show any significant difference either (Fig. 4). Model 1 was preferred in some respects because of its lower MSE, higher accuracy and fewer input variables which makes it more user-friendly.
Fig. 3.

Training and testing performance for three models
Fig. 4.

Accuracy of three models
The k-fold cross validation method is used to assess the simulation accuracy of the three neural network models. For each model, the training data was randomly partitioned into 5 equal sized subsamples (5 test signals). From the 5 subsamples, a single subsample was retained as the validation data for investigating the model while the remaining 4 subsamples were used as training data. The process was repeated 5 times for each model and the average determined the validation of the model. The error percentages of the 5 repetitions for each model were below 10%, which implies good accuracy for the three models in annoyance prediction (Table 7). Instead of the subjective evaluation methods, neural network models can be directly used for estimating noise annoyance.
The results of the study show that the accuracy of model 1 is higher than models 2 and 3. This is probably due to the fact that only the factors that have a higher relation with the output are subsequently selected as input variables. This cannot be considered a significant advantage for the very limited selection of neural network modeling [44] .On the other hand, the accuracy of the three models was high, which may be due to the fact that the role of acoustic factors on annoyance are more pronounced while the various non-acoustic factors, such as personal experiences and other social and cultural factors, are less effective. Although various studies have considered annoyance as being influenced by acoustic and non-acoustic factors, the effect of these factors will be different in comparison to annoyance [5, 46]. Therefore, in order to accurately predict noise annoyance, not only acoustic factors, but also non-acoustic factors must be considered, even though the effect of the latter is less.
The evaluation of the importance variables shows loudness and tonal audibility as being the most important predictors and JNM and PNLT5 metrics as being the least important predictors. In addition, the results of the models showed that the tonal and loudness metrics such as audible tone, loudness, loudness level, and perceived noise level, as well as the psychoacoustical parameter roughness are acceptable predictive parameters for perceived annoyance and their use has a noticeable effect on the change in accuracy and MSE. On the other hand, the JNM and PNLT metrics were not that important of a predictor such that using them as inputs for the model did not affect accuracy or MSE.
The results showed that neural networks can be used to identify the perceived annoyance of noises. Loudness metrics, tonality, combined and psychoacoustical parameters were used as the input parameters for the models. Results of the study also show that for annoyance prediction, the MSE of model 1 is lower than those of models 2 and 3. This is probably because of the importance of input features, loudness and tonal audibility since they are the strongest predictor while JNM and PNLT5 metrics were the weakest predictor for annoyance prediction. This results in an excessively narrow selection such that the advantages for neural network models cannot be considered as significant [44]. Model 1 will probably be more user-friendly with fewer input variables than the other two.
Although there are previous studies that consider noise metrics and their correlation with perceived annoyance, modeling them using a neural network for annoyance prediction provide a more accurate evaluation regarding the relationship between noise metrics and perceived annoyance.
Summary and conclusion
The present study aims to investigate the effects of noise signals with various levels of prominence tones on subjective perceived annoyance and performance at different levels of task difficulty. The development of an annoyance predictive model using current noise metrics and psychoacoustical parameters was also attempted. In terms of exposure to noise signals, the participants performed n-back task with three levels of difficulty and then their overall mental workload was evaluated. Significant differences were observed regarding performance parameters (accuracy and number of misses) while exposed to tonal signals, however, reaction times did not show any significant differences.
The linear mixed model analysis for different levels of difficulty regarding mental workload parameters and TLX-avg showed a significant difference, but no significant difference in annoyance and loudness perception was observed. The responses of mental workload dimensions including mental demand, performance, and effort showed a significant relationship with the subjective perception of annoyance and loudness. In other words, the higher the difficulty level was, the more effort was needed to maintain performance. This is why mental demand and efforts increased when the intensity of mental workload was raised. Although there was an increase in task difficulty along with increasing annoyance and loudness, there was no statistically significant relationship observed.
The linear mixed model analysis showed that the participants had a higher perception of annoyance and loudness when the tone and frequency was increased. Noise metric correlation analysis and levels of subjective perception showed that there was a significantly stronger correlation between loudness metric, perceived noise levels, and perceived annoyance while tonality metrics and psychoacoustical parameters showed a lower correlation.
Three neural network models were presented to predict annoyance and noise metrics while noise metrics that were highly correlated with mental annoyance were determined as the inputs of the models. The results showed that neural networks can be used to identify the perceived annoyance of noises. Accuracy for all three suggested annoyance models was higher than 0.88, and no significant differences were observed between them. Model 1 will probably be more user-friendly with fewer input variables than the other two. In addition to the loudness metrics, tonality and psychoacoustical parameters were used as input parameters for the models. It seems that using the JNM combined metric had no effect on the improvement of the predictive capacity of the model while the tonality and loudness metrics including tonal audibility, loudness, loudness level, perceived noise level, and the psychoacoustical parameter of roughness were better for predicting annoyance perception.
Among the positive aspects of this study is the use of linear mixed models since the design of the study is unbalanced and using these models improves the evaluation of the results considerably. Another positive aspect is the use of neural network models which, considering the nonlinear relationships between the variables affecting perceived annoyance, will promote a better understanding of these relationships. The current study also helps better understand the effects of tonal noise on annoyance and task performance under varying levels of difficulty. Among the limitations of this study is the conducting of the experiment in laboratory settings. In real world situations there are many different parameters affecting annoyance and performance and due to limitations, not all of them can be monitored. Thus, the model presented cannot be used in the real world and therefore more studies are required in the future. Another limitation of this study is the limited number of conditions and difficulty levels which, in future studies can be expanded to enable a more accurate evaluation of the effect of experimental conditions on annoyance and performance and also provide a more accurate model.
Acknowledgments
The authors of this study would like to thank the Environmental and Occupational Hazard Control Research Center at the Shahid Beheshti University of Medical Sciences for funding and support provided for this research (Grant No. 12957).
Compliance with ethical standards
Conflict of interest declaration
The authors wish to declare that there are no conflicts of interest that they are aware of.
Statement on ethical approval
This research was approved in the eighteenth research ethical committee of the Shahid Beheshti University of Medical Sciences No. “IR.SBMU.PHNS.REC.1396.95.”. This is a research article involving “human participants” with “informed consent”.
Footnotes
The original text of this article was revised
Publisher’s note
Springer Nature remains neutral with regard to jurisdictional claims in published maps and institutional affiliations.
Change history
6/25/2019
The correct first names and last names are “Mohammad Javad Jafari”, “Marzieh Sadeghian”, “Ali Khavanin”, “Soheila Khodakarim”, “Amir Salar Jafarpisheh”.
Change history
6/25/2019
The correct first names and last names are ���Mohammad Javad Jafari���, ���Marzieh Sadeghian���, ���Ali Khavanin���, ���Soheila Khodakarim���, ���Amir Salar Jafarpisheh���.
References
- 1.Wang R, Zhang Y, Zhang L. An adaptive neural network approach for operator functional state prediction using psychophysiological data. Integr Comput Aided Eng. 2015;23:81–97. doi: 10.3233/ICA-150502. [DOI] [Google Scholar]
- 2.Francis JM, Lee J, Wang LM, et al. Determining Annoyance Thresholds of Tones in Noise Determining Annoyance Thresholds of Tones in Noise 10.1121/1.4831499.
- 3.Lee J, Wang LM. Understanding Annoyance Perception of Noise With Tones Through Multidimensional Scaling Analysis 2015; 12–16.
- 4.ISO. “ISO/TS 15666:2003 Acoustics - Assessment of Noise Annoyance by Means of Social and Socio Acoustic Surveys.” 2003.
- 5.Marquis-Favre C, Premat E, Aubrée D. Noise and its effects--a review on qualitative aspects of sound. Part II: noise and annoyance. Acta Acust united with Acust. 2005;91:626–642. [Google Scholar]
- 6.Ryherd R, Erica E, Wang LM. AB-10-018: the effects of noise from building mechanical systems with tonal components on human performance and perception (1322-RP) ASHRAE Trans. 2010;124:218–226. doi: 10.1121/1.2932075. [DOI] [Google Scholar]
- 7.Seattle. Seattle Municipal Code Chapter 25.08 Noise Control. 2007.
- 8.Los Angeles County, Ca. Noise control ordinance of the county of Los Angeles. 1978.
- 9.New York. N.Y. ADC. LAW } 27–770 : NY code – Section 27–770, “Noise Control of Mechanical Equipment”.2006.
- 10.Little JW. Human response to jet engine noises. Noise Control. 1961;7:11–13. doi: 10.1121/1.2369442. [DOI] [Google Scholar]
- 11.Kryter KD. The meaning and measurement of perceived noise level. Noise Control ASA. 1960;6(5):12–27. doi: 10.1121/1.2369442. [DOI] [Google Scholar]
- 12.Hellman, R. P. “Perceived magnitude of two-tone-noise complexes: loudness, annoyance, and noisiness”, J Acoust Soc Am (1985): vol 77, no 4, bll 1497–1504. 10.1121/1.392044 [DOI] [PubMed]
- 13.Hellman RP. Growth rate of loudness, annoyance, and noisiness as a function of tone location within the noise Spectrum. J Acoust Soc Am. 1984;75(1):209–218. doi: 10.1121/1.390397. [DOI] [PubMed] [Google Scholar]
- 14.More S, Davies P. (). Human responses to the tonalness of aircraft noise. Noise Control Engineering Journal. 2010;58(4):420–440. doi: 10.3397/1.3475528. [DOI] [Google Scholar]
- 15.Balant AC, Hellweg RD, Jr, Nobile M. A comparison of two methods for the evaluation of prominent discrete tones: phase 3. J Acoust Soc Am. 2000;108(5):24742474. doi: 10.1121/1.4743122. [DOI] [Google Scholar]
- 16.Ryherd E, Wang LM. Implications of Human Performance and Perception under Tonal Noise Conditions on Indoor Noise Criteria. J Acoust Soc Am. 2008;124.1:218–226. doi: 10.1121/1.2932075. [DOI] [PubMed] [Google Scholar]
- 17.Wang LM, Bowden EE. Performance review of indoor noise criteria. Archit Eng. 2003:1–4. 10.1061/40699(2003)2.
- 18.Bowden EE, Wang LM. Relating human productivity and annoyance to indoor noise criteria systems: a low frequency analysis. ASHRAE Trans. 2005;111:684. doi: 10.1121/1.4779958. [DOI] [Google Scholar]
- 19.LandstrÖm, U., إKerlund, E., Kjellberg, A., & Tesarz, M. Exposure levels, tonal components, and noise annoyance in working environments. Environ Int, (1995): 21(3), 265–275. 10.1016/01604120(95)00017-F.
- 20.Lee J, Francis JM, Wang LM. How tonality and loudness of noise relate to annoyance and task performance. Noise Control Engineering Journal. 2017;65(2):71–82. doi: 10.3397/1/37642. [DOI] [Google Scholar]
- 21.Holmberg K, Landstrom U, Kjellberg A. Effects of ventilation noise due to frequency characteristic and sound level. Journal of Low Frequency Noise, Vibration and Active Control. 1993;12(4):115–122. doi: 10.1177/026309239301200401. [DOI] [Google Scholar]
- 22.Laird D. The influence of noise on production and fatigue, as related to pitch, sensation level, and steadiness of the noise. J Appl Psychol. 1933;17(3):320–330. doi: 10.1037/h0072423. [DOI] [Google Scholar]
- 23.Grjmaldi JV. Sensori-motor performance under varying noise conditions. Ergonomics. 1958;2(1):34–43. doi: 10.1080/00140135808930400. [DOI] [Google Scholar]
- 24.Robinson OJ, Vytal K, Cornwell BR, Grillon C. The impact of anxiety upon cognition: perspectives from human threat of shock studies. Front Hum Neurosci. 2013;7(May):1–21. doi: 10.3389/fnhum.2013.00203. [DOI] [PMC free article] [PubMed] [Google Scholar]
- 25.Patel N, Vytal K, Pavletic N, Stoodley C, Pine DS, Grillon C, Ernst M. Interaction of threat and verbal working memory in adolescents. Psychophysiology. 2016;53(4):518–526. doi: 10.1111/psyp.12582. [DOI] [PMC free article] [PubMed] [Google Scholar]
- 26.Hu K, Bauer A, Padmala S, Pessoa L. Threat of bodily harm has opposing effects on cognition. Emotion. 2012;12(1):28–32. doi: 10.1037/a0024345. [DOI] [PMC free article] [PubMed] [Google Scholar]
- 27.Zwicker, E., and Fastl, H. Psychoacoustics: Facts and models. Springer Science & Business Media. (1995).
- 28.W. Wildman, U. model of psychoacoustic strength of sounds and its application Practice, the noise assessment. Dissertation, TU Munchen. (1992).
- 29.Yang M, Kang J. Psychoacoustical evaluation of natural and urban sounds in soundscapes. J Acoust Soc Am. 2013;134(1):840–851. doi: 10.1121/1.4807800. [DOI] [PubMed] [Google Scholar]
- 30.N. Genaro, A. Torija, A. Ramos-Ridao, I. Requena, D. P. Ruiz, En M. Zamorano, “A neural network based model for urban noise prediction”, J Acoust Soc Am (2010): vol 128, no 4, bll 1738–1746. 10.1121/1.3473692 v. [DOI] [PubMed]
- 31.American National Standard Measurement of Sound Pressure Levels in Air, American National Standards Institute ANSI S1.13–1995, (Acoustical Society of America, New York, 10005–3993).
- 32.Federal Aviation Regulations, Part 36 Appendix A, Federal Aviation Administration (1978).
- 33.Federal Aviation Regulations, Part 36 Appendix B, Federal Aviation Administration (1996).
- 34.Federal Aviation Regulations, Part 36 Appendix B, Federal Aviation Administration (1996).
- 35.E RW, Blazier J. Revised noise criteria for design and rating of HVAC systems. Noise Control Eng J. 1981;16:64–73. doi: 10.3397/1.2832172. [DOI] [Google Scholar]
- 36.ANSI/ASA. “ANSI/ASA S12.10–2010/Part 1 Acoustics – Measurement of Airborne Noise Emitted by Information Technology and Telecommunications Equipment – Part 1 : Determination of Sound Power Level and Emission Sound Pressure Level.” (2010).
- 37.Pedersen TH, Søndergaard M, Andersen B. Objective method for assessing the audibility of tones in noise joint Nordic method--version 2. DELTA. 2000;2000:4–14. [Google Scholar]
- 38.Federal Aviation Administration. Part 36. Noise Standards: Aircraft Type and Airworthiness Certification.
- 39.ANSI. “ANSI S3.4–2007 Procedure for the Computation of Loudness of Steady Sounds.” 2007.
- 40.ISO. “ISO 1996-2:2007 Acoustics -- Description, Measurement and Assessment of Environmental Noise -- Part 2: Determination of Environmental Noise Levels.” 2007.
- 41.AHRI. “AHRI/ANSI 1140–2012: Sound Quality Evaluation Procedures for Air Conditioning and Refrigeration Equipment.”(2012).
- 42.Schutte M, Marks A, Wenning E, Griefahn B, others The development of the noise sensitivity questionnaire. Noise and Health. 2007;9(34):15. doi: 10.4103/1463-1741.34700. [DOI] [PubMed] [Google Scholar]
- 43.Mandrick K, Peysakhovich V, Rémy F, Lepron E, Causse M. Neural and psychophysiological correlates of human performance under stress and high mental workload. Biol Psychol. 2016;121:62–73. doi: 10.1016/j.biopsycho.2016.10.002. [DOI] [PubMed] [Google Scholar]
- 44.Yu L, Kang J. Modeling subjective evaluation of soundscape quality in urban open spaces: an artificial neural network approach. J Acoust Soc Am. 2009;126(3):1163–1174. doi: 10.1121/1.3183377. [DOI] [PubMed] [Google Scholar]