Abstract
Background
Gastric cancer (GC) is the first leading cause of cancer-related deaths in Iran. GC is a multifactorial disease and is caused by the interaction of genetic and environmental factors. The aim of this study was to assess the exposure and risk of nitrate intake through fruits and vegetables (F&V) in high-risk area (HRA) and low-risk area (LRA) of GC in Iran.
Methods
Twenty nine species of F&V were examined for nitrate by reverse-phase HPLC (RP-HPLC) method. Food frequency questionnaire (FFQ) data of 2000 adults participating in Persian cohort were applied to determine consumption patterns of F&V in those areas. A point-estimate daily intake was applied to compare two areas in terms of nitrate intake. Monte-Carlo simulation technique was applied to estimate chronic daily intake (CDI) of nitrate.
Results
The results showed that point-estimate daily intake of nitrate for subjects participated in the study was 2.02 ± 1.02 mg kg−1 day−1 in HRA and 1.98 ± 1.05 mg kg−1 day−1 in LRA. 6.53% of the participants in the HRA, and 5.9% of the participants in the LRA had an unacceptable point-estimate daily intake compared with an acceptable limit of 3.7 mg kg−1 day−1 established by FAO/WHO. CDI of nitrate in HRA was 1.94 ± 0.95 mg kg−1 day−1 and in the LRA was 1.93 ± 1.06 mg kg−1 day−1.
Conclusion
The results showed that there is no difference between HRA and LRA in terms of nitrate intake through F&V.
Keywords: Nitrate, Fruits, Vegetables, Gastric Cancer, Exposure assessment
Introduction
Nitrate is a typical compound in the environment and constitutes paramount part of a nitrogen cycle. Nitrates can enter the food products through different pathways including soil, water resources, chemical fertilizer and food additives and consequently affect the food chain of human [1]. Vegetables, fruits, processed meats and drinking water are extensively considered as the main sources of nitrate context to the human body [2, 3]. However, vegetables, especially leafy vegetables comprise the higher contribution (more than 80%) [4–6] of human exposure to nitrate compared to other nitrate sources [7]. High content of nitrate in vegetables have been reported in different countries [8]. Nowadays, chemical and animal fertilizers containing a high concentration level of nitrate are being increased all over the world, which consequently exacerbate the human exposure to nitrate through vegetables and agricultural products [9].
F&V take advantage of high levels of important nutrients such as vitamins, minerals and antioxidants [10]. In addition, previous studies have reported that F&V consumption is inversely related to obesity, diabetes and hypertension [11]. Therefore, the consumption of vegetables is considered as part of a healthy diet of individuals [12]. However, high levels of nitrate in vegetables have raised concerns about these food items. Although nitrates with a concentration lower than permissible are not considered as a toxic compound and promote immune system of the body, secondary nitrate products such as nitrite, nitric acid and nitrosamine compounds may induce adverse health effects like methaemoglobinaemia and cancer [1, 13].
Nitrate reduction to nitrite is taken place in the human body. Nitrite is metabolized and produce nitric oxide nitrosing amines and amides to nitrosamine and nitrosamide compounds [14–16]. Nitrosamine compounds have been reported to be carcinogenic for some animal organs [17]. Additionally, some nitrosamine compounds are categorized by the International Agency for Research on Cancer (IARC) as probable carcinogens (group 2A) for humans [18, 19]. The findings of the studies focusing on the association between nitrates intake and various cancers such as the brain, esophagus, stomach and colorectal are unclear [1]. However, it is suggested that high levels of nitrate intake from food can be taken into consideration as a pivotal risk factor in the development of certain cancers [7]. Secondary nitrate products threaten gastric more than other organs [2]. Some studies have evidenced a positive correlation between nitrate consumption and GC in humans [20, 21] and high nitrate intake has been reported to be associated with GC in different countries worldwide [2].
Iran is considered as an area with high risk of GC. There is a geographically large difference in terms of mortality rate attributable with GC in Iran [3, 22, 23]; in the northern parts, especially in the northwest of Iran, the prevalence of GC is significantly higher compared to southern parts [24, 25]. The areas with the highest risk of GC in Iran (especially Ardabil province and East Azerbaijan) have the same geographical circumstances to countries of Costa Rica, Chile and Japan as countries with a high prevalence of GC. The areas with a high risk of GC in these countries and Iran are highlands and located mostly in the vicinity of silent volcanoes and the most common feature of these regions is the volcanic nitrous soils [26, 27], which can cause high nitrate and nitrite content of water and crops. Therefore, high nitrate intake may be a potential risk factor for the high incidence of GC in some regions of Iran and other countries.
Although there are some studies on nitrate intake and risk of GC, the results reported are contradictory. In the most studies [12], the amount of nitrate received is determined by the FFQ and the nutritional data table. Since the nutritional values of foods and agricultural crops in each region can be attributed to cultivation conditions, weather condition, the type of water used for irrigation and the type and amount of agricultural fertilizer applied for soil modification [9], the pre-determined table of nutritional values cannot precisely determine the nitrate content of the food items. Therefore, a specific-site nitrate intake calculation is suggested to best determine the human exposure to nitrate.
This comparative study was developed to investigate exposure to nitrate through F&V in two areas of Iran with high and low risk of GC. The additional aims of the present research were to evaluate acute and chronic nitrate exposure and assessment of the corresponding risk.
Materials and methods
Study areas
To compare high and low risk areas for GC in terms of nitrate intake, two cities of Ardabil and Shiraz were selected. Ardabil is the capital of Ardabil province as a high-risk area (HRA) of GC (49 in 100,000 for men and 25 in 100,000 for women) [23] and Shiraz is the capital of Fars province as a low-risk area (LRA) of GC (12.21 per 100,000 for men and 7.01 per 100,000 for women) [28] in Iran.
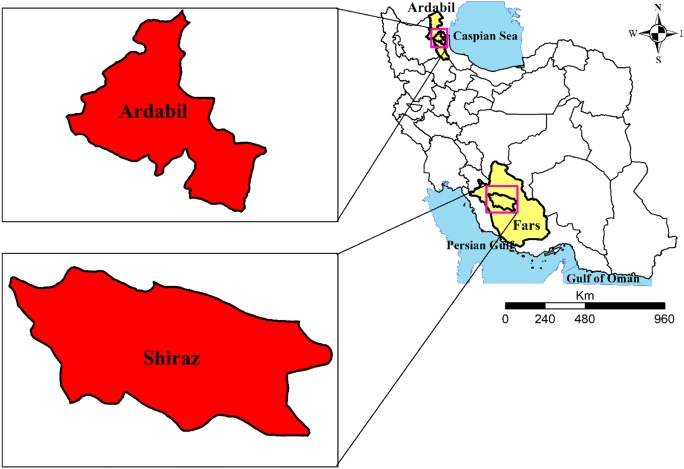
Fars is one of the southern provinces of Iran with mountainous, temperate and warm climate in different regions. In the 2016 census, the population of Fars province was approximately 4,850,000. The capital of this province is Shiraz and placed on a height of 1480–1670 m above sea level. This city is surrounded by Zagros Mountains with temperate climate (Longitude: 38 14 ‘58’, Latitude: 48 18′ 05 “). However, Ardabil province is placed in the northwest of Iran’s plateau with cold winters and mild summers. According to the 2016 census, Ardabil had a population of 127,000. The capital of this province is Ardabil and which is located at an elevation of 1500 m above sea level and in latitude 38 14 ‘58’ ‘and longitude 48 18′ 05 “. The locations of study areas are shown in Fig. 1.
Fig. 1.
Geographic locations of study areas
Fruits and vegetables (F&V) consumption data
Food frequency questionnaire (FFQ) data of subject participating in Persian cohort were applied to determine the consumption pattern of F&V in HRA and LRA. Persian cohort has started in Iran since 2014 and is ongoing in 17 cities of Iran. The Persian cohort aims to collect data from 170,000 people throughout the country. In the study of Persian cohort, data of F&V consumption are collected by face to face interview method. In the present study, data from 2000 individuals participating in the Persians cohort in two cities of Ardabil (1000 participants) and Kharamah (1000 participants), a city close to Shiraz, were used. Of note, individuals were randomly selected from the database. The participants filled out informed consent form before participation in the study. The study protocol of Persian cohort was reviewed and approved by the Ethics Committee of Digestive Disease Research Center of Tehran University of Medical Sciences (IR.TUMS.DDRI.REC.1396.1)
F&V sampling
F&V samples were bought from at least five local markets (hub), supermarkets, and large grocery stores uniformly distributed throughout the city. Sampling was taken in two autumn and winter seasons (2017–2018). Six types of fruits (orange, banana, apple, kiwi, watermelon and melon) and 23 types of vegetable (spinach, eggplant, pepper, coriander, tomato, carrot, parsley, zucchini, lettuce, cabbage, celery, cucumber, mint, onion, scallion, basil, cress, dill, potato, garlic, leek, radish, tarragon) were selected and sampled. Taken together, 29 species of F&V were sampled. F&V were chosen based on two assumptions: have high consumptions among Iranians and their nitrate content is likely to be high. The samples were placed in a plastic bag and transferred to the laboratory after labeling. The samples kept at a temperature below 4 °C until further analysis.
Sample preparation and extraction
Sample preparation and extraction were conducted according to the method developed by Hongsibsong et al. [29]. Firstly, the non-edible parts of the F&V were separated and then the rest was washed with distilled water. Afterward, washed parts were dried using a tissue paper in the ambient air. The foods which are typically consumed as cooked (potatoes, spinach, celery, coriander and dill) were boiled with distilled water for 30 min. F&V samples were then shredded and homogenized using a mixer and kept at −20 °C until extraction. For the extraction of nitrate, 50 ml of distilled water was added to 1 g of prepared F&V and then mixed for 15 min at a temperature of 70–80 °C. After mixing, the samples were cooled at ambient temperature and their volumes were adjusted to 100 ml using distilled water. Finally, 10 ml of the sample was filtered using a 0. 45 μ filter before being injected into the HPLC device. The first three milliliters of the filtered sample were discarded and the rest was stored for injection. The injection was performed immediately after extraction, otherwise the extract was kept at −20 °C until injection.
Analytical procedure and quality control
Nitrate was measured using HPLC device (KNAUER) with UV detector (UV-Detector-K2500). The separation was performed on a C18 column (C18, MZ, ODS-3, 5 um) with a mobile phase containing methanol (30%), distilled water (70%) and Octylamine (0.01 M). pH of mobile phase was adjusted at 7 using phosphoric acid. The mobile phase was freshly prepared and used. The measurements were conducted at a wavelength of 213 nm and at 25 °C. The injection volume was 20 μL. Five concentrations of 0.1, 1, 10, 50, and 100 mg/l of nitrate were used to develop calibration curve. At the end of analysis, HPLC column was regenerated using 50% (v/v) solution of methanol and water at a flow rate of 0.5 ml min−1 overnight. This method has been previously developed by Chou et al. [30].
The method was validated using limit of detection (LOD), limit of quantification (LOQ), and relative standard deviation (RSD). LOD and LOQ were determined using the blank method. In this sense, the concentrations of 10 Blank samples were measured in triplicate way and LOD and LOQ were calculated using the Eqs. 1 and 2 [31].
| 1 |
| 2 |
Where B is blank sample concentration.
To determine the RSD value as a repeatability index, three concentrations (10, 50 and 100 mg/L) of standard nitrate solutions were measured three times in three consecutive days, and RSD was determined using the following Eq. [6] .
| 3 |
where N is a total number of samples analyzed, Xi denotes a concentration of samples, and is a mean concentration of samples.
Daily exposure assessment
To calculate point-estimate daily intake of nitrate via F&V, firstly, the average nitrate content of each aforementioned F&V was multiplied by its per capita daily consumption to obtain intake from each F&V. The total daily intake per person was determined by summing the intakes from all F&V. Then, point-estimate daily intake was computed through dividing the total daily intake by body weight (Eq. 4) [32].
| 4 |
where Ci is the nitrate content (mg/g) of the fruit or vegetable i and IRi is ingestion rate (g/day) of fruit or vegetable i, and BW is the body weight. After calculating the individual daily intake, participants in LRA and LRA were divided into two groups, namely, acceptable and unacceptable daily intake according to acceptable daily intake (ADI) of 3.7 mg kg−1 set by FAO/WHO [33].
Lifetime exposure assessment to nitrate through F&V was carried out according to the proposed method by US.EPA [34]. For this purpose, chronic daily intake (CDI) of nitrate was determined according to the following equation [35].
| 5 |
where EF is exposure frequency, ED is the exposure duration (year), AT is averaging time (year×days), and BW is the body weight. The corresponding values of the parameters of the Eqs. (4, 5, 6) are presented in Table 1. The total CDI (CDIt) originated from all F&V was calculated according to the following equation [35].
| 6 |
Table 1.
Parameters applied to calculate CDI and HQ of nitrate intake via F&V using Monte-Carlo simulation technique
| Parameter | Area | Value | Distribution | Reference |
|---|---|---|---|---|
| Ingestion (g/d) | LRA | Table 3 | Log normal | This study |
| HRA | Table 3 | Log normal | This study | |
| Nitrate content (mg kg-1) | LRA | Table 4 | Log normal | This study |
| HRA | Table 4 | Log normal | This study | |
| Body weight (kg) | LRA | 69.68 ± 13.14 | Log normal | This study |
| HRA | 78.82 ± 12.86 | Log normal | This study | |
| Exposure duration (year) | HRA and LRA | 30 | NA | [34] |
| Exposure Frequency (day/year) | HRA and LRA | 350 | NA | [34] |
| Averaging time (day*year) | HRA and LRA | 30*365 | NA | [34] |
| RfD (mg NO3-N/kg.d) | HRA and LRA | 1.6 | NA | [36] |
NA: not applicable
Monte-Carlo simulation and sensitivity analysis
A Monte-Carlo simulation technique with 10,000 replicates was performed using Oracle Crystal ball software to ascertain the uncertainty and variability of the input parameters in CDI calculations. The Monte-Carlo technique selects the values of the parameters of distribution fitted with input data and consequently calculates the level of the risk. This process is repeated several times and calculates the average, minimum, maximum, standard deviation, percentiles and some other statistical indicators as the final results. Therefore, the results obtained from the Monte -Carlo simulation technique are more reliable and more valuable compared with point estimate method [37]. An uncertainty analysis based on Spearman rank-order correlation was employed to understand how uncertainty and variability of input parameters (body weight, F&V consumption, and nitrate content) can influence on CDI as response variable in the model.
Statistical analysis
Statistical analysis were implemented using SPSS software (version 13) and R software (version 3.1.3). The Shapiro test was applied to determine the normally distribution of the nitrate content of F&V and the nitrate intake of participants in the two areas. The matched-pairs Wilcoxon test was applied to compare the average nitrate content of F&V in two regions and the independent two-sample Wilcoxon test was applied to compare the mean daily nitrate intake of the two regions. χ2 statistical analysis was applied to compare two areas in terms of the number of subjects with unacceptable daily intake. The Spearman rank correlation test was applied to determine the contribution of input parameters to the uncertainty of CDI value obtained by Monte-Carlo simulation. Outlier data of F&V consumption rates and daily nitrate intakes were discarded using Z-score method. For this purpose, the Z value was firstly calculated by considering the average and standard deviation of the consumption rate and daily nitrate intake and the data whose z value was outside the range of −2 to 2 were excluded if there was enough justification. Ward hierarchical cluster analysis was used to categorize F&V in terms of their contribution to the total intake of nitrate and their consumption.
Results
Analytical method validation
The regression analysis of calibration curve indicated a good linear association over the concentration of 0.1–100 mg-NO3/L (R2 = 0.9976). LOD and LOQ of the method were found to be 0.068 mg/L and 0.155 mg/L, respectively. Relative standard deviation (RSD) was calculated to check the repeatability and reproducibility of the method. RSD for concentrations of 10, 50, and 100 mg-NO3/L were 10.45%, 9.26%, and 1.89%, respectively. Retention time was found to be 8.017 min.
Characteristics of study populations
To obtain the data associated with consumption rate of F&V so as to calculate nitrate intake in each region, 1000 individuals in HRA (Ardabil) and 1000 individuals in LRA (Fars) were randomly selected from the people participated in the Persians cohort. One person in the low-risk area and 6 people in the high-risk area were excluded due to lack of demographic or nutritional information. The age of the individuals included in the study were 52.02 ± 8.04 years and 48.84 ± 8.86 years in the LRA and HRA, respectively. The weight of participants was 69.68 ± 13.14 and 78.8 ± 12.85 kg in high and LRA, respectively. The demographic characteristics of the subjects included in the present study is presented in Table 2.
Table 2.
Demographic characteristics of participants in the study of food consumption pattern
| Characteristics | HRA | LRA |
|---|---|---|
| Total subjects | 1000 | 1000 |
| Male | 444 | 400 |
| Female | 556 | 600 |
| Age (year) | 48.84 ± 8.86 | 52.02 ± 8.04 |
| Body weight (kg) | 78.8 ± 12.85 | 69.68 ± 13.14 |
Consumption pattern of F&V
The amounts of F&V consumed by subjects in two areas are presented in Table 3. There was no detailed information on the consumption pattern of raw and vegetable components. Cooked vegetables include spinach, coriander, dill and raw vegetables include parsley, mint, radish, scallion, basil, cress, and tarragon. As can be seen from Table 3, Lettuce, tomatoes, cucumbers, eggplant, potatoes, onions, apples, melons and citrus are considered as high consumed items and celery, peppers, bananas, cooked vegetables, raw vegetables, cabbage and garlic are low consumed items in two areas.
Table 3.
The consumption rate of F&V (g day−1) consumed by individuals in HRA and LRA
| F&V | HRA | LRA | ||
|---|---|---|---|---|
| Mean (g day−1) | SD | Mean (g day−1) | SD | |
| Lettuce | 19.1 | 28.0 | 10.8 | 15.9 |
| Cabbage | 8.9 | 28.1 | 10.7 | 24.5 |
| Tomato | 158.6 | 142.7 | 114.0 | 96.5 |
| Cucumber | 63.5 | 60.8 | 101.0 | 99.7 |
| Raw Vegetables | 6.9 | 6.2 | 14.6 | 18.0 |
| Cooked Vegetables | 8.4 | 14.0 | 9.6 | 11.1 |
| Eggplant | 32.6 | 32.9 | 15.6 | 21.2 |
| Celery | 4.0 | 16.7 | 1.8 | 8.2 |
| Potato | 31.2 | 32.0 | 52.1 | 43.9 |
| Carrot | 18.2 | 29.9 | 20.2 | 30.1 |
| Garlic | 0.3 | 1.3 | 2.1 | 4.1 |
| Onion | 68.5 | 59.2 | 93.7 | 61.6 |
| Pepper | 9.4 | 15.1 | 6.5 | 11.1 |
| Zucchini | 15.7 | 20.0 | 16.5 | 35.4 |
| Melon | 25.5 | 42.3 | 18.1 | 26.9 |
| Watermelon | 70.9 | 104.2 | 70.6 | 98.2 |
| Apple | 96.8 | 110.3 | 125.7 | 125.6 |
| Kiwi | 21.4 | 35.7 | 11.6 | 26.2 |
| Orange | 51.6 | 68.4 | 62.4 | 79.0 |
| Banana | 5.7 | 10.0 | 10.9 | 16.2 |
In the LRA, the mean consumptions of lettuce (19 vs. 10 g day−1), tomato (158.68 vs. 114 g day−1), eggplant (32.6 vs. 15.6 g day−1), celery (4 vs. 1.8 g day−1) are higher and the average consumptions of cucumber (63.5 vs. 101 g day−1), carrots (18 vs. 30 g day−1), potatoes (31.2 vs. 1/52 g day−1) and apple (96/8 vs. 127/7 g day−1) are lower than LRA.
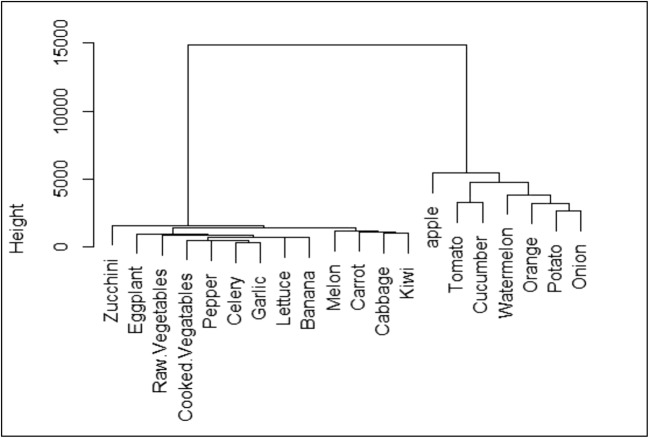
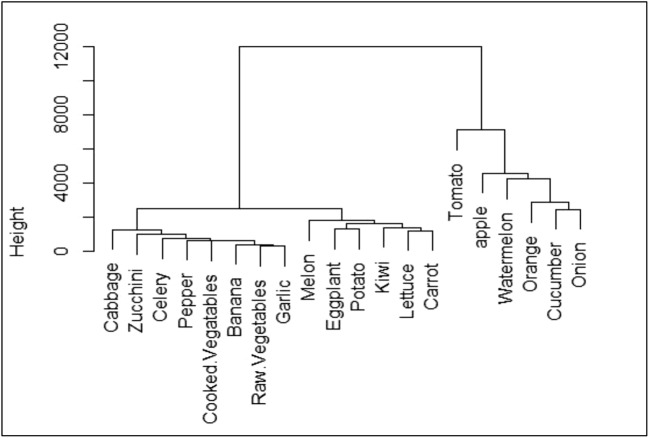
The clustering results of F&V consumption rate in HRA are shown in Fig. 2. As can be seen from this figure, F&V are categorized to two clear clusters. The first cluster includes onion, potato, orange, watermelon, cucumber, tomato, and apple. The second cluster includes zucchini, eggplant, raw vegetables, cooked vegetables, cabbage, pepper, celery, garlic, lettuce, banana, melon, carrot, cabbage, and kiwi. First and second clusters are comprise 75.4% and 24.6% of total F&V intake in HRA. Figure 3 shows clustering analysis of F&V consumption in LRA. In this area, there are three distinct clusters. Onion, cucumber, orange, watermelon, apple, and tomato are in the first group, carrot, lettuce, kiwi, potato, eggplant, and melon are in the second group, and garlic, raw vegetables, pepper, celery, zucchini, and cabbage are in the third group. The first, second, and third groups are responsible for 73.8, 16.7, and 9.5% of total F&V intake, respectively.
Fig. 2.
Dendrogram presenting hierarchical clustering for F&V consumption (g day−1) in HRA
Fig. 3.
Dendrogram presenting hierarchical clustering for F&V consumption (g day−1) in LRA
Nitrate content of F&V
The nitrate contents of F&V in HRA and LRA are presented in Table 4. As can be seen from this table, nitrate contents of leafy vegetables is significantly higher than that in root and fruit vegetables. In addition, lower nitrate contents of the fruits are seen compared to vegetables. The average nitrate contents in different groups of F&V are listed in Table 4.
Table 4.
Annual mean nitrate content of F&V analyzed in HRA and LRA
| HRA | LRA | ||||
|---|---|---|---|---|---|
| Groups of F&V | Name | Annual Mean (mg kg−1) | SD | Annual Mean (mg kg−1) | SD |
| Leafy vegetables | Spinach | 3171.8 | 1185 | 2289.3 | 307.6 |
| Coriander | 1954.1 | 226.6 | 1047.2 | 92.5 | |
| Parsley | 1015.8 | 226.4 | 1077.9 | 504.2 | |
| Lettuce | 1095 | 483 | 1224.2 | 284.7 | |
| Cabbage | 505.4 | 315.4 | 420.3 | 443.9 | |
| Celery | 1673.2 | 50.5 | 567.9 | 473.9 | |
| Mint | 1197.8 | 374 | 450 | 132.4 | |
| Scallion | 549.9 | 124.7 | 161.9 | 155.8 | |
| Basil | 2238.4 | 1189 | 1328.3 | 1073.5 | |
| Cress | 2158.3 | 946.5 | 2724.6 | 336.3 | |
| Dill | 1279.7 | 137.1 | 1000.9 | 934.1 | |
| Leek | 1294.8 | 176.4 | 833.3 | 136.9 | |
| Tarragon | 145.8 | 28.1 | 141.3 | 36.6 | |
| Mean | 1406.1 | 1020.5 | |||
| Root vegetables | Carrot | 88.7 | 74.2 | 133.4 | 34.4 |
| Onion | 313.1 | 145.5 | 159 | 81.5 | |
| Potato | 138.1 | 17.2 | 231.8 | 54 | |
| Garlic | 212 | 7.1 | 236.5 | 19.1 | |
| Radish | 1451.8 | 524.6 | 887.9 | 683.2 | |
| Mean | 440.7 | – | 329.7 | – | |
| Fruit vegetables | Eggplant | 246.3 | 144.7 | 320.71 | 43.22 |
| Pepper | 78.5 | 49.6 | 99.54 | 44.63 | |
| Tomato | 43.2 | 2.5 | 57.06 | 46.12 | |
| Zucchini | 410.3 | 1.1 | 522.8 | 11.88 | |
| Cucumber | 98.9 | 61.3 | 86.26 | 29.36 | |
| Mean | 175.4 | 217.2 | |||
| Fruits | Kiwi | 66.3 | 3.8 | 65.8 | 3.1 |
| Orange | 71.8 | 2.9 | 71.8 | 2.9 | |
| Apple | 140 | 151.3 | 194.7 | 236.8 | |
| Banana | 108.4 | 37 | 108.4 | 67.3 | |
| Watermelon | 74.2 | 44.8 | 88.4 | 3.5 | |
| Melon | 158.3 | 5.5 | 44.1 | 2.8 | |
| Mean | 103.2 | 95.5 | |||
With except for fruit vegetables, the average nitrate content in other groups of vegetables for HRA was higher than those for LRA. In HRA, the mean nitrate content in leafy vegetables (1020.5 vs 1406.5 mg kg−1), root vegetables (329.7 vs 440.7 mg kg−1), and fruit vegetables (329.7 vs 440.7 mg kg−1) were lower compared to these items in the low-risk area. However, as for fruits, the mean nitrate content in HRA (95.3 mg kg−1) was higher compared with LRA (103.2 mg kg−1). According to the matched-pairs Wilcoxon test, a significant difference was not detected between two study areas in terms of the nitrate content of F&V (p = 0.127).
Daily intake of nitrate
The results of point-estimate daily intake of nitrate in two high and LRA are presented in Table 5. As can be seen from the table, point-estimate daily intake of nitrate is 2.02 ± 1.02 mg kg−1 day−1 in HRA and 1.98 ± 1.05 mg kg−1 day−1 in LRA. According to two-sample Wilcoxon test result, the difference between the two areas was not statistically significant (p = 0.137). Classification of the participants in the two categories with acceptable nitrate intakes and the unacceptable nitrate intakes compared to ADI of 3.7 mg kg−1 day−1 [33] are shown in Table 5. Accordingly, 6.53% of the people in the HRA and 5.9% of the people in the LRA are exposed to unacceptable point-estimate daily intake of nitrate. The Chi-square test was employed to compare two areas in terms of acceptable nitrate intake. The results of this test showed that there is no difference between the two areas (p = 0.558).
Table 5.
Descriptive statistics of point-estimate daily intake to nitrate in two HRA and LRA
| Parameter | HRA | LRA |
|---|---|---|
| Point-estimate daily intake (mg kg−1 day−1) | 2.02 ± 1.02 | 1.98 ± 1.05 |
| Acceptable (≤3.7) | 929 (93.47%) | 940 (94.1%) |
| Unacceptable (>3.7) | 65 (6.53%) | 59 (5.9%) |
| Total | 994 (100%) | 999 (100%) |
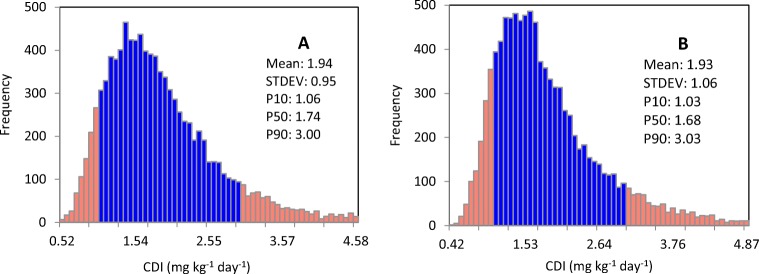
The results of the chronic exposures (CDI) to nitrate estimated using the Monte-Carlo simulation are presented in Fig. 4a, b. The statistics are shown in these figures. The average CDI in HRA and LRA were 1.94 ± 0.95 mg kg−1d−1 1.98 ± 1.06 mg kg−1d−1, respectively. For both HRA and LRA, the mean and 90th percentile of CDI of nitrate was found to be less than the ADI limit (3.7 mg kg−1 day−1). The place of the percentiles of 10 and 90 are shown in pink color columns.
Fig. 4.
CDI of nitrate through F&V estimated using Monte-Carlo simulation, a HRA, b LRA
Contribution of F&V to total nitrate intake
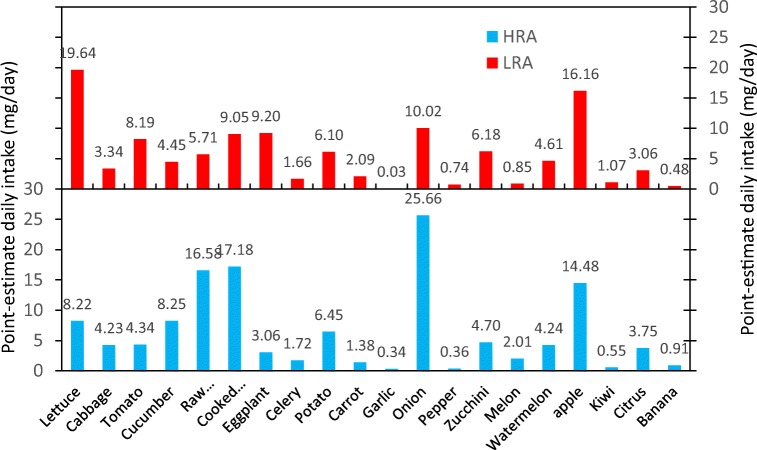
The contribution of different F&V in the average nitrate intake is presented in Fig. 5. In the LRA, the highest percentage of nitrate intake was attributable to lettuce (17.4%) followed by apple (14.4%), onion (8.9%), eggplant (8.2%), cooked vegetables (8%), raw vegetables (5.1%) and tomato (7.3%). In HRA, the highest nitrate intake was associated with onions (25.66 mg/day) followed by cooked vegetables (17.18 mg/day), raw vegetables (20%), apple (11.3%), cucumber (6.4%) and lettuce (6.4%). In two areas, garlic, pepper, banana and kiwi had the lowest share in nitrate intake. The amount of nitrate intake received from these items was less than 1%.
Fig. 5.
Point-estimate daily intake of nitrate from different F&V in HRA and LRA
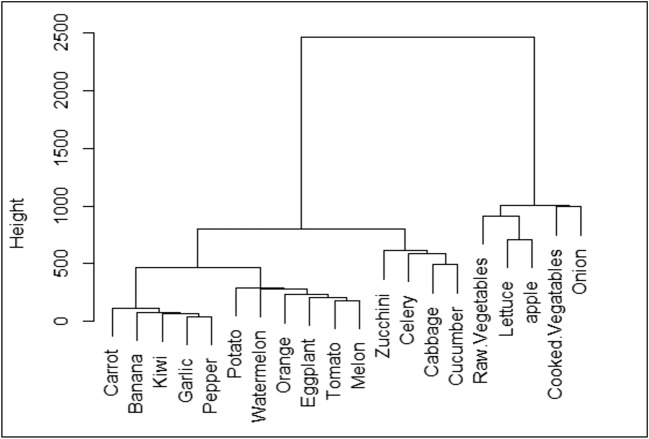
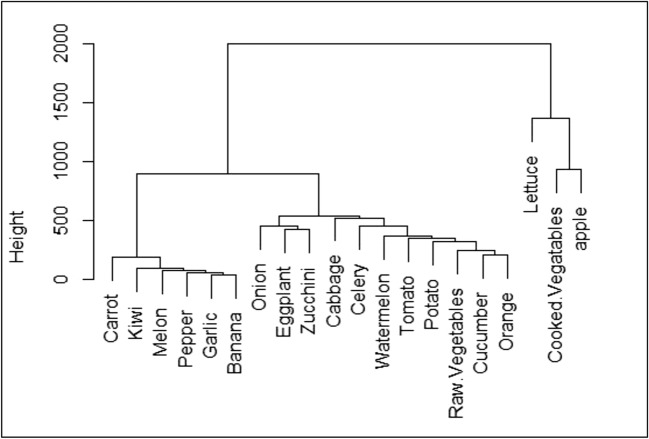
Figures 6 and 7 depict the results of cluster analysis of F&V for their contribution to the amount of nitrate intake by the Ward Hierarchical Clustering method. Form the Fig. 6, clusters analysis result in four groups in HRA. First group includes cooked vegetables, raw vegetables, onion, apple, and lettuce, the second group comprises cabbage, cucumber, celery, and zucchini, third group include tomato, melon, eggplant, orange, potato watermelon, and fourth group include garlic, pepper, kiwi, banana, and carrot. 63.9%, 14.7%, 18.6%, and 2.8% of total nitrate intake come from, first, second, third, and fourth groups, respectively. In LRA, F&V classified to three clusters according to Fig. 7. In the first group, lettuce, cooked vegetables, and apple, the second group comprises orange, cucumber, raw vegetables, potato, tomato, watermelon, celery, cabbage, zucchini, eggplant, onion, and third group include banana, garlic, pepper, melon, kiwi, and carrot. The first, second, and third groups are responsible for 39.8%, 55.5%, and 4.6% of total nitrate intake.
Fig. 6.
Dendrogram showing hierarchical clustering for a point-estimate daily intake (mg day−1) through F&V in HRA
Fig. 7.
Dendrogram showing hierarchical clustering for a point-estimate daily intake (mg day−1) through F&V in LRA
Uncertainty analysis
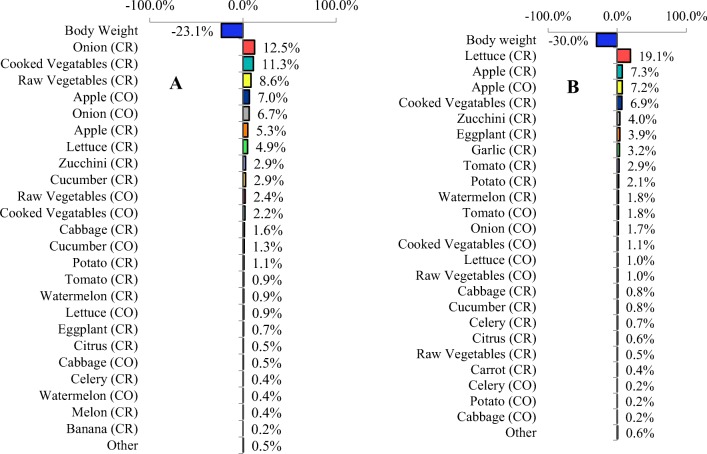
The uncertainty analysis CDI using Monte-Carlo simulation is shown in Fig. 8a, b. As can be seen from these figures, for all calculated CDIs, body weight (BW) has the highest contribution to variation of this index.
Fig. 8.
Sensitivity of the CDI to variation in input random variables, A: HRA, B: LRA, CR: consumption rate, CO: nitrate content
For LRA, body weight, followed by the consumption rate of lettuce and apple, nitrate content of apple, and the consumption rate of cooked vegetables had more uncertainty than other parameters in an estimated CDI. The value of CDI in HRA were heavily influenced by uncertainty of body weight, followed by the consumption rate of onion, raw vegetables, and cooked vegetables, and nitrate content of onion and apple, respectively.
Discussion
The results of nitrate content in vegetables show that the highest amount of nitrate is found in leafy vegetables, followed by root vegetables, fruit vegetables and fruits. These results are in agreement with classification of vegetables established by the IARC [38] in terms of nitrate content. According to this classification, vegetables are divided into three groups of low nitrate content (<10/100 g), medium nitrate content (10–100 mg/100 g), and high nitrate content (>100 mg/100 g). In this classification, leafy vegetables such as lettuce, spinach, and celery fall in the first group, vegetables such as carrots, cabbage and potatoes fall in the second group and vegetables such as onions, tomatoes, peppers and fruits fall into the third group. In present study, in both areas, leafy vegetables such as spinach, coriander, parsley, lettuce, celery, mint, basil, cress, dill and leek fall in the first group, F&V such as cabbage, scallion, tarragon, onion, potato, garlic, eggplant, zucchini, apple, banana, melon fall in the second group, and vegetables and fruits such as pepper, tomato, cucumber, kiwi, orange, watermelon, melon fall in the third group. High content of nitrate in vegetables and its relatively low content in fruits have been reported in previous studies in Iran [2, 8, 39] and other countries [4, 40, 41]. Qingbing Wang et al. reported a negative relationship between GC and fruits consumption in a systematic and meta-analytical review. However, they did not observe an inverse association between vegetables consumption and GC [42]. The main explanation for these results may be high content of nitrate in vegetables and its low content in fruits.
There is no standard limit of nitrate for all F&V. The European Commission has set the limit for nitrate in fresh spinach and lettuce grown in open air as 2500–3000 and 4000–4500 mg kg−1, respectively [43]. The annual average content of nitrate in spinach from HRA (3171 mg kg−1) is higher than this standard limit. The amount of nitrate in the spinach of low-risk area (2289.3 mg kg−1) and lettuce of HRA (1095 mg kg−1) and lower risk area (1224.2 mg kg−1) are lower than these standard limits.
According to cluster analysis result, onion, cooked and raw vegetables, apple, and lettuce have high contribution to total daily intake of nitrate in HRA. In LRA, apple, lettuce, cooked vegetables are responsible for a large portion of nitrate intake. In a previous study, the high contribution of lettuce and potatoes to nitrate intake in other countries has been mentioned [44]. What is noteworthy is the high proportion of apples in the total nitrate intake of two regions despite its low nitrate content. The main explanation for this result is the high consumption of apple by residents of the two regions.
Daily intake of nitrate without considering body weight in HRA (155.99 ± 77.14 mg day−1) is higher than the LRA (134.87 ± 70.61 mg day−1). The mean daily intake of nitrate has been reported to be between 31 and 185 mg per day for adults worldwide. There is a big difference in the amount of nitrate intake in different countries. For example, Australia with an intake rate of about 79 mg per day is categorized in low-receiving class, Belgium with 148 mg per day in moderate-receiving class, China with 486 mg per day in high receiving and Japan with more than 1100 mg per day are classified as very high-receiving class [6]. Accordingly, HRA and LRA of stomach cancer surveyed in this study are categorized as moderate-receiving class.
The results of the chronic exposure to nitrates through F&V show that the mean CDI obtained by Monte- Carlo is not significantly different in HRA (1.94 mg kg−1 d−1) compared to a LRA (1.93 mg kg−1d−1). Also, the percentage of people with an unacceptably intake in the HRA is 6.53% and in the LRA is 5.9%. Based on the result of chi-square analysis, there is no significant difference among the two areas in terms of percentage of subjects with an unacceptable intake.
F&V were selected to study the amount of nitrate intake with this assumption which is a large part of the nitrate received is from these food items. However, nitrates can be received at lower levels through drinking water and other food items such as meat and meat products [13]. Therefore, the amount of nitrate intake calculated in this study can be less than the actual value.
In previous studies that investigated the relationship between nitrate and GC, the amount of nitrate received has been calculated based on the content of nitrate obtained in previous studies or prepared food tables. So in these studies, what makes the difference in the amount of nitrate received is the difference in the amount of food intake of nitrate than the nitrate content of food items. The content of nitrate in vegetables depends on the characteristics of land under cultivation, the type of water used for irrigation, and the type and amount of agricultural and animal fertilizers applied, moisture, sunlight, air temperature, harvest stage and time, and genetic factors [13, 44]. Therefore, the nitrate content of F&V varies from region to region and in order to obtain the actual nitrate intake of individuals in each area, vegetable and fruits should be analyzed separately for the determination of their nitrate content. In this study, nitrate content of F&V as the main sources of nitrate were measured separately in two regions. Therefore, in this study, in addition to the amount of F&V consumed, the nitrate content of F&V was measured directly and considered in the calculation of nitrate intake by consumers.
Conclusion
In this study, two regions with high and low risk of GC were compared in terms of nitrate intake through F&V. To calculate nitrate intake, measured nitrate content of F&V and consumption pattern from the FFQ were applied. To the best of our knowledge, this is the first comparative study on nitrate intake of residents in HRA and LRA of GC in Iran. The results show that the nitrate intake of these two regions through F&V is not significantly different. However, another study is suggested to study other sources of nitrate and also intake of nitrite and nitrosamine compounds.
Acknowledgments
This study was supported by the Institute for Environmental Research (IER), Tehran University of Medical Sciences [grant number: 96-03-46-36620]. The authors thank the officials of the Persian cohort in Ardabil and Kavar for providing the consumption data of F&V.
Compliance with ethical standards
Conflict of interest
The authors declare no conflict of interest.
Footnotes
Publisher’s note
Springer Nature remains neutral with regard to jurisdictional claims in published maps and institutional affiliations.
References
- 1.Quijano L, Yusà V, Font G, McAllister C, Torres C, Pardo O. Risk assessment and monitoring programme of nitrates through vegetables in the region of Valencia (Spain) Food Chem Toxicol. 2017;100:42–49. doi: 10.1016/j.fct.2016.12.010. [DOI] [PubMed] [Google Scholar]
- 2.Nowrouz P, Taghipour H, Dastgiri S, Bafandeh Y, Hashemimajd K. Nitrate determination of vegetables in Varzeghan City, North-western Iran. Health Promot Perspect. 2012;2(2):244. doi: 10.5681/hpp.2012.030. [DOI] [PMC free article] [PubMed] [Google Scholar]
- 3.Ajdarkosh H, Sohrabi M, Moradniani M, Rakhshani N, Sotodeh M, Hemmasi G, et al. Prevalence of gastric precancerous lesions among chronic dyspeptic patients and related common risk factors. Eur J Cancer Prev. 2015;24(5):400–406. doi: 10.1097/CEJ.0000000000000118. [DOI] [PubMed] [Google Scholar]
- 4.Tamme T, Reinik M, Roasto M, Juhkam K, Tenno T, Kiis A. Nitrates and nitrites in vegetables and vegetable-based products and their intakes by the Estonian population. Food Addit Contam. 2006;23(4):355–361. doi: 10.1080/02652030500482363. [DOI] [PubMed] [Google Scholar]
- 5.Anjana SU, Iqbal M. Nitrate accumulation in plants, factors affecting the process, and human health implications. A Review. Agron Sustain Dev. 2007;27(1):45–57.
- 6.Bondonno CP, Blekkenhorst LC, Liu AH, Bondonno NP, Ward NC, Croft KD, et al. Vegetable-derived bioactive nitrate and cardiovascular health. Mol Asp Med. 2018;61:83–91. doi: 10.1016/j.mam.2017.08.001. [DOI] [PubMed] [Google Scholar]
- 7.Chetty AA, Prasad S, Pinho OC, de Morais CM. Estimated dietary intake of nitrate and nitrite from meat consumed in Fiji. Food Chem. 2018. [DOI] [PubMed]
- 8.Bahadoran Z, Mirmiran P, Jeddi S, Azizi F, Ghasemi A, Hadaegh F. Nitrate and nitrite content of vegetables, fruits, grains, legumes, dairy products, meats and processed meats. J Food Compos Anal. 2016;51:93–105. [Google Scholar]
- 9.Chan TY. Vegetable-borne nitrate and nitrite and the risk of methaemoglobinaemia. Toxicol Lett. 2011;200(1–2):107–108. doi: 10.1016/j.toxlet.2010.11.002. [DOI] [PubMed] [Google Scholar]
- 10.Lou T, Huang W, Wu X, Wang M, Zhou L, Lu B, et al. Monitoring, exposure and risk assessment of sulfur dioxide residues in fresh or dried fruits and vegetables in China. Food Addit Contam, Part A. 2017;34(6):918–927. doi: 10.1080/19440049.2017.1313458. [DOI] [PubMed] [Google Scholar]
- 11.Salehi L, Eftekhar H, Mohammad K, Tavafian SS, Jazayery A, Montazeri A. Consumption of fruit and vegetables among elderly people: a cross sectional study from Iran. Nutr J. 2010;9(1):2. doi: 10.1186/1475-2891-9-2. [DOI] [PMC free article] [PubMed] [Google Scholar]
- 12.Song P, Wu L, Guan W. Dietary nitrates, nitrites, and nitrosamines intake and the risk of gastric cancer: a meta-analysis. Nutrients. 2015;7(12):9872–9895. doi: 10.3390/nu7125505. [DOI] [PMC free article] [PubMed] [Google Scholar]
- 13.Colla G, Kim H-J, Kyriacou MC, Rouphael Y. Nitrate in fruits and vegetables. Sci Hortic. 2018;237:221–238. [Google Scholar]
- 14.Van Maanen J, Welle IJ, Hageman G, Dallinga JW, Mertens P, Kleinjans J. Nitrate contamination of drinking water: relationship with HPRT variant frequency in lymphocyte DNA and urinary excretion of N-nitrosamines. Environ Health Perspect. 1996;104(5):522–528. doi: 10.1289/ehp.96104522. [DOI] [PMC free article] [PubMed] [Google Scholar]
- 15.Levallois P, Ayotte P, Van Maanen J, Desrosiers T, Gingras S, Dallinga J, et al. Excretion of volatile nitrosamines in a rural population in relation to food and drinking water consumption. Food Chem Toxicol. 2000;38(11):1013–1019. doi: 10.1016/s0278-6915(00)00089-2. [DOI] [PubMed] [Google Scholar]
- 16.Roohparvar R, Shamspur T, Mostafavi A, Bagheri H. Indirect ultra-trace determination of nitrate and nitrite in food samples by in-syringe liquid microextraction and electrothermal atomic absorption spectrometry. Microchem J. 2018;142:135–139. [Google Scholar]
- 17.Jakszyn P, Bingham S, Pera G, Agudo A, Luben R, Welch A, et al. Endogenous versus exogenous exposure to N-nitroso compounds and gastric cancer risk in the European prospective investigation into Cancer and nutrition (EPIC-EURGAST) study. Carcinogenesis. 2006;27(7):1497–1501. doi: 10.1093/carcin/bgl019. [DOI] [PubMed] [Google Scholar]
- 18.Jakszyn P, González CA. Nitrosamine and related food intake and gastric and oesophageal cancer risk: a systematic review of the epidemiological evidence. World J Gastroenterol. 2006;12(27):4296–4303. doi: 10.3748/wjg.v12.i27.4296. [DOI] [PMC free article] [PubMed] [Google Scholar]
- 19.Xu L, Qu Y-H, Chu X-D, Wang R, Nelson HH, Gao Y-T, et al. Urinary levels of N-nitroso compounds in relation to risk of gastric cancer: findings from the shanghai cohort study. PLoS One. 2015;10(2):e0117326. doi: 10.1371/journal.pone.0117326. [DOI] [PMC free article] [PubMed] [Google Scholar]
- 20.Yang CY, Cheng MF, Tsai SS, Hsieh YL. Calcium, magnesium, and nitrate in drinking water and gastric cancer mortality. Japanese journal of cancer research : Gann. 1998;89(2):124–130. doi: 10.1111/j.1349-7006.1998.tb00539.x. [DOI] [PMC free article] [PubMed] [Google Scholar]
- 21.Yang CY, Chiu HF, Chiu JF, Cheng MF, Kao WY. Gastric cancer mortality and drinking water qualities in Taiwan. Arch Environ Contam Toxicol. 1997;33(3):336–340. doi: 10.1007/s002449900262. [DOI] [PubMed] [Google Scholar]
- 22.Pourfarzi F, Whelan A, Kaldor J, Malekzadeh R. The role of diet and other environmental factors in the causation of gastric cancer in Iran - a population based study. Int J Cancer. 2009;125(8):1953–1960. doi: 10.1002/ijc.24499. [DOI] [PubMed] [Google Scholar]
- 23.Malekzadeh R, Derakhshan MH, Malekzadeh Z. Gastric cancer in Iran: epidemiology and risk factors. Arch Iran Med. 2009;12(6):576–583. [PubMed] [Google Scholar]
- 24.Shakeri R, Malekzadeh R, Etemadi A, Nasrollahzadeh D, Aghcheli K, Sotoudeh M, et al. Opium: an emerging risk factor for gastric adenocarcinoma. Int J Cancer. 2013;133(2):455–461. doi: 10.1002/ijc.28018. [DOI] [PMC free article] [PubMed] [Google Scholar]
- 25.Marzban M, Nahvijou A, Jafari N. Six-fold difference in the stomach cancer mortality rate between northern and southern Iran. Arch Iran Med. 2012;15(12):741. [PubMed] [Google Scholar]
- 26.Sadjadi A, Malekzadeh R, Derakhshan MH, Sepehr A, Nouraie M, Sotoudeh M, et al. Cancer occurrence in Ardabil: results of a population-based Cancer registry from Iran. Int J Cancer. 2003;107(1):113–118. doi: 10.1002/ijc.11359. [DOI] [PubMed] [Google Scholar]
- 27.Malekzadeh R, Sotoudeh M, Derakhshan M, Mikaeli J, Yazdanbod A, Merat S, et al. Prevalence of gastric precancerous lesions in Ardabil, a high incidence province for gastric adenocarcinoma in the northwest of Iran. J Clin Pathol. 2004;57(1):37–42. doi: 10.1136/jcp.57.1.37. [DOI] [PMC free article] [PubMed] [Google Scholar]
- 28.Hajizadeh N, Pourhoseingholi MA, Baghestani AR, Abadi A, Zali MR. Bayesian adjustment for over-estimation and under-estimation of gastric cancer incidence across Iranian provinces. World J Gastrointest Oncol. 2017;9(2):87–93. doi: 10.4251/wjgo.v9.i2.87. [DOI] [PMC free article] [PubMed] [Google Scholar]
- 29.Hongsibsong S, Polyiem W, Narksen W, Kerdnoi T, Prapamontol T. Determination of nitrate in the edible part of vegetables from markets around Chiang Mai city, northern Thailand by using high performance liquid chromatography. Asian J Agric Res. 2014;8(4):204–210. [Google Scholar]
- 30.Chou S-S, Chung J, Hwang D. A high performance liquid chromatography method for determining nitrate and nitrite levels in vegetables. J Food Drug Anal. 2003;11(3):233–238. [Google Scholar]
- 31.Shrivastava A, Gupta VB. Methods for the determination of limit of detection and limit of quantitation of the analytical methods. Chronicles of Young Scientists. 2011;2(1):21. [Google Scholar]
- 32.Duan Y, Guan N, Li P, Li J, Luo J. Monitoring and dietary exposure assessment of pesticide residues in cowpea (Vigna unguiculata L. Walp) in Hainan, China. Food Control. 2016;59:250–255. [Google Scholar]
- 33.Nitrate (and potential endogenous formation of N-nitroso compounds), (2003).
- 34.EPA. US, editor. Exposure Factors Handbook 2011 Edition (final report). Washington, DC: U.S. Environmental Protection Agency; 2011.
- 35.Avigliano E, Schenone NF. Human health risk assessment and environmental distribution of trace elements, glyphosate, fecal coliform and total coliform in Atlantic rainforest mountain rivers (South America) Microchem J. 2015;122:149–158. [Google Scholar]
- 36.EPA US. Nitrate; CASRN 14797–55-8: Integrated Risk Information System (IRIS), US Environmental Protection Agency EPA1991.
- 37.Yuan Y, Chen C, Zheng C, Wang X, Yang G, Wang Q, et al. Residue of chlorpyrifos and cypermethrin in vegetables and probabilistic exposure assessment for consumers in Zhejiang Province, China. Food Control. 2014;36(1):63–68. [Google Scholar]
- 38.Humans IWGotEoCRt. IARC monographs on the evaluation of carcinogenic risks to humans. Ingested nitrate and nitrite, and cyanobacterial peptide toxins. IARC monographs on the evaluation of carcinogenic risks to humans. 2010;94:v. [PMC free article] [PubMed]
- 39.Rezaei M, Fani A, Moini AL, Mirzajani P, Malekirad AA, Rafiei M. Determining nitrate and nitrite content in beverages, fruits, vegetables, and stews marketed in Arak, Iran. Int Scholarly Res Not. 2014;2014. [DOI] [PMC free article] [PubMed]
- 40.Ayaz A, Topcu A, Yurttagul M. Survey of nitrate and nitrite levels of fresh vegetables in Turkey. J Food Technol. 2007;5(2):177–179. [Google Scholar]
- 41.Sušin J, Kmecl V, Gregorčič A. A survey of nitrate and nitrite content of fruit and vegetables grown in Slovenia during 1996–2002. Food Addit Contam. 2006;23(4):385–390. doi: 10.1080/02652030600573715. [DOI] [PubMed] [Google Scholar]
- 42.Wang Q, Chen Y, Wang X, Gong G, Li G, Li C. Consumption of fruit, but not vegetables, may reduce risk of gastric cancer: results from a meta-analysis of cohort studies. Eur J Cancer. 2014;50(8):1498–1509. doi: 10.1016/j.ejca.2014.02.009. [DOI] [PubMed] [Google Scholar]
- 43.Authority EFS. Nitrate in vegetables-scientific opinion of the panel on contaminants in the food chain. EFSA J. 2008;6(6):689. doi: 10.2903/j.efsa.2008.653. [DOI] [PMC free article] [PubMed] [Google Scholar]
- 44.Santamaria P. Nitrate in vegetables: toxicity, content, intake and EC regulation. J Sci Food Agric. 2006;86(1):10–17. [Google Scholar]


