

Abstract
Background
Composting plant leachate is considered as one of the highly polluted wastewaters which is necessary to be treated by simple, economic, fast and environmentally compatible methods. In this study, treatment of fresh composting plant leachate by electro-Fenton (EF) process was investigated.
Methods
The effect of various input variables like pH (2–7), DC currents (1.5–3 A), H2O2 concentrations (theoretical ratio H2O2/COD: 0.1–0.6), TDS changes (4–6%), feeding mode, and BOD/COD ratio at the optimal point were studied. The settling characteristics of the waste sludge produced by the treatment (sludge volumes after 30-min sedimentation: V30) were also determined. Artificial neural network (ANN) approach was used for modeling the experimental data.
Results
Based on the results, the best removal rate of COD was obtained at pH: 3, 3 A constant DC current value, 0.6 theoretical ratio H2O2/COD and the feeding mode at four step injection. BOD/COD ratio at the optimal point was 0.535 and the maximum COD removal was achieved at TDS = 4%. In the optimal conditions, 85% of COD was removed and BOD/COD ratio was increased from 0.270 to 0.535. The data follow the second-order kinetic (R2 > 0.9) and neural network modeling also provided the accurate prediction for testing data.
Conclusion
Results showed that EF process can be used efficiently for treatment of composting plant leachate using the proper operating conditions.
Keywords: Electro-Fenton, Composting plant leachate, Chemical oxygen demand (COD), V30, Kinetic, Modeling
Introduction
In developing countries, solid waste management is becoming a serious challenge because of population growth and changing consumption pattern. These factors lead to creation of extensive concentrations of municipal solid waste materials which contain significant amount of organic matters [1, 2]. In recent years, different technologies have been used for recycling of organic wastes for avoiding the deposition of the organic fraction of municipal solid waste on landfill and also the international policy on management of organic wastes has been increasingly directed towards recycling [3, 4]. One of the most feasible techniques for this purpose is composting, that is known as a simple and cost-effective technology of converging organic waste materials to the fertilizers [5–7].
In spite of composting advantages, this process has also some drawbacks. The management and treatment of leachate, containing extensive amount of organic substances and are not kept in the plant, are the main pollution issues related to the removal of organic waste materials in composting facilities [8]. Leachate from composting facilities leads to risks for the environment, public and local ecosystems and had a negative influence on marine life survival [7–9]. Inappropriate management of the created leachate in these facilities contains serious threats, especially the pollution of soils and surface and groundwater resources. To minimize the amount of pollutants to an acceptable level prior to discharge, Leachate treatment is required [10–12]. In order to treat leachate including humic acid, fulvic acid, heavy metals, polychlorinated biphenyls (PCBs) and several other of persistent organic pollutants, some treatment methods have been used such as chemical oxidation [13–16], adsorption [17–19], chemical precipitation [20, 21], coagulation/flocculation [22–24] and electrodialysis [25, 26].
In recent years, electro-chemical techniques were used to removal highly toxic and non-biodegradable organic substance. In order to increase electrochemical methods efficiency, hybrid systems consist of different oxidation processes such as Fenton’s oxidation (FO), photo-oxidation, and electro-oxidation have been widely applied. To overcome the drawbacks of conventional Fenton process, an electrochemical oxidation method based on Fenton reaction arose, known as the electro-Fenton (EF) process, were used [27–29].
In the EF process, organic substances oxidation happens through generation of hydroxyl radical using Fenton reaction in an indirect electrochemical oxidation. In the absence of organic compounds, the Fenton free radical mechanism mainly involves the sequence of following reactions 1 to 7 [30]:
| 1 |
| 2 |
| 3 |
| 4 |
| 5 |
| 6 |
| 7 |
Generally, there are two different EF configurations which consist of 1) the EF system where Fenton’s reagents (Fe(II) and H2O2) are added to the reactor from outside and inert electrodes with high catalytic activity are used as anode material; 2) H2O2 is added from outside and Fe(II) is provided from sacrificial cast iron anodes. In the EF studies with high strength wastewater such as landfill leachates, the configuration in which hydrogen peroxide was externally dosed were used, because a longer period for treatment is needed for in situ generation of hydrogen peroxide [31]. Trujillo et al. (2006) investigated the oxidation of composting leachate of two organic wastes by the Fenton’s reagent. Both leachates were significantly oxidized with COD removal amount of 77% and 75% and BOD removal amount of 90 and 98% [32].
In the present research, the EF technique applicability was examined to remediate fresh composting plant leachate and experimental parameters like pH, DC current, H2O2 concentration (theoretical ratio H2O2/COD) and feeding mode, BOD/COD ratio at the optimal point were examined. The method efficiency was examined using COD. Furthermore, the effect of TDS changes on settling characteristic of the waste sludge produced from the treatment (sludge volume after 30-min sedimentation: V30) were also determined. The data obtained from the study were also evaluated using artificial neural network (ANN) model to predict the leachate treatment by electro-Fenton process.
Materials and methods
The leachate characteristic and EF process
The collection of samples were performed using polyethylene bottles from Isfahan composting plant, Iran (Early 2017). The leachate characteristics listed in Table 1. Samples were kept in a fridge at 4 °C. EF system in this study includes three main units: an EF reactor with volume of 600 mL, a DC power supply (Yizhan PS-305D), and a digital magnetic mixer (Heidolph MR 3002–4) (Fig. 1). Iron plates (ST37) with dimensions of 14 cm × 4 cm × 0.4 cm were used as both anode and cathode in the reactor. The distance between the electrodes was considered 2.8 cm.
Table 1.
Filtered Leachate characteristics
| Parameters | Units | values |
|---|---|---|
| pH | – | 4 ± 0.12 |
| Color | Abs | 2.057 ± 0.107 |
| EC | mS/cm | 65 ± 0.63 |
| COD | mg/L | 28,000 ± 320 |
| BOD5 | mg/L | 7650 ± 113 |
| TDS | g/L | 40 ± 0.35 |
Fig. 1.
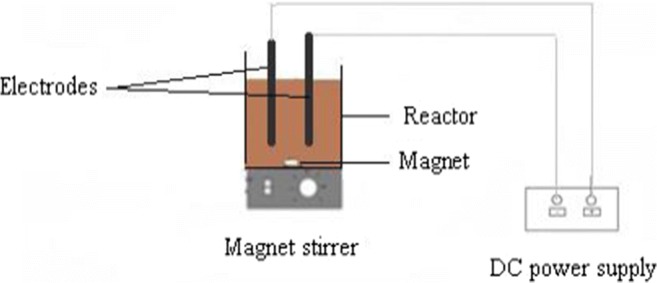
Scheme of electro-Fenton system
Chemicals with analytic grade were applied in all experiments and distilled water was applied for preparation of solutions. A Eutech 5500 pH-meter and WTW LF 330 conductivity meter was applied for measuring the pH and electrical conductivity (EC) of solution, respectively. Closed reflux method and respirometric BOD method were applied for measurement of COD and BOD5, respectively [33]. Spectrophotometer (DR-5000, with wavelength of 400 nm) and TDS meter (HACH) were used for color and total dissolved solids (TDS) measurement, respectively.
Experimental procedure
At first 500 mL filtered sample by glass fiber filter whatman was transferred into the EF reactor and then the initial pH values were adjusted by using 1.0 mol L−1 H2SO4 and NaOH solutions. In order to keep the homogeneity of electrolyte concentration during the experiments, the solution in reactor was mixed at 200 rpm by a magnetic stirrer. The required amount of H2O2, which was selected as the H2O2/COD (v/v) theoretical ratio, was added into the solution and then EF experiments were started under constant DC current. COD reaction with hydrogen peroxide is defined as following reactions [34].
| 8 |
| 9 |
Hydrogen peroxide feeding mode is an essential parameter in the performance of EF system. In this study, stepwise and continues addition modes of H2O2 was investigated.
V30 test, which is based on the material sedimentation, due to the gravity, was calculated using the Imhoff funnel after 30 min sludge sedimentation.
Kinetic studies
The data were also investigated with the zero order, first order and second order kinetics (Table 2). Where kapp is reaction rate coefficient, t is time, C0 and Ct are the initial and final concentration of the constituent in the liquid, respectively. DT90 and t 1/2 are the required time for 90% removal of leachate COD and half-life, respectively. For performing the kinetic tests, operating parameters such as applied currents and H2O2 concentrations at different time intervals (0–60 min) were investigated.
Table 2.
Equations used for kinetics studies
| Kinetic | Equations | ||
|---|---|---|---|
| Zero-order | Ct = Co − kappt | ||
| First-order | Ct = Coexp (−kappt) | ||
| Second-order | |||
Artificial neural network (ANN) modeling
In the advanced oxidation reactions, due to the influence of various factors on the reactions performed during the time and matrix complexity, their modeling is not feasible using conventional mathematical models. Up to now, the modeling of these experiments using artificial neural network (ANN) has been considered by researchers. Multi-layer perceptron (MLP) neural network is one of the most widely used artificial neural networks which includes the input, hidden and output layers [35]. A function that is widely used for input and hidden layers is the sigmoidal transfer function (Eq. 10) and the linear function (Eq. 11) is used as the output layer function [36].
| 10 |
| 11 |
Inputs are separately weighted and then summed by a constant value as bias. The data are modified by the activation function and passed to the output [37, 38]. The mathematical expression of neuron computation is given in Eq. 12:
| 12 |
Where, αi are inputs, wij are weights and b is bias [36].
First, the neural network is trained for a part of the data, weights and biases are determined and then tested for the desired time intervals. Input and output data should be scaled between 0.1 and 0.9 using Eq. 13:
| 13 |
Where, min (xi), max (xi) and xi are the minimum, maximum and actual data, respectively [37].
In this research, the parameters involved as inputs and the removal efficiencies were considered as outputs. Artificial neural network architecture is characterized by the number of layers and the number of neurons in each layer (Fig. 2). To determine the number of hidden layers and the number of different neurons in the layers, the neural network is trained several times.
Fig. 2.

Architecture of artificial neural network optimized structure
The effective parameters in the model should be identified and the effectiveness of each parameter in determining the output response should be checked that this is done by sensitivity analysis. One of the common methods for sensitivity analysis is the application of the Gaussian equation (Eq. 14):
| 14 |
Where, Ij is sensitivity analysis, ih is input and output variable, Ni and Nh are input numbers and hidden neurons. The ‘i’, ‘h’ and ‘o’ marks return to the input, hide, and output layers, respectively. The ‘k’, ‘m’ ‘n’ marks returns to the input, hidden, and output neurons, respectively [39].
The range of input values of this study is presented in Table 3. Each data (input) has a different scale. To improve the performance of an artificial neural network using Eq. 13, the data is normalized to equalize the scales and data preprocessing operations were performed to model them.
Table 3.
The range of input values (variables) and their statistical characteristics
| Variable | Ranges | Average | Standard deviation | Coefficient of variation |
|---|---|---|---|---|
| Input layer | ||||
| Time (min) | 5–60 | 31 | 22.14 | 0.71 |
| pH | 2–7 | 3 | 0.66 | 0.21 |
| TDS (%) | 4–6 | 4 | 0.31 | 0.07 |
| CD (A) | 1.5–3 | 2.34 | 0.39 | 0.17 |
|
H2O2 (cc) (H2O2/COD) |
73–441 | 204 | 118.69 | 0.58 |
| Output layer | ||||
| R (%) | 15–85 | 50.51 | 19.46 | 0.38 |
Then, according to mean squared error (MSE) and correlation coefficient (R2) statistics (eqs. 15–16), the best number of layers and the best number of neurons is obtained.
| 15 |
| 16 |
Where, n is the number of data, i is an index of data, yobs,i and ymodel,i are the measured output value and the predicted output value by model, respectively. yobs,mean and ymodel,mean are the average of the experimental measured output values and the average of the predicted values by model, respectively [37].
Results and discussion
The effect of pH on the removal efficiency of COD and V30
The solution pH is one of the effective parameters on iron species and H2O2 decomposition. As shown in Fig. 3a, the minimum and the maximum values of COD removal are obtained at pH = 7 (48.57 ± 1.25) and 3 (68 ± 1), respectively. According to the results, pH 3 was determined as the optimum pH. The other studies also have achieved similar results [31, 40, 41]. Atmaca (2009) used electro-Fenton method for treatment of landfill leachate. At initial pH equal to 3, the highest COD removal efficiency (64%) was observed. At pH values of higher and lower than 3, removal efficiency was decreased [40].
Fig. 3.

a Effect of pH on the removal of COD, b Effect of pH on V30 (COD0 = 28,000 mg/l, T = 60 min, CD = 2A, TDS = 4%, H2O2/COD = 0.2)
The removal of COD was decreased at lower or higher values of optimum pH. At high pH levels, several factors lead to decreasing the removal of COD: (i) The creation of CO3− and HCO3− with consequential scavenging of hydroxyl radicals, (ii) reduction of hydroxyl radicals oxidation potential, (iii) Fe2+ deactivation through production of ferric hydroxides, (iv) reduction of hydroxyl radical creation without presence of H+ and (v) H2O2 to water and oxygen decomposition [30, 42, 43]. In acidic conditions, the stable complexes of iron with H2O2 leads to the Fe2+ deactivation, and the formed [Fe (H2O)]2+ reacts slowly with H2O2 that produced less hydroxyl radicals [30, 43] and consequently, COD removal amount was decreased. The electro-generated H2O2 reacts with H+ to form H3O2+ that decreases the reaction rate between H2O2 and Fe2+ (Eq. 1), and less hydroxyl radicals are produced [44].
According to Fig. 3 b, the minimum and maximum values of V30 are obtained at pH = 7 (0 mL/L) and 2 (52.15 mL/L), respectively. The release of Fe2+ and Fe3+ from anode and OH− from cathode produces Fe(OH)2 and Fe(OH)3 compounds. Much more Fe(OH)3 were produced in acidic conditions, and since it has a gelatin form, it can be adsorbed and finally removed materials from leachate.
The results showed that by increasing pH, V30 value was decreased. Moreover, for pH values greater than 4, the sedimentation possibility became very slight. The results were consistent with the findings of Atmaca (2009) who investigated treatment of landfill leachate by using electro-Fenton method [40].
The effect of current intensity on the removal efficiency of COD and V30
Applied current intensity is a critical input variable in efficiency of EF system. According to Fig. 4 a, with increasing current intensity from 1.5 to 3 A, the removal efficiency of COD was increased from 19.86% in 5 min to 72% in 60 min. Maximum removal of COD occurred in the first 30 min, then the removal efficiency decreased.
Fig. 4.

a Effect of current intensity on COD removal (COD0 = 28,000 mg/l, pH = 3, TDS = 4%, H2O2/COD = 0.2). b Effect of current intensity on the V30 (COD0 = 28,000 mg/l, T = 60 min, pH = 3, TDS = 4%, H2O2/COD = 0.2)
Increasing the applied current intensity causes enhancement of Fe2+ to Fe3+ electro-generation (Eq. 19) that leads to improvement of performance of Fenton chain reactions [29]. While, at high currents, competitive electrode reactions, like discharging oxygen at the anode (Eq. 20) and production of hydrogen at the cathode (Eq. 21), could enhance and impede the principal reactions (Eqs.18 and 19) [29].
The results of studies conducted about the influence of the electrical current intensity on the removal of organic load from landfill leachate by EF process showed that by increasing current intensity the organic load removal was increased; but it starts decreasing when higher current rates were used [31, 40, 44, 45]. The application of significant current intensity can considerably enhance the consuming of process energy with a negligible increase in the performance of system [40].
Regarding to the comparison between the results of COD removal for the 2.5 and 3 A currents, the 2.5 A was considered as an optimal current value in this study.
| 17 |
| 18 |
| 19 |
| 20 |
| 21 |
According to Fig.4 b, the maximum and minimum V30 are obtained at currents 1.5A (40.67 ± 1.15 mL/L) and 3A (46.67 ± 1.15 mL/L), respectively. The results of this study are in accordance with Bouhezila et al. (2011) that studied treatment of landfill leachate by an electrochemical reactor [46]. The effect of the applied current intensity on V30 values can be attributed to increasing Fe(OH), clots production and coagulation of these clots with the solutes and then unstabilizing the particles and converting them to the sludge.
Effect of the concentration of H2O2 (H2O2/COD) on the removal efficiency of COD and V30
Fenton reagents concentration is a principal agent that restricts the efficiency of this system. Shortage or excess of the Fenton reagents (H2O2 or Fe(II)) result in the occurrence of scavenging reactions through Eqs. (3) and (4). As shown in Fig. 5a, the maximum and minimum of COD removal efficiencies are related to theoretical ratio H2O2/COD = 0.1 in 5 min (22 ± 2) and 0.6 in 60 min (83 ± 2), respectively. The main reason for increasing COD removal by adding H2O2 may be attributed to the generation of hydroxyl radical that plays an important role in decomposition of organic materials [41, 47].
Fig. 5.

a Effect of H2O2/COD on COD removal (COD0 = 28,000 mg/l, pH = 3, TDS = 4%, CD = 2.5A). b Effect of H2O2/COD on the V30 of leachate (COD0 = 28,000 mg/l, T = 60 min, pH = 3, TDS = 4%, CD = 2.5A)
Higher H2O2 concentrations lead to increasing COD removal, even though a decrease can be observed in H2O2 effectiveness by increasing its concentration from specific point. Indeed, hydrogen peroxide is the principal cause of hydroxyl radical production in EF system (Eq.1) and negligible dosages of H2O2 restrict the generation of hydroxyl radicals and consequently removal of COD. But, in extreme dosages of H2O2, COD removal can be dropped because of the hydroxyl radical scavenging effect of H2O2 (Eqs. 3 and 22) which may lead to the flotation of and decreasing sedimentation of sludge, due to the O2 off-gassing and the recombination of the hydroxyl radicals (Eq.23) [42, 43]. Another reason could be the production of short chain organic acids that are unlikely for further oxidation [42, 45].
| 22 |
| 23 |
According to Fig. 5 b, the minimum value of V30 is related to the theoretical ratio H2O2/COD = 0.1 (36 mL/L) and the maximum value is related to the theoretical ratio H2O2/COD = 0.6 (60 ± 2 mL/L).
In the study of Atmaca (2009) on treatment of landfill leachate, by using electro-Fenton method, SVI was reduced at first and then followed by increasing trend [40]. But, in Altin study (2008) about a photoelectro-Fenton process for the treatment of landfill leachate, SVI increased with hydrogen peroxide increase [48]. In the present study, by increasing the concentration of hydrogen peroxide the amount of generated sludge was also increased that is in contrast with the results of previous studies which have predicted lower amount of sludge production.
The effects of hydrogen peroxide feeding mode on the performance of COD and V30
Hydrogen peroxide feeding mode is an essential parameter in the performance of EF system. Increasing H2O2 at the initial stages or during the reaction implies variations in the [H2O2]/[COD] and [H2O2]/[Fe2+] ratios and ultimately removal of COD [49]. According to Fig. 6, the minimum value of COD removal is related to one-step injection (83 ± 2.00%) and the maximum value is related to four-step injection (85 ± 2.6%). The results of Zhang et al. (2007) revealed an increase in the performance of Fenton system to remediate landfill leachate with increasing H2O2 concentrations in multiple steps, in comparison with increasing in an individual stage [50]. In Zhang et al. (2006) study, EF method was applied to landfill leachate treatment using an electrolytic batch reactor containing 200 mL solution, the results showed that COD removal was increased with fractioning of dosage and the highest removal (79%) was achieved when continuous addition mode was used [29].
Fig. 6.
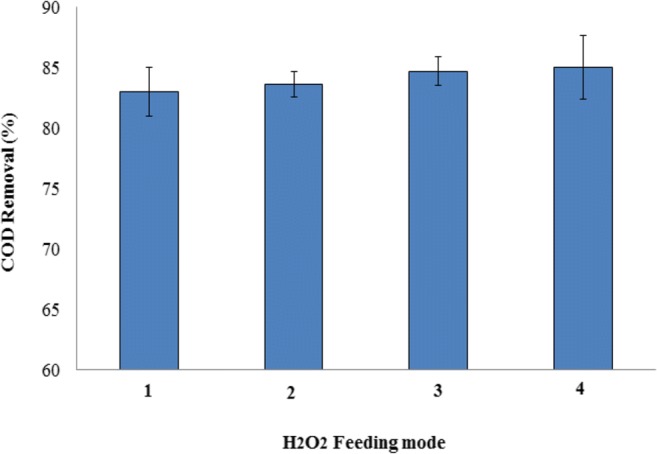
Effect of H2O2 feeding mode on COD removal (1) One step (2) Two steps (3) Three steps (4) Four steps (COD0 = 28,000 mg/l, T = 60 min, pH = 3, CD = 2.5A, TDS = 4%, H2O2/COD = 0.6)
Based on the results of studies, the addition of H2O2 in individual stage in the initial steps of the experiments led to the quick and effective creation of hydroxyl radicals, and reactions of hydroxyl radicals with H2O2 (Eq.3) and ferrous ions (Eq.4) became prominent. The stepwise addition causes keeping the dosages of H2O2 in the low values, which decreases the negative influence of hydroxyl radical scavenging (Eq.3) to the maximum extent and leads to the maximum removal of COD when continuous addition mode of H2O2 was applied [29].
The effect of TDS changes on the removal of COD and V30
According to Fig. 7a, the maximum and minimum COD removal values were achieved at TDS = 4% (83 ± 2%) and 6% (68.98 ± 1.03%), respectively. To explain the results, chloride ions (Cl−) play a major role in increasing the electrical conductivity of the electrolyte, and preventing the adverse effects of Ca2+ and Mg2+ ions deposition on oxide layers of the electrode. The latter prevents the reduction of current rate and also generation of hypochlorous acid, which is useful for organic materials oxidization. Thereby, the electrical conductivity increases generally which reduces the voltage and consequently the electrical consumption. On the other hand, changes in ionic strength of aqueous environment may cause COD reduction. Furthermore, an increase in the amount of chloride ions (Cl−) may produce transient compounds which interferes in the coagulation process and finally prevents COD reduction [3]. The decomposition rate can be affected by substitution of produced hypochlorous acid that has low oxidation potential with scavenging hydroxyl radicals which have high oxidation potential (E0 = 1. 49 V) [31]. Hence, the system’s stability will be reduced in higher TDS.
Fig. 7.

a Effect of TDS on COD removal b) Effect of TDS on V30 (COD0 = 28,000 mg/l, T = 60 min, pH = 3, CD = 2.5A, H2O2/COD = 0.6)
Furthermore, Fenton processes are highly sensitive to the presence of chloride ions and cause negative effect on the process’s efficiency, due to the scavenging feature of hydroxyl radicals and also the possibility of complexation [46]. According to Fig. 7 b, the minimum value of V30 is related to TDS = 4% (60 ± 2.00 mL/L), and the maximum value is related to TDS = 6% (68 ± 0 mL/L).
Artificial neural network modeling
According to the R2 and MSE values (Eqs. 15 and 16), the best model with the lowest error was obtained in the number of 8 neurons in a hidden layer. The error value for the number of neurons is shown in Fig. 8.
Fig. 8.

Selection the number of hidden layer neurons
The optimization process for finding the neuron network is shown in Fig. 9. This error rate is based on the error-back propagation algorithm, which is a process of optimization that reduces the error rate. As can be seen, in the 28th repetition, the optimal answer was obtained and reached the lowest level of error and the model was reached the best weights. From this round onwards, error rate worsened by changing the weighting matrix. As a result, the 28th round matrix is selected as the ultimate neural network of 8 neurons. The weights and biases obtained in the trained network are extracted and listed in Table 4.
Fig. 9.

MSE error rate obtained in the training and testing periods of the network
Table 4.
Weights matrix (W1: Weight between hidden and input layers, W2: Weight between hidden layers and output)
| neuron | W1 | bias | neuron | W2 | ||||
|---|---|---|---|---|---|---|---|---|
| Time (min) | pH | TDS (%) | CD (A) | H2O2 (cc) | ||||
| 1 | 7.1816 | −1.7512 | −0.1126 | −1.9321 | 1.7170 | −2.0680 | 1 | −1.0560 |
| 2 | −2.7909 | 8.7788 | −2.3257 | 1.0599 | 0.3664 | 2.1129 | 2 | 0.5360 |
| 3 | −2.8289 | 1.7785 | −2.6760 | 1.6424 | 0.2076 | 3.4949 | 3 | 0.6192 |
| 4 | 0.8613 | 0.2401 | 0.1678 | −0.2333 | 0.1729 | 0.3328 | 4 | 3.4590 |
| 5 | 0.7966 | −0.2497 | 5.9442 | −2.7026 | 1.1304 | −4.1750 | 5 | 0.2177 |
| 6 | −0.6326 | −0.1795 | 0.0332 | 6.4139 | −1.4173 | −2.6157 | 6 | 0.2949 |
| 7 | −1.7044 | 3.5788 | −0.0735 | −6.0723 | −1.1531 | −0.1729 | 7 | 0.1416 |
| 8 | −0.1399 | −2.4239 | 0.7805 | 0.8295 | 1.6121 | 1.9152 | 8 | 1.3320 |
| bias | −1.3681 | |||||||
The diagrams presented by model 8 neuron are shown in Fig. 10. As shown in Fig. 10 a, the values of the calculated and measured efficiencies are in a good concordance with each other which indicates the proper functioning of the neural network. In Fig. 10 b, this is shown more clearly; so that the calculated efficiency is compared to the simulated efficiency by the neural network and most of them are distributed close to the diameter line representing the correlation (R2 = 1). Correlation value (R2) was equal to 0.99079, which is a good value for laboratory data. As seen in Fig. 10 c, over 90% of the data have roughly zero error that is confirmed by Fig. 10 d, which represents the histogram of the error values. As shown in figure, the error histogram is close to a normal distribution and the frequency of data around the zero error value is clearly visible which indicates the proper functioning of the neural network.
Fig. 10.

The correlation coefficients obtained in the training and testing periods of the network
The relative importance determination of the input variables is presented in Table 5. Based on the results, CD (A) with 62.8% had the most impact contribution on the process among the input parameters of the model.
Table 5.
The relative importance of model inputs
| Variable | Importance |
|---|---|
| Time (min) | 13.6 |
| pH | 9.6 |
| TDS (%) | 7.7 |
| CD (A) | 62.8 |
| H2O2 (cc) | 6.3 |
| Total | 100.0 |
The reaction kinetics
The data obtained from the study was investigated with linear kinetics models of zero, first and second-order. The kinetic coefficients and parameters are presented in Tables 6 and 7. Based on the maximum correlation coefficient (R2), the data follow second-order kinetic model (Fig. 11a and b).
Fig. 11.

a The kinetic of COD removal in different current intensity (a:1.5 A, b:2 A, c:2.5 A, d:3 A). b The kinetic of COD removal in different H2O2 ratios (a:0.1, b:0.2, c:0.4, d:0.6)
According to Table 6, the fixed rates of COD removal of fresh compost leachate (k, min-1.mg-1.L) for current densities of 1.5, 2, 2.5 and 3 A are 1.10 × 10⁻⁶, 1.30 × 10⁻⁶, 1.5 × 10⁻⁶ and 1.56 × 10⁻⁶, respectively. The half-life values of COD removal of fresh compost leachate at 1.5, 2, 2.5 and 3 A were 34, 26, 29, and 25 min, respectively. The required times to obtain 90% COD removal of fresh compost leachate at 1.5, 2, 2.5 and 3 A were at 306, 263, 236 and 226 min, respectively.
Table 6.
Kinetic parameters of COD removal of compost fresh leachate during EF process (Current intensity (A))
| models | Current intensity (A) | ||||
|---|---|---|---|---|---|
| Parameters | 1.5 | 2 | 2/5 | 3 | |
| Zero-order | Co (mg L−1) | 24,733 | 24,028 | 23,240 | 23,218 |
| kapp (min−1.mg.L-1) | 0.0036 | 0.0034 | 0.0033 | 0.00326 | |
| R2 | 0.862 | 0.841 | 0/802 | 0.801 | |
| First-order | Co (mg L−1) | 28,000 | 28,000 | 28,000 | 28,000 |
| kapp (min−1) | 0.019 | 0.021 | 0.024 | 0.024 | |
| R2 | 0.89 | 0.869 | 0.824 | 0.838 | |
| Second-order | Co (mg L−1) | 26,774 | 26,371 | 25,381 | 25,549 |
| kapp (min−1.mg-1.L) | 0.0000011 | 0.0000013 | 0.0000015 | 0.00000156 | |
| R2 | 0.969 | 0.964 | 0.95 | 0.975 | |
| half life (t1/2 or DT50) (min) | 34 | 29 | 26 | 25 | |
| DT90 (min) | 306 | 263 | 236 | 226 | |
According to Table 7, the fixed rates of COD removal of fresh compost leachate (k, min-1.mg-1.L) for hydrogen peroxide with ratios of 0.1, 0.2, 0.4 and 0.6 are 1.06 × 10⁻⁶, 1.46 × 10⁻⁶, 2.01 × 10⁻⁶ and 2.92 × 10⁻⁶, respectively. The half-life values of COD removal of fresh compost leachate for hydrogen peroxide with ratios of 0.1, 0.2, 0.4 and 0.6 were obtained 35, 28, 22 and 13 min, respectively. The required time to obtain 90% COD removal of fresh compost leachate for hydrogen peroxide with ratios of 0.1, 0.2, 0.4 and 0.6 were obtained 319, 256, 194 and 116 min, respectively.
Table 7.
Kinetic parameters of COD removal of compost fresh leachate during EF process (H2O2 theoretical ratio)
| models | H2O2 theoretical ratio | ||||
|---|---|---|---|---|---|
| Parameters | 0.1 | 0.2 | 0.4 | 0.6 | |
| Zero-order | Co (mg L−1) | 24,408 | 22,495 | 21,953 | 21,579 |
| kapp (min−1.mg.L-1) | 0.0037 | 0.0035 | 0.0031 | 0.0029 | |
| R2 | 0.874 | 0.764 | 0.724 | 0.733 | |
| First-order | Co (mg L−1) | 28,000 | 28,000 | 28,000 | 28,000 |
| kapp (min−1) | 0.019 | 0.024 | 0.029 | 0.034 | |
| R2 | 0.902 | 0.766 | 0.719 | 0.814 | |
| Second-order | Co (mg L−1) | 26,631 | 24,033 | 23,036 | 26,476 |
| kapp (min−1.mg-1.L) | 0.00000106 | 0.00000146 | 0.00000201 | 0.00000292 | |
| R2 | 0.993 | 0.961 | 0.869 | 0.979 | |
| half life (t1/2 or DT50) (min) | 35 | 28 | 22 | 13 | |
Determination of BOD/COD ratio in the optimal conditions
In this study, BOD/COD ratio increased from 0.270 to 0.535 ± 0.008 in optimal conditions. Similar results are obtained by de Morais et al. (2005), Naumczyk et al. (2012) and also Xie et al. (2010) [51–53]. Amin et al. (2014) used ozone-hydrogen peroxide advanced oxidation process for composting leachate treatment. These research stated that the BOD5/COD ratio was decreased from 0.53 to 0.4 after 270 min reaction time [54].
One possible hypothesis for this observation is that the organic compounds of leachate are mostly biodegradable and the EF process is likely to oxidize these compounds. Anyway, the results presented in this work demonstrated the suitability of the EF process to reduce organic load of composting leachates with extremely high values of COD and BOD5 [32].
Conclusion
In composting facilities, one of the main problems is the leachates remediation and management, which presents the extensive amounts of organic materials which are not able to be kept in the plant. If this material is released or treated unsystematically, they can cause significant risks for the health and environment. Of those chemical systems, the advanced oxidation processes were applied for reduction of the organic materials or the toxicity of various sorts of leachates. In the present study, the EF system applicability was studied for remediation of fresh composting plant leachate. Results indicated that EF technique represents an excellent performance of remediation of composting leachates. But, there are numerous factors affect the EF technique treatment efficiency.
So, experimental variables like reaction time, pH, applied DC current, H2O2 concentration (theoretical ratio H2O2/COD) and feeding mode have to be chosen accurately. Based on the findings, the optimal variables of the EF technique for remediation of landfill leachate would be as follows: initial pH = 3, H2O2/COD = 0.6, constant DC current =2.5A and treatment time = 60 min. At these conditions, approximately, 85% COD removal can be reached. However, despite the effective reduction of the initial COD, the average residual amount of these materials (COD = 4200 mg/l) is higher than the discharge standard (COD = 200 mg/l) and therefore in the case of compost plants leachate treatment by EF method, it is suggested to combine the described method with one or more other pre-treatment and post-treatment methods. Sedimentation characteristics of sludge formed after treatment (sludge volumes after 30-min sedimentation: V30) are fairly good. However, the improvement of ability of flocks settling via optimal is feasible. So, the expenses of disposal of created waste sludge of EF technique would be significantly decreased in a large-scale remediation site.
Acknowledgements
The present manuscript was obtained from M.Sc. thesis of Mr. Ghasem Alkhamis [project number ETRC-9313]. Ahvaz Jundishapur University of Medical Sciences (AJUMS) supported financially this project.
Compliance with ethical standards
Conflict of interest
The authors declare that they have no competing interests.
Consent for publication
Not applicable.
Ethics approval and consent to participate
Not applicable.
Footnotes
Publisher’s note
Springer Nature remains neutral with regard to jurisdictional claims in published maps and institutional affiliations.
References
- 1.Ahmed FN, Lan CQ. Treatment of landfill leachate using membrane bioreactors: a review. Desalination. 2012;287:41–54. [Google Scholar]
- 2.Eggen T, Moeder M, Arukwe A. Municipal landfill leachates: a significant source for new and emerging pollutants. Sci Total Environ. 2010;408(21):5147–5157. doi: 10.1016/j.scitotenv.2010.07.049. [DOI] [PubMed] [Google Scholar]
- 3.Cáceres R, Magri A, Marfà O. Nitrification of leachates from manure composting under field conditions and their use in horticulture. Waste Manag. 2015;44:72–81. doi: 10.1016/j.wasman.2015.07.039. [DOI] [PubMed] [Google Scholar]
- 4.Calace N, Liberatori A, Petronio B, Pietroletti M. Characteristics of different molecular weight fractions of organic matter in landfill leachate and their role in soil sorption of heavy metals. Environ Pollut. 2001;113(3):331–339. doi: 10.1016/s0269-7491(00)00186-x. [DOI] [PubMed] [Google Scholar]
- 5.Mullane JM, Flury M, Iqbal H, Freeze PM, Hinman C, Cogger CG, Shi Z. Intermittent rainstorms cause pulses of nitrogen, phosphorus, and copper in leachate from compost in bioretention systems. Sci Total Environ. 2015;537:294–303. doi: 10.1016/j.scitotenv.2015.07.157. [DOI] [PubMed] [Google Scholar]
- 6.Cassano D, Zapata A, Brunetti G, Del Moro G, Di Iaconi C, Oller I, et al. Comparison of several combined/integrated biological-AOPs setups for the treatment of municipal landfill leachate: minimization of operating costs and effluent toxicity. Chem Eng J. 2011;172(1):250–257. [Google Scholar]
- 7.Haug R. The practical handbook of compost engineering: Routledge; 2018.
- 8.Öman CB, Junestedt C. Chemical characterization of landfill leachates–400 parameters and compounds. Waste Manag. 2008;28(10):1876–1891. doi: 10.1016/j.wasman.2007.06.018. [DOI] [PubMed] [Google Scholar]
- 9.Brown K, Ghoshdastidar AJ, Hanmore J, Frazee J, Tong AZ. Membrane bioreactor technology: a novel approach to the treatment of compost leachate. Waste Manag. 2013;33(11):2188–2194. doi: 10.1016/j.wasman.2013.04.006. [DOI] [PubMed] [Google Scholar]
- 10.Tauchert E, Schneider S, de Morais JL, Peralta-Zamora P. Photochemically-assisted electrochemical degradation of landfill leachate. Chemosphere. 2006;64(9):1458–1463. doi: 10.1016/j.chemosphere.2005.12.064. [DOI] [PubMed] [Google Scholar]
- 11.Aziz SQ, Aziz HA, Yusoff MS, Bashir MJ, Umar M. Leachate characterization in semi-aerobic and anaerobic sanitary landfills: a comparative study. J Environ Manag. 2010;91(12):2608–2614. doi: 10.1016/j.jenvman.2010.07.042. [DOI] [PubMed] [Google Scholar]
- 12.Garaj-Vrhovac V, Oreščanin V, Gajski G, Gerić M, Ruk D, Kollar R, Radić Brkanac S, Cvjetko P. Toxicological characterization of the landfill leachate prior/after chemical and electrochemical treatment: a study on human and plant cells. Chemosphere. 2013;93(6):939–945. doi: 10.1016/j.chemosphere.2013.05.059. [DOI] [PubMed] [Google Scholar]
- 13.Sun J, Li X, Feng J, Tian X. Oxone/Co2+ oxidation as an advanced oxidation process: comparison with traditional Fenton oxidation for treatment of landfill leachate. Water Res. 2009;43(17):4363–4369. doi: 10.1016/j.watres.2009.06.043. [DOI] [PubMed] [Google Scholar]
- 14.Anglada Á, Urtiaga A, Ortiz I, Mantzavinos D, Diamadopoulos E. Boron-doped diamond anodic treatment of landfill leachate: evaluation of operating variables and formation of oxidation by-products. Water Res. 2011;45(2):828–838. doi: 10.1016/j.watres.2010.09.017. [DOI] [PubMed] [Google Scholar]
- 15.Cortez S, Teixeira P, Oliveira R, Mota M. Evaluation of Fenton and ozone-based advanced oxidation processes as mature landfill leachate pre-treatments. J Environ Manag. 2011;92(3):749–755. doi: 10.1016/j.jenvman.2010.10.035. [DOI] [PubMed] [Google Scholar]
- 16.Cortez S, Teixeira P, Oliveira R, Mota M. Mature landfill leachate treatment by denitrification and ozonation. Process Biochem. 2011;46(1):148–153. [Google Scholar]
- 17.Ching SL, Yusoff MS, Aziz HA, Umar M. Influence of impregnation ratio on coffee ground activated carbon as landfill leachate adsorbent for removal of total iron and orthophosphate. Desalination. 2011;279(1–3):225–234. [Google Scholar]
- 18.Kamaruddin MA, Yusoff MS, Ahmad MA. Optimization of durian peel based activated carbon preparation conditions for ammoniacal nitrogen removal from semi-aerobic landfill leachate. 2011.
- 19.Singh SK, Townsend TG, Mazyck D, Boyer TH. Equilibrium and intra-particle diffusion of stabilized landfill leachate onto micro-and meso-porous activated carbon. Water Res. 2012;46(2):491–499. doi: 10.1016/j.watres.2011.11.007. [DOI] [PubMed] [Google Scholar]
- 20.Y-n C, Liu C-h, J-x N, X-p L, D-s W. Chemical precipitation and biosorption treating landfill leachate to remove ammonium-nitrogen. Clean Technol Envir. 2013;15(2):395–399. [Google Scholar]
- 21.Di Iaconi C, Pagano M, Ramadori R, Lopez A. Nitrogen recovery from a stabilized municipal landfill leachate. Bioresour Technol. 2010;101(6):1732–1736. doi: 10.1016/j.biortech.2009.10.013. [DOI] [PubMed] [Google Scholar]
- 22.Liu X, Li X-M, Yang Q, Yue X, Shen T-T, Zheng W, et al. Landfill leachate pretreatment by coagulation–flocculation process using iron-based coagulants: optimization by response surface methodology. Chem Eng J. 2012;200:39–51. [Google Scholar]
- 23.Ghafari S, Aziz HA, Bashir MJ. The use of poly-aluminum chloride and alum for the treatment of partially stabilized leachate: a comparative study. Desalination. 2010;257(1–3):110–116. [Google Scholar]
- 24.Al-Hamadani YA, Yusoff MS, Umar M, Bashir MJ, Adlan MN. Application of psyllium husk as coagulant and coagulant aid in semi-aerobic landfill leachate treatment. J Hazard Mater. 2011;190(1–3):582–587. doi: 10.1016/j.jhazmat.2011.03.087. [DOI] [PubMed] [Google Scholar]
- 25.Parsa N, Khajouei G, Masigol M, Hasheminejad H, Moheb A. Application of electrodialysis process for reduction of electrical conductivity and COD of water contaminated by composting leachate. Civ Eng J. 2018;4(5):1034–1045. [Google Scholar]
- 26.Schoeman J, Steyn A, Makgae M. Evaluation of electrodialysis for the treatment of an industrial solid waste leachate. Desalination. 2005;186(1–3):273–289. [Google Scholar]
- 27.Brillas E, Casado J. Aniline degradation by electro-Fenton® and peroxi-coagulation processes using a flow reactor for wastewater treatment. Chemosphere. 2002;47(3):241–248. doi: 10.1016/s0045-6535(01)00221-1. [DOI] [PubMed] [Google Scholar]
- 28.Chang P-H, Huang Y-H, Hsueh C-L, Lu M-C, Huang G-H. Treatment of non-biodegradable wastewater by electro-Fenton method. Water Sci Technol. 2004;49(4):213–218. [PubMed] [Google Scholar]
- 29.Zhang H, Zhang D, Zhou J. Removal of COD from landfill leachate by electro-Fenton method. J Hazard Mater. 2006;135(1–3):106–111. doi: 10.1016/j.jhazmat.2005.11.025. [DOI] [PubMed] [Google Scholar]
- 30.Deng Y, Englehardt JD. Treatment of landfill leachate by the Fenton process. Water Res. 2006;40(20):3683–3694. doi: 10.1016/j.watres.2006.08.009. [DOI] [PubMed] [Google Scholar]
- 31.Zhang H, Ran X, Wu X. Electro-Fenton treatment of mature landfill leachate in a continuous flow reactor. J Hazard Mater. 2012;241:259–266. doi: 10.1016/j.jhazmat.2012.09.040. [DOI] [PubMed] [Google Scholar]
- 32.Trujillo D, Font X, Sánchez A. Use of Fenton reaction for the treatment of leachate from composting of different wastes. J Hazard Mater. 2006;138(1):201–204. doi: 10.1016/j.jhazmat.2006.05.053. [DOI] [PubMed] [Google Scholar]
- 33.Federation WE, Association APH. Standard methods for the examination of water and wastewater. American public health association (APHA). Washington, DC; 2005.
- 34.Bacardit J, Oller I, Maldonado MI, Chamarro E, Malato S, Esplugas S. Simple models for the control of photo-Fenton by monitoring H2O2. J Adv Oxid Technol. 2007;10(2):219–228. [Google Scholar]
- 35.Bolanča T, Ukić Š, Peternel I, Kušić H, Božić AL. Artificial neural network models for advanced oxidation of organics in water matrix–comparison of applied methodologies. 2014.
- 36.Haghiabi AH, Nasrolahi AH, Parsaie A. Water quality prediction using machine learning methods. Water Qual Res J. 2018;53(1):3–13. [Google Scholar]
- 37.Shanmugaprakash M, Sivakumar V. Development of experimental design approach and ANN-based models for determination of Cr (VI) ions uptake rate from aqueous solution onto the solid biodiesel waste residue. Bioresour Technol. 2013;148:550–559. doi: 10.1016/j.biortech.2013.08.149. [DOI] [PubMed] [Google Scholar]
- 38.Özdemir U, Özbay B, Veli S, Zor S. Modeling adsorption of sodium dodecyl benzene sulfonate (SDBS) onto polyaniline (PANI) by using multi linear regression and artificial neural networks. Chem Eng J. 2011;178:183–190. [Google Scholar]
- 39.Yu J. A nonlinear kernel Gaussian mixture model based inferential monitoring approach for fault detection and diagnosis of chemical processes. Chem Eng Sci. 2012;68(1):506–519. [Google Scholar]
- 40.Atmaca E. Treatment of landfill leachate by using electro-Fenton method. J Hazard Mater. 2009;163(1):109–114. doi: 10.1016/j.jhazmat.2008.06.067. [DOI] [PubMed] [Google Scholar]
- 41.Babuponnusami A, Muthukumar K. Advanced oxidation of phenol: a comparison between Fenton, electro-Fenton, sono-electro-Fenton and photo-electro-Fenton processes. Chem Eng J. 2012;183:1–9. [Google Scholar]
- 42.Umar M, Aziz HA, Yusoff MS. Trends in the use of Fenton, electro-Fenton and photo-Fenton for the treatment of landfill leachate. Waste Manag. 2010;30(11):2113–2121. doi: 10.1016/j.wasman.2010.07.003. [DOI] [PubMed] [Google Scholar]
- 43.Nidheesh P, Gandhimathi R. Trends in electro-Fenton process for water and wastewater treatment: an overview. Desalination. 2012;299:1–15. [Google Scholar]
- 44.Wang Y, Li X, Zhen L, Zhang H, Zhang Y, Wang C. Electro-Fenton treatment of concentrates generated in nanofiltration of biologically pretreated landfill leachate. J Hazard Mater. 2012;229:115–121. doi: 10.1016/j.jhazmat.2012.05.108. [DOI] [PubMed] [Google Scholar]
- 45.Zhang H, Cheng Z, Zhang D. Treatment of landfill leachate by electro-Fenton process. Fresenius Environ Bull. 2007;16(9):1216–1219. [Google Scholar]
- 46.Bouhezila F, Hariti M, Lounici H, Mameri N. Treatment of the OUED SMAR town landfill leachate by an electrochemical reactor. Desalination. 2011;280(1–3):347–353. [Google Scholar]
- 47.MoayeriKashani M, Soltani SM, editors. Electrocoagulation of a real Malaysian leachate sample using Al electrodes to meet discharge standards. Advanced Materials Research; 2013: Trans Tech Publ.
- 48.Altin A. An alternative type of photoelectro-Fenton process for the treatment of landfill leachate. Sep Purif Technol. 2008;61(3):391–397. [Google Scholar]
- 49.Primo O, Rivero MJ, Ortiz I. Photo-Fenton process as an efficient alternative to the treatment of landfill leachates. J Hazard Mater. 2008;153(1–2):834–842. doi: 10.1016/j.jhazmat.2007.09.053. [DOI] [PubMed] [Google Scholar]
- 50.Zhang H, Choi HJ, Huang C-P. Optimization of Fenton process for the treatment of landfill leachate. J Hazard Mater. 2005;125(1–3):166–174. doi: 10.1016/j.jhazmat.2005.05.025. [DOI] [PubMed] [Google Scholar]
- 51.De Morais JL, Zamora PP. Use of advanced oxidation processes to improve the biodegradability of mature landfill leachates. J Hazard Mater. 2005;123(1–3):181–186. doi: 10.1016/j.jhazmat.2005.03.041. [DOI] [PubMed] [Google Scholar]
- 52.Naumczyk J, Prokurat I, Marcinowski P. Landfill leachates treatment by/UV,/, modified Fenton, and modified photo-Fenton methods. Int J Photoenergy. 2012;2012:1–9. [Google Scholar]
- 53.Xie B, Lv Z, Lv B, Gu Y. Treatment of mature landfill leachate by biofilters and Fenton oxidation. Waste Manag. 2010;30(11):2108–2112. doi: 10.1016/j.wasman.2010.06.018. [DOI] [PubMed] [Google Scholar]
- 54.Amin MM, Moazzam MMA. Advanced oxidation treatment of composting leachate of municipal solid waste by ozone-hydrogen peroxide. Int J Environ Heal Engine. 2014;3(1):21. [Google Scholar]