

Abstract
The present study deals with the green approach for the biosynthesis of copper oxide-Aloe vera (CuO-A) based nanoparticles using leaf extract of Aloe barbadensis miller. Synthesized nanoparticles were characterized through different techniques like TEM and FTIR. As the size decreases and surface area increases, these are prominently used as a very good adsorbent. The effects of different parameters like adsorbent dosage, pH, contact time, initial dye concentration and temperature are optimised to get the maximum removal of methylene blue dye from the solution. The maximum dye removal was found to be 98.89% with initial concentration of 100 mg/L at alkaline pH in 210 min., with shaking speed of 150 rpm. The Langmuir result reveals a better consistency than the Freundlich model with 95.5 mg/g. Lagergren’s model was used to study the kinetics of the system. Mechanistic behaviour was study through intra-particle diffusion study and Boyd plot. Thermodynamic study showed spontaneous and endothermic nature of the adsorption. Furthermore, synthesized CuO-A nanoparticles showed good antibacterial activity against different strains of bacteria. The zone of inhibition was found to be 11 mm, 12 mm, 8 mm and 9 mm in Pseudomonas, Klebsiella, Staphylococcus and E.coli, respectively.
Keywords: Aloe vera, Copper oxide, Nanoparticle, Antimicrobial
Introduction
Today nanotechnology has emerged as important discipline of research. Nanotechnology is the study which deals with nano-meter sized objects [5]. Nanotechnology concept was first introduced to the world by Richard Feynman where as the term was later coined by Professor Norio Taniguchi [25]. It will be developed at several levels: materials, devices and systems [7]. The nanomaterials level is the most advanced because of its commercial application and scientific knowledge. Initially, nanoparticles were studied because of their unique physical and chemical properties due to the size-dependent [11], but now they have entered a commercial exploration period [10, 13]. It is an industrial revolution of innovation and commercial success. There are various process for the production of nanoparticles such as chemical, physical and biological out of which biological approaches are more effective as well as more ecofriendly as it eliminate the use of toxic chemical. The biological process is more effective than chemical and physical approaches [15, 24]. The biological process use the biological compounds such as bacteria algae and plant extract or its products, out of which plant extract is the more convenient [21].
Metal nanoparticles have been popular among researcher because of their unique properties of specificity [22]. Higher surface and novel chemical properties are the two important pillars of nanoparticles. Out of other nanoparticles Cu nanoparticles seems to be good replacement of Ag and Au as it is easily available, low cost and have wide range of application in biomedical [26], water treatment [4], catalysts in water-gas shift reaction [16] and in other different discipline.
Medicinal plants have been present from ages to gracing human health. They have been ample source of food, fodder and medicine from ancient time to still many part of rural villages. They guarantee safety as well as effective treatment of different diseases; these reasons have still made them alive in present life. There are some active compounds which are generated by plant during its secondary metabolism and these have unique biological properties, which are helpful to human beings.
Aloe barbadensis Miller commonly known as Aloe vera is an important medicinal plant known for its history for the treatment of burns, wounds, skin irritation, cuts, insects bite etc. Aloe vera also has immune boasting and antiviral activities [14]. It has been effectively used to synthesized different nanoparticles such as gold, zinc-oxide and silver [12]. Aloe vera used Copper-oxide nanoparticles show immunomodulatary, anti-flammatary and antiparasitic and wound healing capabilities [23]. Considering its effective it can be really effective in today life but not much work is done in past on its effectiveness. In the present study Copper-oxide (CuO-A) nanoparticles are synthesised and its antibacterial activity was studied. Further, synthesized CuO-A nanoparticles were used for the removal of methylene blue dye.
Materials and methods
Plant extract (precursor) was firstly prepared by leaves of Aloe vera (Aloe barbadensis Miller) collected from local garden. Copper (II) sulphate pentahydrate (precursor), Potassium sodium tartrate tetrahydrate and Sodium Hydroxide pellets were purchased from Hi Media Laboratories, Pvt. Ltd. Antibacterial activity was detected against bacterial strain of E.coli, Staphylococcus and Pseudomonas and was studied in Microbiology department of DAV University. The dye removal behavior of CuO-A were studied on methylene blue dye.
Preparation of plant extract and nano-particle
80 g of Aloe vera leaves were washed and chopped finely. The leaves mash was mixed with 100 mL of distilled water. Mixture was boiled for 15 to 20 min at 100 °C. The extract was filtered twice, one time with normal filter paper and second time with Whatmann No.1 filter paper. The extract obtained was then stored at 4 °C [8].
Preparation of CuO-A nanoparticles
Plant extract and copper (II) sulphate pentahydrate were taken in a flask followed by the addition of 100 mL of Fehling solution (50 mL of Fehling solution A + Fehling solution B). The mixture was kept at 80 °C for 2 h in oven, brick red color at the bottom of beaker indicate the formation of CuO-A nanoparticles. The mixture was then washed using distilled water. After washing it was heated at 500 °C in muffle furnace for 3 h. The product obtained was nanoparticles of CuO-A, which was black in color [1]. The synthesized nanoparticles were then stored and further used for different application.
Antibacterial activity
The antibacterial activity against E.coli, Pseudomonas and Staphylococcus was studied using disc diffusion method. The fresh culture of the above said bacteria was grown in broth and then was spread on agar plate. 50 μL of synthesized CuO-A nanoparticles were added using micropipette on sterile disc and zone of inhibition formed were studied [3].
Dye removal behaviour
The methylene blue dye has a molecular formula C16H18N3SCl.3H2O and λmax = 665 nm. Stock solution of the dye was prepared by taking 1000 mg/L in double distilled water. All solution used for dye removal studied was prepared by appropriately diluting the stock solution to a pre-determined concentration. The absorbance was taken in every 30 min after the addition of CuO-A nanoparticles.
Batch adsorption experiment
This experiment was performed in batch adsorption method. The flasks were kept in a orbital shaker at 150 rpm and temperature 300 K for a predetermined time. The different adsorption parameters like contact time, temperature, pH, dye concentration and dosage of the adsorbent were studied. The isotherm study was carried out by taking different initial concentration of methylene blue dye from 100 ppm to 600 ppm by keeping temperature constant. The adsorbent dosage was taken from 0.05 to 0.5 g/L. The kinetic was studied by varying time from 0 to 240 min. Temperature was varying from 300 to 330 K for the thermodynamic study. The absorbance was taken with the help of UV-VIS spectrophotometer at 665 nm. The equilibrium adsorption capacity was evaluated using the equation given below:
| 1 |
Where qe is the equilibrium adsorption capacity, C0 and Ce are the initial and final concentration of dye (mg/L), respectively. V is the volume taken and M is the adsorbent weight.
Results and discussion
Characterization of synthesized nanoparticle
TEM results
The TEM study was employed to analyse the morphology of synthesized nanoparticles. It is quite clear from the results that the synthesized CuO-A NPs are spherical in shape and the size ranging from 33.4–64.9 nm (Fig. 1). The size clearly indicated that the nanoparticle of CuO-A was synthesized [7].
Fig. 1.

TEM results of synthesized CuO-A nanoparticle
FT-IR result
The FT-IR studies are presented in Fig. 2a, b, (Table 1). The frequencies of absorption of copper sulphate penta hydrate and CuO-A are as follow.
Fig. 2.

a, b FTIR spectra of (a) copper sulphate penta hydrate and (b) synthesized CuO-A. nanoparticles.
Table 1.
FTIRs results of copper sulphate penta hydrate and synthesized nanoparticles (CuO-A)
| Sample | Wavelength |
|---|---|
| Copper sulphate penta hydrate | 3119,2490,2094,1644,1062,858,602,523,427 |
| CuO-A | 3467,2666,2350,2118,1661,1452,1115,1008,420 |
The FTIR spectra of copper sulphate penta hydrate showed peak at 3119 and are absent in synthesized CuO-A nanoparticles indicating the binding of metal and formation of nanoparticles. The pecks between 3228 and 3119 are due to carboxylic acid in copper sulphate penta hydrate and. The peck at 3467 present in CuO-A is due to amines (Table 1, Fig. 2a, b). The plant protein present may be responsible for the binding of metal, it form a capping layer on copper nanoparticles [27].
Effect of pH
The effect of pH on dye removal was studied. In the present work pH was varied from acidic to alkaline (i.e. pH 1–10). The maximum adsorption with initial concentration of dye 100 mg/L was studies with 200 mg of the nanoparticle dosage. The reaction mixture was kept in a shaker for 2 h with shaking speed 150 rpm at 300 ± 2 K. The maximum adsorption (98.87%) (Fig. 3) was found at basic pH 7–9. It was well known that at higher pH more than 10, the colour of the dye was self fed due to the formation of new species.
Fig. 3.

Effect of pH on dye removal through CuO-A
The dye removal was lower in acidic pH due to the fact that at lower pH, the number of positively charge sites increased at the expense of negatively charged surface sites. At lower pH carboxylic acid group of the dye (pKa = 10.3) were protonated and had high positive charge density. The electrostatic repulsion forces between the the positively charged surface and dye molecules increased as the pH of the solution is increased, which results in the decrease in the adsorption of the dye on synthesized nanoparticls. In contrary to this the functional groups like carbonyl, hydroxyl etc. can act as bioabsorbing agents or sites with sites with negative charge. The adsorbent surface is negatively charged in alkaline condition and this favoured the adsorption of positively charged dye molecules because of the attractive forces of electrostatics. This showed that the dye adsorption increased in the synthesized nanoparticle as the pH increased.
Effect of time
Effect of time on the percentage dye removal was studied by taking initial dye concentration 100 mg/L and the adsorbent taken was 100 mg. The dye uptake was initially faster, corresponding to maximum removal 97.84% at an equilibrium time of 180 min. Initially the absorption of dye was faster, then it started decreasing, this may be due to the unavailability of active bare surface for the dye absorption. The relative increase in the dye removal after contact time 180 min. Was not significant as it was fixed as the optimum contact time for the maximum removal of dye. As this is the batch type absorption process, so a monolayer of dye is normally formed on the adsorbent surface and the rate of dye removal from aqueous solution is controlled primarily by the rate of transport of dye from the exterior/outer sites to the interior site of the adsorbent particles.
Effect of initial dye concentration
The influence of the initial dye concentration in the solution on the rate of its absorption on synthesized nanoparticles was investigated. The experiment was carried out at fixed adsorbent dosage, optimal pH and temperature. The adsorption percentage decreased with an increase in initial dye concentration. The adsorption capacity was increased from 21.56 to 98.1 mg/g as the concentration of dye increased from 100 to 500 mg/L. Maximum dye sequestration occurred within 180 min. After the addition of synthesized nanoparticles in the dye solution. After 180 min. Maximum dye sequestration, equilibrium was attained. With further increase in dye concentration the interaction between the dye and the adsorbent increased apart from providing necessary driving force to overcome. This showed that dye uptake increased with increase in concentration until equilibrium was attained, as the equilibrium attained there is no more uptake of the dye due to absence of void space for the dye absorption.
Effect of adsorbent dosage and agitation
The percent adsorption increased as the adsorbent dosage increased from 0.05 to 0.4 g at 100 mg/L dye concentration. There was 98.89% dye removal was observed with 11.50 mg/g amount adsorbed. The percent adsorption increases with increase in the adsorbent dosage and when reach maximum it started decreasing with further increase in the adsorbent dosage may be due to the fact that the number of available adsorption sites and the surface area increases as the adsorbent dosage increases and results in increase adsorption of dye. As equilibrium formed, there is decrease in the adsorption, this may be attributed due to overlapping or aggregation of adsorption sites leads to decrease in available adsorbent surface area available for methylene blue and also there is increase in diffusion path length.
The agitation speed has also an impact on dye adsorption. The agitating speed varies from 50 to 300 rpm. It was found that from 150 rpm, there is no disparity; it remains constant with the percent removal of methylene blue.
Adsorption isotherm
It is very important to optimise the design of an adsorption system for dye removal to get the best results and establish the best correlations of the system and equilibrium data. The results of the experiments were described through different equilibrium isotherm equations. The parameters obtained from the different models give important information regarding surface properties of the adsorbent, affinities of the adsorbent and adsorption mechanisms.
Langmuir and Freundlich models are widely accepted for single-solute adsorption system. The correlation between the amount of adsorption and liquid phase concentration was tested with both of these models. Best-fitting isotherm was determined through linear regression and its applicability was judged by correlation coefficients.
Langmuir isotherm
The Langmuir isotherm is applicable for the adsorption of a solute from a liquid solution as a monolayer adsorption on a surface having a large number of identical sites. This model assumes uniform energies of adsorption onto the surface and there is no transmigration of the adsorbate in the plane of the surface. So, this model was mainly chosen for the estimation of the maximum adsorption capacity and this only correspond to the monolayer surface of the adsorbent [2, 20]. The Langmuir equation is given as:
| 2 |
Where KL is Langmuir isotherm constant (L/mg), qm is the monolayer adsorption capacity (mg/g), The values of qm and KL can be calculated by plotting Ce/qe versus Ce (Fig. 4). Langmuir isotherm can be expressed in terms of a dimensionless constant separation factor (RL). RL can be defined by:
| 3 |
Fig. 4.

Langmuir isotherm for dye adsorption on synthesized nanoparticle
The RL values specify isotherm type, RL > 1, then itsunfavourable, RL = 1 indicate the linear and (0 < RL < 1) indicate the favourable and RL = 0 means irreversible. The present result showed RL between 0.8563 and 0.04653, which clearly indicated that adsorption was favourable.
Freundlich isotherm
Freundlich equation was employed for methylene dye adsorption on the synthesized adsorbent. It can be represented as [6, 19]:
| 4 |
Where Ce is the dye concentration at equilibrium (mg/L), qe is the amount of the dye absorbed (mg/g), Kf and n are constants integrate the factors which affect the adsorption capacity and intensity of adsorption, respectively.
The plot log qe versus log Ce shows linear plot (Fig. 5), which means methylene dye follow the Freundlich adsorption isotherm. It is clear from the value of Kf and n that as the negative charges increases on the adsorbent surface the electrostatic forces increases between the dye and the adsorbent surface. The size and molecular weight might be limit factors. The values clearly indicate the increase in adsorption capacity, this indicated the intensity of the bond energies between adsorbent surface and dye, and this indicated that there is possibility of chemisorptions rather than physio-sorption.
Fig. 5.

Freundlich isotherm for dye adsorption on synthesized CuO-A nanoparticles
The results indicated that this adsorption is better fitted for Langmuir isotherm model than the Freundlich isotherm (Table 2) and concluded that there were chemisorptions.
Table 2.
Langmuir and Freundlich constant for the adsorption of methylene blue on synthesized nanoparticles (CuO-A)
| Langmuir constants | Freundlich constants | ||||
|---|---|---|---|---|---|
| qm (mg/g) | KL (L/mg) | R2 | Kf | n | R2 |
| 36.52 | 0.029 | 0.981 | 12.09 | 5.47 | 0.927 |
Kinetics study of adsorption
To study the kinetics of dye adsorption onto the adsorbent surface the optimal operating condition for the batch process is required. The kinetic parameters, which have impact on predicting the adsorption rate, provide important information for designing the adsorption process. There are many adsorption models which are helpful in investigating the mechanism of adsorption. In the present study the two well known models were investigated to find the best fitted model for the experimental data [17, 18].
The kinetics was studied with the Lagergren’s pseudo first order equation:
| 5 |
Where qt and qe are the amount of dye adsorbed at time t and equilibrium (mg/g), respectively. KI is the pseudo first order rate constant for the adsorption process (min−1). The pseudo second order model can be represented as:
| 6 |
Where k2 is the pseudo second order (g/mg min) rate constant. Kinetic constants are calculated from slope and intercept of plots for both are given in Table 3, which depicts that this model is better fitted for pseudo first order as compared to pseudo second order [28]. The plots of log (qe -qt) versus t and plots of t/qt versus t are shown in Figs. 6 and 7, respectively.
Table 3.
Kinetic parameters for the effect of temperature on methylene blue removal
| Pseudo first-order | Pseudo second order | Intraparticle diffusion | Boyd diffusion coefficient | ||||||
|---|---|---|---|---|---|---|---|---|---|
| qe exp. (mg/g) | k1 × 10−3 (min−1) | qe calc. (mg/g) | R2 | k2 × 10−3 (mg/g min) | qe calc. (mg/g) | R2 | Kid (mg/g min1/2) | R2 | Di × 10−5 (cm2/s) |
| 12.89 | 0.62 | 14.01 | 0.97 | 56.42 | 18.42 | 0.97 | 0.843 | 0.98 | 2.18 |
Fig. 6.

Pseudo first order reaction of dye adsorption on synthesized nanoparticle
Fig. 7.

Pseudo second order reaction of dye adsorption on synthesized nanoparticle
Mechanistic study
Intra-particle diffusion plays an important role in the adsorption processes. Plot of the uptake time (qt) versus square root of the time leads to the linear relationship and if the line passed through the origin then intra-particle diffusion is the controlling step and if the line do not pass through the origin then this indicated that not only the intra-particle diffusion is the rate controlling step, but some degree of other boundary layer may also control the rate of adsorption. The most commonly used technique to identify the adsorption mechanism of dye onto synthesized nanoparticles is by fitting the intra-particle diffusion plot. In most common adsorption processes, where uptake varies almost proportionally with the t1/2 rather than the contact time t the following empirical equation was used, which showed the functional relationship:
| 7 |
Where kid represent the intraparticle diffusion rate constant (mg/g min1/2), c is the constant, qt is the amount of dye adsorbed (mg/g) at time t. The intra-particle diffusion rate constant and was depicted from the slope of the linear gradient of the plot qt versus t1/2 (Fig. 8).
Fig. 8.

Intra-particle diffusion plot for dye adsorption on synthesized nanoparticle
The experimental data was interpreted from a mechanistic view point by identifying the steps involved during adsorption by external mass transfer and intra-particle diffusion. It is important to find which is the rate-limiting step in sorption process to design a model. The kinetic data has been analysed with the help of model given by Boyd et al:
| 8 |
and
| 9 |
Where q and qe are the amount of dye adsorbed at time t and at equilibrium (mg/g), respectively. F and Bt are the fraction of the solute adsorbed at any time t and mathematical function of F, respectively.
By substituting eq. (9) from (8) and then simplifying, the equation becomes
| 10 |
Or
| 11 |
Bt values at different time was calculated using the equation (iv). Figure 9 Showed the Bt values against time t. The linearity in plot is helpful in distinguishing which control the adsorption rate: external or intra-particle transport control. It was quite clear from the Fig. 9 that the relation between Bt and t was linear at all the dye concentration, but was not originate from the origin, which confirm that rate-limiting step is surface diffusion [9]. The Bt value was used to calculate the effective diffusion coefficient, Di (cm2/s) using the below relation:
| 12 |
Where r is the radius of the particle. The estimated value of average Di was 2.1534 × 10⁻⁴ cm2/s. The diffusion coefficient (Di) and rate constant of intra-particle diffusion is given in Table 3.
Fig. 9.
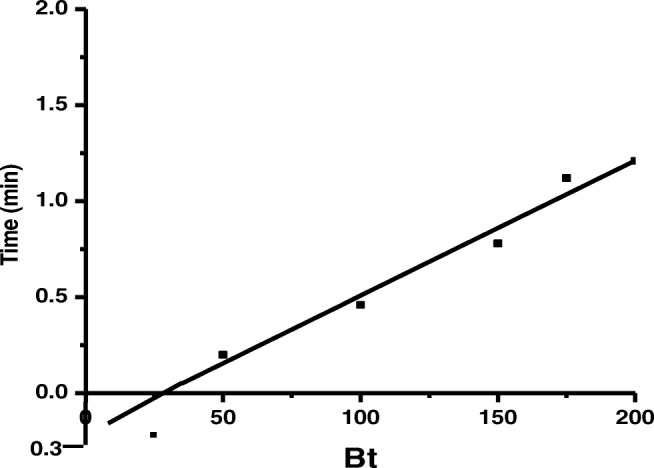
Boyd ploy of dye adsorption on synthesized nanoparticle
Effect of temperature on dye adsorption
As we know that adsorption processes are temperature dependant, adsorption capacity of the adsorbent increased as there is increase in temperature. In the present study temperature was varied from 303 to 343 K. The dye adsorption was increased from 89.56 to 97.39 mg/g with respect to temperature. All the reaction conditions were kept constant while studying the effect of temperature on dye adsorption.
It is very important to determine the thermodynamic parameter such as standard enthalpy change ∆H°, standard Gibb’s free energy change ∆G° and standard entropy change ∆S°. Standard enthalpy change ∆H° and standard entropy change ∆S° were calculated by using Van’t Hoff equation:
| 13 |
Where R and T are gas constant and temperature (K), respectively. kc is the equilibrium constant for sorption. The slope of the linear regression of ln kc versus 1/T was used to calculate the value of ∆H° (Fig. 10). Kc was determined by using the equation given below:
| 14 |
Where Ce and qe are the equilibrium concentration of dye at solution (mg/L) and amount of dye adsorbed onto synthesized nanoparticle at equilibrium (mg/L).
Fig. 10.

Van’t Hoff plots for dye adsorption on synthesized nanoparticle
The Gibbs free energy change (∆G°) for dye sorpion onto synthesized nanoparticle is calculated by using equilibrium constant kc as given below:
| 15 |
The thermodynamic parameter calculated using the equation is given in Table 4. The value of ∆G° gives an idea of type of adsorption. The average value of ∆G° was found to be −4.689kJ/mol and the negative values of the ∆G° were due to the spontaneous nature of sorption. This showed the affinity of dye for the synthesized nanoparticle. The positive value of ∆H° showed the endothermic nature of interaction between dye and synthesized nanoparticles. The standard entropy determined the disorderness occurred at solid-liquid interface.
Table 4.
Thermodynamic parameters of CuO-A
| T (K) | ∆G° (kJ/mol) | ∆H° (kJ/mol) | ∆S° (J/mol K) |
|---|---|---|---|
| 303 | −2.941 | 1.468 | 6.542 |
| 308 | −3.386 | ||
| 313 | −3.532 | ||
| 318 | −3.732 | ||
| 323 | −3.821 | ||
| 333 | −3.976 | ||
| 343 | −4.024 |
Antibacterial activity
The antibacterial activity of synthesized CuO-A nanoparticles was detected using disc diffusion method. The synthesized CuO-A nanoparticles showed good antibacterial activity against the bacterial strain of E.coli, Pseudomonas, Klebsiella and Staphylococcus. The synthesized nanoparticles was taken in two different concentration 20 μl and 50 μl. It was clear from the results that zone of inhibition increases as concentration of the nanoparticle increases. The zone of inhibition was found to be 11 mm, 12 mm, 8 mm and 9 mm in Pseudomonas, Klebsiella, Staphylococcus and E.coli, respectively (Fig. 11a-d). Activity of our synthesized nanoparticles was good enough against the bacterial strain.
Fig. 11.

a-d Antibacterial activity of synthesized nanoparticle against (a) Pseudomonas; (b) Klebsiella; (c) Staphylococcus and (d) E.coli.
Conclusion
Copper oxide nanoparticles was successfully biosynthesized. The biosynthesis method was eco-friendly and cost-effective. The authenticity of nano-particle synthesis was confirmed through TEM results. The synthesized nano-particle was used for the removal of hazardous dye methylene blue. The maximum dye removal was found to be 98.89% with initial concentration of 100 mg/L at alkaline pH in 210 min., with shaking speed of 150 rpm at 310 K. The adsorption studies showed that the adsorption was best fitted to the Langmuir isotherm model as compared to the Freundlich isotherm model. The results of adsorption kinetics showed that adsorption followed pseudo first-order kinetic equation for sorption of methylene blue onto synthesized nanoparticles. Thermodynamic study showed the spontaneous and endothermic nature of biosorption process due to positive value of enthalpy change and negative value of free energy change. Synthesized nanoparticles also have very good antibacterial activity against different strains like Pseudomonas, Klebsiella, Staphylococcus and E.coli. It was concluded from the foregone discussion that the synthesized nanoparticles could be a good alternative for the removal of methylene blue from aqueous solution very effectively.
Acknowledgements
One of the author Ms. Priyanka Thakur is grateful to DAV University Jalandhar, for giving all the laboratory facilities and infrastructure to perform present work.
Footnotes
Publisher’s note
Springer Nature remains neutral with regard to jurisdictional claims in published maps and institutional affiliations.
References
- 1.Anantharaman A, George L, George M. Green synthesis of copper oxide nanoparticles and its applications. International Journal of Advance Research in Science and. Engineering. 2016;5(9):522–529. [Google Scholar]
- 2.Arivoli S, Hema M, Martin P, Prasath D. Adsorption of malachite green onto carbon prepared from borassus bark. Arab J Sci Eng. 2009;34(2):31. [Google Scholar]
- 3.Bauer AW, Kirby WM, Sherris JC, Turck M. Antibiotic susceptibility testing by a standardized single disk method. Am J Clin Pathol. 1966;45(4):493–496. doi: 10.1093/ajcp/45.4_ts.493. [DOI] [PubMed] [Google Scholar]
- 4.Blance DS, Carrara P, Zanetti G, Francioli P. Water disinfection with ozone, copper and silver ions, and temperature increase to control legionella. J Hosp Infect. 2005;60:69–72. doi: 10.1016/j.jhin.2004.10.016. [DOI] [PubMed] [Google Scholar]
- 5.Feynman R. There's plenty of room at the bottom. Science. 1991;254:1300–1301. doi: 10.1126/science.254.5036.1300. [DOI] [PubMed] [Google Scholar]
- 6.Hema M, Arivoli S. Adsorption kinetics and thermodynamics of malachite green dye onto acid activated low cost carbon. J Appl Sci Environ Manage. 2008;12:43. [Google Scholar]
- 7.Hutchison JE. Greener nanoscience: a proactive approach to advancing applications and reducing implications of nanotechnology. ACS Nano. 2008;2(3):395–402. doi: 10.1021/nn800131j. [DOI] [PubMed] [Google Scholar]
- 8.Kulkarni VD, Kulkarni PS. Green synthesis of copper nanoparticles using Ocimum Sanctum leaf extract. International Journal of Chemical Studies. 2013;1(3).
- 9.Kumar KV, Ramamurthi V, Sivanesan S. Biosorption of malachite green, a cationic dye onto Pithophora sp., a fresh water algae. Dyes Pigments. 2006;69:102–107. doi: 10.1016/j.dyepig.2005.02.005. [DOI] [Google Scholar]
- 10.Mazzola L. Commercializing nanotechnology. Nat Biotechnol. 2003;21:1137–1143. doi: 10.1038/nbt1003-1137. [DOI] [PubMed] [Google Scholar]
- 11.Murray CB, Kagan CR, Bawendi MG. Synthesis and characterization of monodisperse nanocrystals and close-packed nanocrystal assemblies. Annu Rev Mater Sci. 2000;30:545–610. doi: 10.1146/annurev.matsci.30.1.545. [DOI] [Google Scholar]
- 12.Parthasarathy G, Saroja M, Venkatachalam M, Shankar S, Evanjelene VK. Green synthesis of zinc oxide nanoparticles. World journal of pharmacy and pharmaceutical sciences. 2016;5(4):922–931. [Google Scholar]
- 13.Paull R, Wolfe J, Hebert P, Sinkula M. Investing in nanotechnology. Nat Biotechnol. 2003;21:1134–1147. doi: 10.1038/nbt1003-1144. [DOI] [PubMed] [Google Scholar]
- 14.Rajeswari R, Umadevi M, Rahale CS, Pushpa R, Selvavenkadesh S, Kumar KPS, Bhowmik D. Aloe vera: The Miracle Plant Its Medicinal and Traditional Uses in India. Journal of Pharmacognosy and Phytochemistry. 2012;1(4):118–124. [Google Scholar]
- 15.Raut RW, Lakkakula JR, Kolekar NS, Mendhulkar VD, Kashid SB. Phytosynthesis of silver nanoparticle using Gliricidia sepium (Jacq.) Curr Nanosci. 2009;5:117–122. doi: 10.2174/157341309787314674. [DOI] [Google Scholar]
- 16.Rodriguez JA, Liu P, Hrbek J, Evans J, Perez M. Water gas shiftreaction on cu and au nanoparticles supported on CeO2(111) and ZnO(0001): intrinsic activity and importance of support interactions. Angew Chem Int Ed. 2007;46:1329–1332. doi: 10.1002/anie.200603931. [DOI] [PubMed] [Google Scholar]
- 17.Saha P, Chowdhury S, Gupta S, Kumar I, Kumar R. Assessment on the removal of malachite green using tamarind fruit shell as biosorbent. Clean Soil Air Water. 2010;38(5–6):437–445. doi: 10.1002/clen.200900234. [DOI] [Google Scholar]
- 18.Santhi T, Manonmani S, Smitha T. Removal of malachite green from aqueous solution by activated carbon prepared from the epicarp of Ricinus communis by adsorption. J Hazard Mater. 2010;179:178–186. doi: 10.1016/j.jhazmat.2010.02.076. [DOI] [PubMed] [Google Scholar]
- 19.Saruchi KV. Adsorption kinetics and isotherms for the removal of rhodamine B dye and Pb+2 ions from aqueous solutions by a hybrid ion-exchanger. Arab J Chem. 2016. 10.1016/j.arabjc.2016.11.009.
- 20.Saruchi VK, Kaith BS. Synthesis of hybrid ion exchanger for rhodamine B dye removal: equilibrium, kinetic and thermodynamic studies. I & EC Research. 2016;55(39):10492–10499. [Google Scholar]
- 21.Shankar SS, Rai A, Ahmad A, Sastry M. Rapid synthesis of au, ag, and bimetallic au core-ag shell nanoparticles using neem (Azadirachta indica) leaf broth. J Colloid Interface Sci. 2004;275:496–502. doi: 10.1016/j.jcis.2004.03.003. [DOI] [PubMed] [Google Scholar]
- 22.Song X, Sun S, Zhang W, Yin Z. A method for the synthesis of spherical copper nanoparticles in the organic phase. J Colloid Interface Sci. 2004;273(2):463–469. doi: 10.1016/j.jcis.2004.01.019. [DOI] [PubMed] [Google Scholar]
- 23.Surjushe A, Vasani R, Saple DG. Aloe Vera. Indian J Dermatol. 2008;53(4):163–166. doi: 10.4103/0019-5154.44785. [DOI] [PMC free article] [PubMed] [Google Scholar]
- 24.Talebi S, Ramezani F, Ramezani M. Biosynthesis of metal nanoparticles by micro-organisms. Nanocon Olomouc, Czech Republic, EU. 2010;10:12–18. [Google Scholar]
- 25.Taniguchi, Norio, 1974. "On the basic concept of 'Nano-Technology'". Proceedings of the international conference on production engineering, Tokyo. Part II. Japan Society of Precision Engineering.
- 26.Theivasanthi T, Alagar M. Studies of copper nanoparticles effects on micro- organisms. Annals of Biological Research. 2011;2(3):82–87. [Google Scholar]
- 27.Valodkar M, Jadeja RN, Thounaojam MC, Devkar RV, Thakorea S. Biocompatible synthesis of peptide capped copper nanoparticles and their biological effect on tumor cells. Mater Chem Phys. 2011;128:83–89. doi: 10.1016/j.matchemphys.2011.02.039. [DOI] [Google Scholar]
- 28.Zhang J, Li Y, Zhang C, Jing Y. Adsorption of malachite green from aqueous solution onto carbon prepared from Arundo donax root. J Hazard Mater. 2008;50:774. doi: 10.1016/j.jhazmat.2007.05.036. [DOI] [PubMed] [Google Scholar]