Abstract
Background
Insulin resistance is an inadequate metabolic response of the peripheral tissue to circulating insulin. It plays an important pathophysiological role in type 2 diabetes mellitus. The purpose of the study was to investigate the molecular effects of rice bran oil (RBO) on the gene expression of insulin receptor (IR), insulin receptor substrate-1 (IRS-1), glucose transporters-4 and 5 (GLUT-4 and 5) in insulin-resistant rats induced by high fructose diet (HFD).
Methods
Rats were divided into six groups (10 rats each) as follows: Groups 1 and 2: rats received a standard diet with corn oil or RBO (as the sole source of fat), respectively. Group 3: animals fed on HFD, which was furtherly divided into 2 sub-groups: rats fed HFD either for one (HFD1) or for 2 months (HFD2). Group 4, rats fed HFD containing RBO for 1 month (HFD1 + RBO), while rats in group 5 fed HFD for 30 days then RBO was added to the diet for another 30 days (HFD2 + RBO). Serum levels of glucose and insulin, as well as hepatic gene expression of insulin receptors and glucose transporters were determined. Livers were isolated for histopathological study.
Results
HFD induced insulin resistance with a reduction in the hepatic level of insulin receptor and glucose transporters at both protein and molecular levels. Addition of RBO improved the insulin sensitivity and up-regulated the expression of the tested genes.
Conclusion
HFD impaired the insulin sensitivity of the hepatocytes by down-regulating the insulin receptor genes. Addition of RBO alleviated all the hazardous effects.
Electronic supplementary material
The online version of this article (10.1007/s40200-019-00394-2) contains supplementary material, which is available to authorized users.
Keywords: Insulin resistance, Rice bran oil, Insulin receptors, Glucose transporters
Introduction
Insulin resistance is increasing at an alarming rate, becoming a major public and clinical problem worldwide. Insulin resistance is defined as an impaired ability of insulin to promote glucose uptake and exert its metabolic effects in the liver, skeletal muscle and adipose tissue [1, 2]. Experimental studies in animals documented that the general increase in fructose consumption is correlated with hyperglycemia, dyslipidemia and insulin resistance [3–5]. Fructose, a simple sugar found in honey, fruit, and high-fructose corn syrup, has a unique metabolism that results in oxidative stress and lipogenesis [6, 7]. Fructose intake has increased markedly due to the increased intake of beverages sweetened with sucrose (50% fructose) and high fructose corn syrup (55–90% fructose) [8].
Rice bran oil (RBO) is unique among edible oil as a result of its nutritional and functional properties such as γ-oryzanol, phytosterols, and tocopherols [9]. These bioactive compounds reduce oxidative stress which causes many diseases such as diabetes, cancers, and neurodegenerative diseases [10]. Several studies have demonstrated that RBO possesses hypoglycemic activity [5, 11] since chronic exposure to hyperglycemia may induce dysregulation of gene expression that converges on impaired insulin secretion and increased apoptosis [12].
Since insulin serves as the major physiological anabolic hormone, promoting the synthesis and storage of glucose, this study was designed to monitoring the metabolic effects of the RBO on the expression of two insulin signaling genes, insulin receptor (IR) and insulin receptor substrate-1 (IRS-1), glucose transporter 5 (GLUT5) and glucose transporter 4 (GLUT4) in insulin-resistant rat liver, as a central organ in carbohydrate metabolism.
Materials and methods
Animals
A total of 60 adult female Sprague Dawley rats weighing 140–220 g were used throughout this study. Animals were purchased from the breeding unit of the Egyptian Organization for Biological Products and Vaccines (Helwan, Egypt), and were housed in steel mesh cages (4/cage). Rats were maintained for a week acclimatization period on a commercial pellet diet. Food and water were provided ad libitum.
Preparation of diets
The standard, high fructose (60 g/100 g) diets and the diet containing 10% RBO were prepared as previously described [13, 14].
Study design
Rats were allocated into 5 groups. Normal Control group (NC): Rats fed standard diet. Rice Bran Oil group (RBO): Rats fed standard diet contains 10% RBO as the sole source of fat. High Fructose Diet group (HFD): this group was subdivided into 2 sub-groups: rats fed HFD for only 1 month (HFD1) and rats fed HFD for 2 months (HFD2) serving as reference groups for the corresponding treated groups. Rats fed HFD containing 10% RBO for 1 month (HFD1+ RBO). Rats in this group fed HFD for 30 days and then received HFD with 10% RBO for another 30 days (HFD2+ RBO). Animals were maintained in their designed groups for 4 weeks except group 5.
Body weight of the animals in all groups was recorded weekly and body weight gain was calculated at the end of the feeding period. All animal experiments were carried out in accordance with the principles outlined in the Declaration of Helsinki (Adopted by the 18th WMA General Assembly, Helsinki, Finland, June 1964).
Blood collection and tissue sampling
Rats were anesthetized with Urethane (99%, Aldrich) at a dose of 1 g/kg body weight intraperitoneally, and then blood samples were taken from the retro-orbital venous plexus after overnight fasting. Blood was immediately centrifuged. Serum samples were aliquoted and stored at −20 °C until aminotransferases and insulin analyses, except for fasting glucose which was determined on the same day without delay.
The liver was quickly excised and rinsed from blood in phosphate buffer saline (PBS, pH 7.4), dried and weighed. The entire liver was divided into weighed portions, one portion was dropped into a test tube containing 30% (w/v) KOH for glycogen determination, another part was used for determination of insulin receptor (IR) and insulin receptor substrate-1 (IRS-1) and the third part of the fresh liver tissue was used for RNA extraction for PCR.
Biochemical assay
Serum alanine aminotransferase (ALT) and aspartate aminotransferase (AST) were measured using commercial assay kits (Diamond Diagnostics, Egypt). Fasting serum glucose level was assayed by the enzymatic colorimetric method [15], while serum insulin was assayed using the enzyme-linked immunoassay (Rat insulin ELISA kit, Glory science Co., USA) [16]. Homeostasis model assessment insulin resistance index (HOMA-IR) was calculated: HOMA- IR = [Fasting insulin (μIU/ml) × fasting glucose (mmol/L)] / 22.5 [17]. Hepatic glycogen was determined by the colorimetric method [18]. Immunoblotting was performed to examine the protein levels of hepatic insulin receptor (IR) and insulin receptor substrate-1 (IRS-1) [19].
Polymerase chain reaction (PCR)
Total hepatic RNA was extracted using TRIzol® Reagent (Invitrogen, Carlsbad, CA), treated with DNase I and then 1 μg of total RNA was used to synthesize cDNA using high-capacity cDNA reverse transcription kits (Promega, Madison, WI, USA) in accordance with the manufacturer’s instructions. For real-time PCR, cDNA and primers were prepared with a SYBR Green PCR master mix (Applied Biosystems) according to the manufacturer’s instructions. The primer sequences of IR, IRS-1, and glucose transporters 4 and 5 (GLUT-4 and GLUT-5) used for real-time PCR are shown in Table 1. All values were normalized to β-actin which was used as the control housekeeping gene.
Table 1.
Primers sequences
| Genes | Primer sequence | Product length (bp) | Accession No |
|---|---|---|---|
| IR |
Forward: 5′CTTCTCGCGGAGTATGTCCC3′ Reverse: 5’CAGCACCGTTCCACAAACTG3′ |
703 | NM_017071.2 |
| IRS1 |
Forward: 5′CTGCATAATCGGGCAAAGGC3′ Reverse: 5′CATCGCTAGGAGAACCGGAC3′ |
916 | NM_012969.1 |
| GLUT4 |
Forward: 5′GATTCTGCTGCCCTTCTGTC3′ Reverse: 5′ATTGGACGCTCTCTCTCCAA3′ |
168 | XM_006246596.3 |
| GLUT5 |
Forward: 5′GTGTCTGTGACACTGGGAGG3′ Reverse: 5’GTGACATGGCTGGGTCAGAA3′ |
439 | NM_031741.1 |
| β-actin |
Forward: 5′TCTGGCACCACACCTTCTACAATG3′ Reverse: 5′AGCACAGCCTGGATAGCAACG3′ |
166 | NM_031144.3 |
bp Base pair
Histological analysis
Liver sections (three independent rats from each group) were fixed in 10% neutral-buffered formalin then were paraffin embedded. The paraffin embedded sections were cut into 4-μm slices and stained with hematoxylin and eosin.
Statistical analysis
Data are expressed as means ± standard error of mean. Differences between the mean values were assessed with one way analysis of variance (ANOVA) and followed by post-hoc test (least significant difference analysis, LSD). A p value ≤0.05 was considered significant. The statistical analyses were applied using computer-based software (SPSS) version 16.
Results
Body weight gain
Non-significant changes in the body weight gain were observed in HFD-fed rats (HFD1), while the addition of RBO (HFD1 + RBO) producing significant reduction (p < 0.02), compared to the control group. However, feeding HFD for 8 weeks (HFD2) increased significantly (p < 0.03) the body weight gain, compared to HFD1 group (Table 2).
Table 2.
Summary of the effect of RBO body weight gain and serum levels of ALT, AST, glucose and insulin in addition to calculated HOMA-IR and hepatic glycogen concentration in all experimental groups
| Groups | Body weight gain (%) | ALT (U/L) |
AST (U/L) |
Glucose (mg/dL) |
Insulin (mU/L) |
HOMA-IR | Glycogen (g/100 g liver) |
|---|---|---|---|---|---|---|---|
| NC | |||||||
| Mean ± SE | 7.40 ± 1.2 | 26.45 ± 1.10 | 13.47 ± 0.69 | 120 ± 3.95 | 7.46 ± 0.36 | 2.24 ± 0.11 | 0.82 ± 0.26 |
| Range | (0.00–11.76) | (21.67–29.99) | (11.33–16.32) | (108–136) | (6.50–10.1) | (1.81–275) | (0.53–1.09) |
| RBO | |||||||
| Mean ± SE | 7.60 ± 1.32 | 32.61 ± 0.94 | 17.93 ± 1.05a | 117.6 ± 4.37 | 8.85 ± 0.36 | 2.56 ± 0.13 | 0.81 ± 0.57 |
| Range | (1.25–14.29) | (29.00–37.6) | (13.65–23.32) | (90–134) | (7.50–10.5) | (1.67–3.00) | (0.26–1.78) |
| HFD1 | |||||||
| Mean ± SE | 6.57 ± 0.87 | 40.54 ± 3.09ab | 8.42 ± 0.28ab | 180.4 ± 10.13ab | 14.64 ± 0.83ab | 5.37 ± 0.56ab | 2.51 ± 0.88ab |
| Range | (2.78–10) | (29.00–52.00) | (7.00–9.66) | (134–230) | (10.6–16.7) | (2.24–7.33) | (1.76–4.07) |
| HFD1 + RBO | |||||||
| Mean ± SE | 3.52 ± 1.06ab | 32.14 ± 1.83c | 9.70 ± 0.25ab | 142.7 ± 2.48abc | 11.79 ± 0.75abc | 4.14 ± 0.26abc | 1.47 ± 0.74abc |
| Range | (0.00–10) | (27.01–43.34) | (8.33–10.66) | (135–159) | (9.03–14.90) | (3.05–5.33) | (0.55–2.86) |
| HFD2 | |||||||
| Mean ± SE | 10.34 ± 1.08c | 35.95 ± 3.9a | 12.12 ± 1.13c | 134.2 ± 4.93c | 21.54 ± 1.16ac | 7.17 ± 0.55abc | 1.37 ± 0.25abc |
| Range | (6.25–13.89) | (25.00–56.47) | (9.66–18.6) | (121–161) | (17.6–25.5) | (5.51–10.13) | (1.15–1.78) |
| HFD2 + RBO | |||||||
| Mean ± SE | 9.8 ± 1.35 | 26.86 ± 1.53d | 11.89 ± 0.66b | 125.5 ± 7.23 | 11.55 ± 0.73abd | 3.53 ± 0.26ad | 1.02 ± 0.36 |
| Range | (3.13–16.67) | (22.00–36.92) | (9.66–15.36) | (99–148) | (8.90–15.7) | (2.64–5.58) | (0.62–1.43) |
aSignificance vs NC
bSignificance vs RBO
cSignificance vs HFD1
dSignificance vs HFD2, the mean difference is significant at p < .05, each group contains 10 rats
Serum ALT and AST levels
Serum ALT levels in HFD1 and HFD2 were significantly elevated (p < 0.001) as compared to the control. However, significant reductions (p < 0.01) were observed in both (HFD1 + RBO) and (HFD2 + RBO) groups, compared to HFD1 and HFD2 groups, respectively. With regard to the serum level of AST, significant reduction (P < 0.001) was recorded in HFD1 and HFD1 + RBO, compared to control group. Serum AST showed significant elevation (P < 0.001) in HFD2 group, compared to HFD1 group (Table 2).
Histological analysis
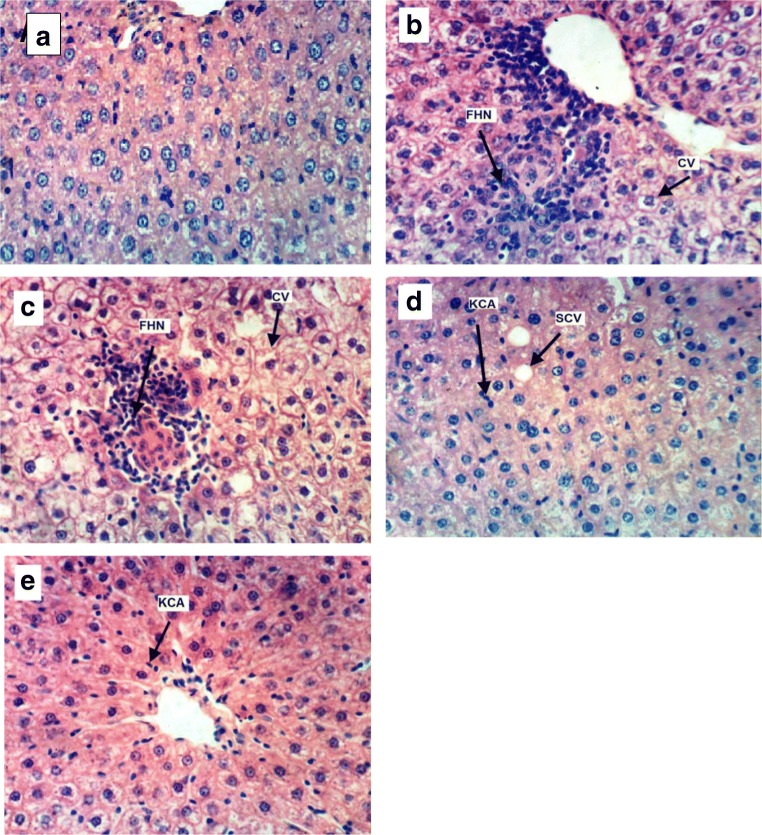
Histopathological observations of H&E staining of livers were performed as supporting evidence in biochemical analysis. Figure 1a showed the normal morphological characteristics of the hepatic cells, whereas the hepatic cells of HFD-fed rats (for 1 and 2 months) showed cytoplasmic vacuolation and focal hepatic necrosis associated with mononuclear cells infiltration as illustrated in Fig. 1 (b and c, respectively). Slight cytoplasmic vacuolation of hepatocytes of HFD1 + RBO group, in addition to activation of Kupffer cells of HFD1 + RBO and HFD2 + RBO groups were observed in Fig. 1 (d and e, respectively).
Fig. 1.
Histopathological examination by light microscope of liver cells from control (a), HFD fed groups for one (b) and 2 (c) months and RBO groups [HFD1 + RBO (d) and HFD2 + RBO (e)] (X400- H & E). CV: Cytoplasmic vacullation, FHN: Focal hepatic necrosis, KCA: Kupffer cells activation, SCV: Slight cytoplasmic vacillation
Glucose, insulin and HOMA-IR
Current results showed a state of moderate insulin resistance in the fructose-fed rats, as demonstrated by hyperinsulinemia and the increase of HOMA-IR value in HFD1 and HFD2 groups. Beside, hyperglycemia was observed in rats fed HFD for 4 weeks, while rats fed HFD diet for 8 weeks revealed significant reduction in serum glucose (p < 0.01), compared to those fed HFD for 4 weeks (Table 2).
In spite of the improvement in the serum insulin level in (HFD1 + RBO) and (HFD2 + RBO) groups (p < 0.01 and p < 0.001, respectively), compared to their respective control groups (HFD1 and HFD2), but insulin level still highly elevated than the control group. Addition of RBO to the HFD diet (HFD1 + RBO) improves serum glucose (p < 0.001), as compared to HFD1. Moreover, the HFD contains RBO (HFD1 + RBO and HFD2 + RBO) reduced HOMA-IR significantly (p < 0.02 and p < 0.001, respectively) as compared to their respective control group.
Hepatic glycogen concentration
Rats fed on HFD for 4 and 8 weeks showed a significant elevation in hepatic glycogen concentration especially in HFD1 group. However, rats fed on the diets containing RBO revealed reduced levels (Table 2).
Hepatic IR and IRS-1 by western blot
Hepatic insulin receptor (IR) concentrations were significantly reduced (p < 0.001) in rats fed high fructose (HFD1 and HFD2), compared to NC group (Fig. 2). HFD1 group revealed a highly significant reduction (p < 0.001), compared to RBO group, while rats fed HFD for 2 months revealed significant elevation in hepatic IR concentration (p < 0.025) as compared to rats fed HFD for only 1 month. Although HFD1 + RBO and HFD2 + RBO groups revealed a highly significant increase in hepatic IR concentrations (p < 0.001) as compared to their corresponding controls (HFD1and HFD2, respectively), HFD1 + RBO group was significantly reduced (p < 0.017), compared to NC rats.
Fig. 2.
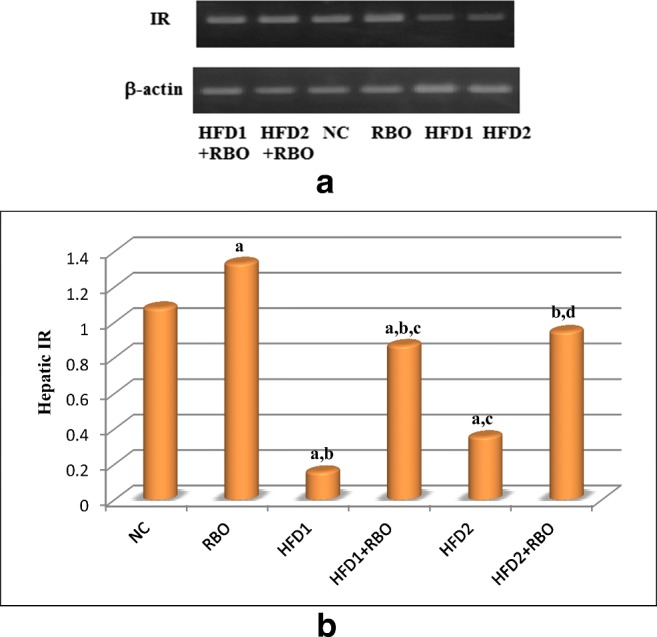
Effect of RBO on hepatic insulin receptor. Effects on protein expression of the hepatic IR were determined by western blotting (a). The effects of RBO were analyzed using ANOVA followed by least significant difference analysis (LSD) for multiple comparisons (b). The mean difference is significant at p < 0.05. Each group contained 10 rats. a: significance vs NC, b: significance vs RBO, c: significance vs HFD1, d: significance vs HFD2
As regards to hepatic insulin receptor substrate-1 (IRS-1) concentration, a significant reduction was observed in HFD1 and HFD2 (p < 0.001) groups, compared to NC group (Fig. 3). Although HFD1 + RBO and HFD2 + RBO groups revealed a highly significant increase in hepatic IRS-1 concentrations (p < 0.001) as compared to their corresponding control (HFD1and HFD2, respectively) groups, but they did not reach the normal control value.
Fig. 3.
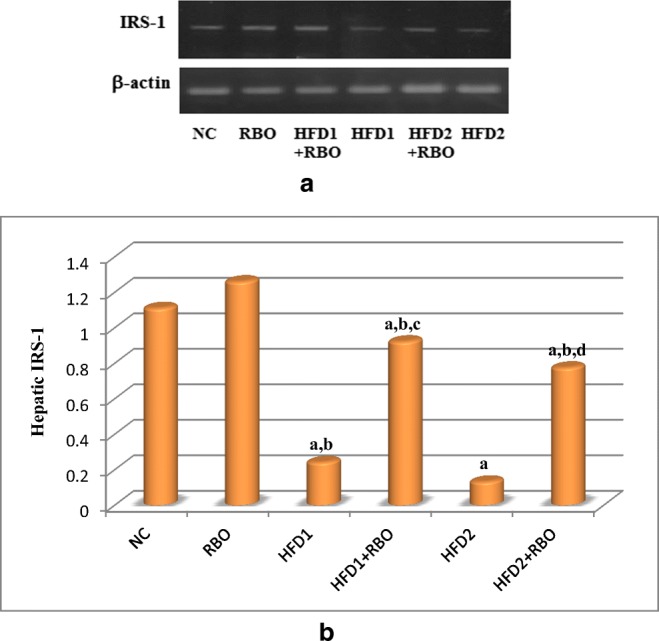
Effect of RBO on hepatic IRS-1. Effects on protein expression of the hepatic IRS-1 were determined by western blotting (a). ANOVA was performed to analyze the effects of RBO followed by least significant difference analysis (LSD) for multiple comparisons (b). The mean difference is significant at p < 0.05. Each group contained 10 rats. a: significance vs NC, b: significance vs RBO, c: significance vs HFD1, d: significance vs HFD2
Real time-PCR
Significant down-regulation in hepatic IR, IRS-1 and glucose transporter-4 (GLUT-4) genes expression (p < 0.001) were observed in HFD1 and HFD2 groups, compared to NC group. Addition of RBO to these diets for 1 month either from the first day of regimen (HFD1 + RBO) or after 1 month of feeding (HFD2 + RBO) improved these results significantly (p < 0.001), compared to their respective controls as observed in Figs. 4, 5 and 6.
Fig. 4.
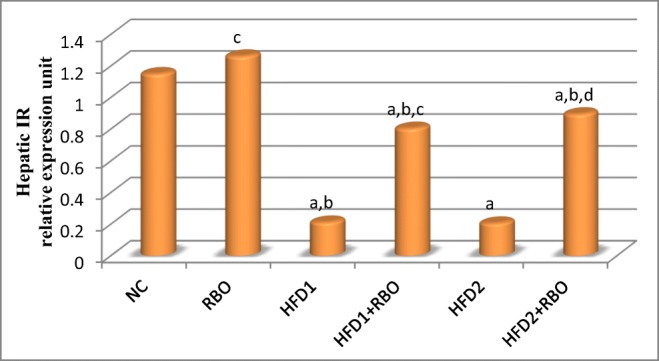
Hepatic IR gene expression in the high fructose fed rats with or without RBO. Expression of the hepatic IR was determined by real time quantitative polymerase chain reaction and results were normalized by β-actin. The effects of RBO were analyzed using ANOVA followed by LSD for multiple comparisons. The mean difference is significant at p < 0.05. Each group contained 10 rats. a: significance vs NC, b: significance vs RBO, c: significance vs HFD1, d: significance vs HFD2
Fig. 5.
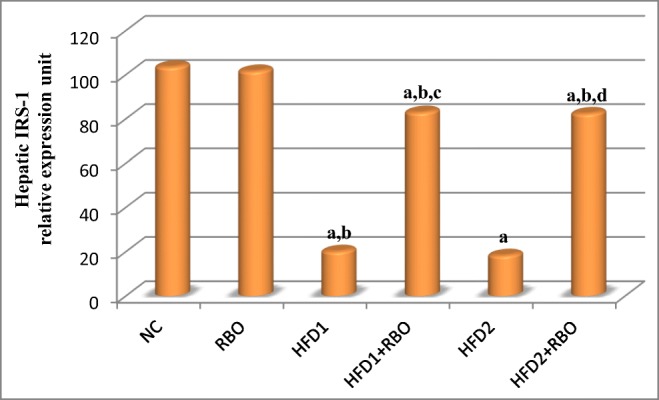
Hepatic IRS-1 gene expression in the different experimental groups. The expression was determined by real time quantitative polymerase chain reaction and results were normalized by β-actin. Data are presented as mean and were analyzed using ANOVA followed by LSD for multiple comparisons. The mean difference is significant at p < 0.05. Each group contained 10 rats. a: significance vs NC, b: significance vs RBO, c: significance vs HFD1, d: significance vs HFD2
Fig. 6.
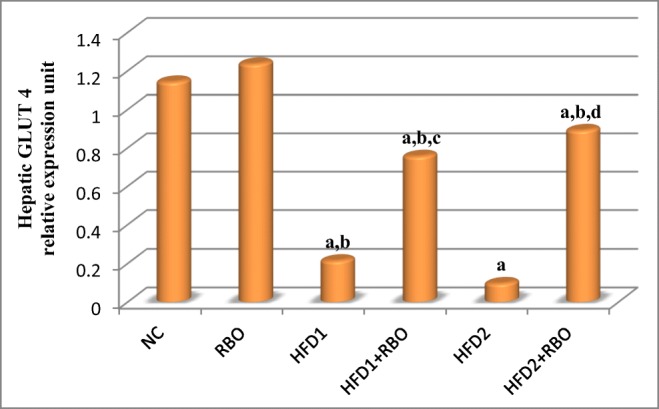
Hepatic glucose transporter 4 gene expression in the different experimental groups. The expression was determined by real time quantitative polymerase chain reaction and results were normalized by β-actin. Data are presented as mean and were analyzed using ANOVA followed by LSD for multiple comparisons. The mean difference is significant at p < 0.05. Each group contained 10 rats. a: significance vs NC, b: significance vs RBO, c: significance vs HFD1, d: significance vs HFD2
The mRNA level of hepatic GLUT-5 was significantly reduced (p < 0.001) in rats fed HFD either for 1 or 2 months, compared to NC group as illustrated in Fig. 7. Moreover, rats fed HFD for 2 months (HFD2) revealed a more pronounced reduction (p < 0.001), compared to HFD1. Addition of RBO to the HFD improved these reductions significantly in HFD1 + RBO and HFD2 + RBO (p < 0.001), compared to their respective control groups.
Fig. 7.
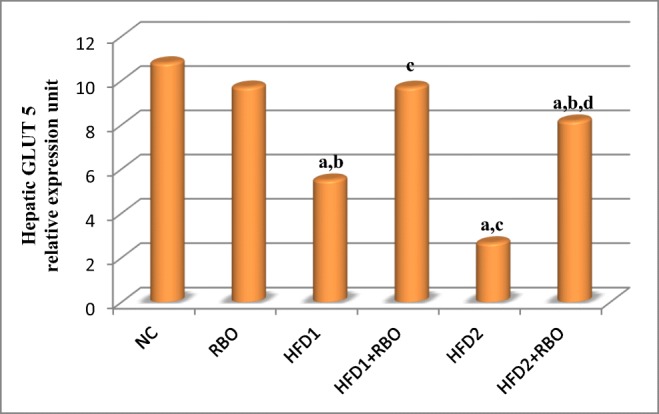
Hepatic GLUT5 gene expression in the different experimental groups. The expression was determined by real time quantitative polymerase chain reaction and results were normalized by β-actin. The effects of RBO were analyzed using ANOVA followed by LSD for multiple comparisons. The mean difference is significant at p < 0.05. Each group contained 10 rats. a: significance vs NC, b: significance vs RBO, c: significance vs HFD1, d: significance vs HFD2
Discussion
Insulin resistance syndrome is a cluster of related variables that included resistance to insulin-induced glucose uptake and hyperinsulinemia [20, 21]. Insulin resistance occurs at multiple levels in cells, from the cell surface to the nucleus, including insulin receptor desensitization and suppression of IRS protein and functionality, all of which can result from inhibition of IRS1 and IRS2 [22].
Previous studies confirmed that the high-fructose diet induces insulin resistance and oxidative stress in rat tissues [3, 5, 23, 24]. Rats fed high-fructose diet showed elevated levels of serum ALT and AST, the specific markers of hepatocellular injury [25, 26]. Previous studies agree with the current results only for serum ALT in HFD1 and HFD2 [25–27]. These elevations were significantly reduced in groups fed HFD containing RBO, compared to their respective control rats.
Based on the further histopathological examination, HFD groups revealed pathological changes in the liver architecture, as indicated by cytoplasmic vacuolation, hepatocyte necrosis, and mononuclear cells infiltration. These results confirm the induction of liver dysfunction. However, RBO administration reduced these pathological changes, showing near-normal appearance, which proved the protective and therapeutic effects of RBO.
Insulin resistance induced by a high fructose diet in rats is well documented [3, 5, 23, 28] and has been established in the present study. The degree of insulin resistance was higher in HFD1 and HFD2 groups as indicated by the significant elevation of serum insulin levels and HOMA-IR. The development of hyperglycemia in HFD1 group may be due to the formation of glucose from fructose by gluconeogenesis and impaired utilization of glucose by tissues, due to insulin resistance [29].
Addition of RBO restored insulin sensitivity and reduced HOMA-IR, compared to normal control and fructose-fed rats (HFD1and HFD2). Diminishes in insulin level along with the reduction in glucose and HOMA-IR suggest that RBO acts as a hypoglycemic agent through improving insulin action rather than insulin secretion. These results agree with those of Abd elbast et al. [11] and Abd El-Wahab et al. [5], who recorded that addition of RBO to high fructose diet-fed rats, improves insulin resistance. The appreciable amount of oleic acid and tocotrienols in RBO may be the causes of glucose reduction and insulin sensitivity in rats fed HFD containing RBO [30, 31].
Because of the absence of glucose in our fructose diet, so the substrate for glycogen synthesis in the fructose-fed groups likely came from dietary fructose through the gluconeogenic pathway due to the induction of fructose-1,6-bisphosphatase [32].
As shown previously, rats fed HFD for 30 days had elevated levels of hepatic glucose-6-phosphatase which catalyzes the terminal reaction of both glycogenolysis and gluconeogenesis [33]. Moreover, phosphoenolpyruvate carboxykinase is another regulatory enzyme in gluconeogenesis and its activity is greater in animals fed high fructose diets [34]. Together with the current results, these findings suggest that the reduction in IRS-1/PI3-kinase association, due to impaired insulin signaling in the liver of rats fed HFD, can reduce the effects of insulin on glucose-6-phosphatase and phosphoenolpyruvate carboxykinase, and consequently increases the hepatic glycogen as observed in HFD1 and HFD2 groups. In addition, feeding fructose for 8 weeks (HFD2) increased the hepatic glucose release which promotes hyperinsulinemia and insulin insensitivity. AS a result of insulin sensitivity improvement due to the addition of RBO, the hepatic glycogen content was reduced significantly as compared to HFD groups.
The difference in initial metabolism of fructose from glucose not only acutely affects carbohydrate metabolism but also induces metabolic adaptation including changes in gene expression [32]. In the current study, HFD significantly suppressed IR and IRS-1 at both gene and protein expression levels in rat hepatocytes. Moreover, high-fructose levels down-regulates both GLUT4 and GLUT5 genes expression in the liver. These results agree with previous studies which reported impaired insulin action and a decrease in GLUT4 expression in insulin resistance [27, 35]. The current results established that exposure to high concentrations of fructose induces insulin resistance like conditions, including inhibition of the Akt/PI3K pathway. In this signaling pathway, Akt lies downstream of PI3K, facilitates glucose uptake in the hepatic tissue.
The fundamental action of insulin is the regulation of glucose uptake in the liver via GLUT4, which is the most important downstream site of the insulin receptor because it sits at the rate-limiting step in the insulin transduction signal pathway [36]. GLUT4 acts as the major transporter after being translocated from the cytoplasm to the plasma membrane [37]. GLUT5 has an exclusive specificity for fructose and its expression is dramatically stimulated by the introduction of dietary fructose [38–40].
Surprisingly, RBO markedly increased these insulin receptors, exhibiting a protective effect against high-fructose evoked down-regulation of the insulin signaling pathway. In addition, RBO significantly increased the expressions of GLUT4 and 5 in rat liver. Thus, the upregulation of GLUT4 may be one of the mechanisms involved in the effects of RBO in increasing insulin sensitivity and improving insulin resistance.
Conclusions
Results indicated that insulin pathway was impaired by high fructose, and subsequently hepatic glucose utilization was repressed through suppressing PI3K/Akt down signaling and GLUT4 expression. Notably, the supplementation of RBO alleviated this insulin signaling blockade by improving the function of IR and IRS-1 by promoting PI3K/Akt phosphorylation and activating GLUT4 expression.
Electronic supplementary material
(DOCX 23 kb)
Acknowledgments
Authors thank the laboratory technical staff in making specimens available for processing.
Compliance with ethical standards
Conflict of interest
The authors declare that they have no conflict of interest.
Footnotes
Publisher’s note
Springer Nature remains neutral with regard to jurisdictional claims in published maps and institutional affiliations.
References
- 1.Koo SH, Satoh H, Herzig S, Lee CH, Hedrick S, Kulkarni R, Evans RM, Olefsky J, Montminy M. PGC-1 promotes insulin resistance in liver through PPAR-alpha-dependent induction of TRB-3. Nat Med. 2004;10:530–534. doi: 10.1038/nm1044. [DOI] [PubMed] [Google Scholar]
- 2.Kahn BB, Flier JS. On diabetes: insulin resistance, obesity and insulin resistance. J Clin Invest. 2000;106:473–481. doi: 10.1172/JCI10842. [DOI] [PMC free article] [PubMed] [Google Scholar]
- 3.Mohamed MA. Impact of L-carnitine and cinnamon on insulin-like growth factor-1 and inducible nitric oxide synthase gene expression in heart and brain of insulin resistant rats. Am J Biochem Biotechnol. 2010;6:204–212. doi: 10.3844/ajbbsp.2010.204.212. [DOI] [Google Scholar]
- 4.Mahfouz MH, Ghanem HM, Mohamed MA. Modulation of insulin receptor substrate-1 and some inflammatory variables in hyperinsulinemic rats treated with cinnamon extract. Am J Biochem Biotechnol. 2010;6:11–18. doi: 10.3844/ajbbsp.2010.11.18. [DOI] [Google Scholar]
- 5.Abd El-Wahab HMF, Mohamed MA, El Sayed HH, Bauomy AE. Modulatory effects of rice bran and its oil on lipid metabolism in insulin resistance rats. J Food Biochem. 2017;41:e12318. doi: 10.1111/jfbc.12318. [DOI] [Google Scholar]
- 6.Johnson RJ, Segal MS, Sautin Y, Nakagawa T, Feig DI, Kang DH, Gersch MS, Benner S, Sánchez-Lozada LG. Potential role of sugar (fructose) in the epidemic of hypertension, obesity and the metabolic syndrome, diabetes, kidney disease, and cardiovascular disease. Am J Clin Nutr. 2007;86:899–906. doi: 10.1093/ajcn/86.4.899. [DOI] [PubMed] [Google Scholar]
- 7.Havel PJ. Dietary fructose: implications for dysregulation of energy homeostasis and lipid/carbohydrate metabolism. Nutr Rev. 2005;63:133–157. doi: 10.1111/j.1753-4887.2005.tb00132.x. [DOI] [PubMed] [Google Scholar]
- 8.Bray GA, Nielsen SJ, Popkin BM. Consumption of high-fructose corn syrup in beverages may play a role in the epidemic of obesity. Am J Clin Nutr. 2004;79:537–543. doi: 10.1093/ajcn/79.4.537. [DOI] [PubMed] [Google Scholar]
- 9.Arab F, Alemzadeh I, Maghsoudi V. Determination of antioxidant component and activity of rice bran extract. Scientia Iranica, Transactions C: Chem Chemi Eng. 2011;18:1402–1406. doi: 10.1016/j.scient.2011.09.014. [DOI] [Google Scholar]
- 10.Rubalya VS, Neelamegam P. Antioxidant potential in vegetable oil. Res J Chem Env. 2012;16:87–94. [Google Scholar]
- 11.Abd Elbast SA, Rashed LA, Mohamed MA, Ahmed MA, Ahmed EA. Amelioration of insulin resistance in rats treated with rice bran oil. Egyp J Hosp Med. 2016;65:547–552. doi: 10.12816/0033763. [DOI] [Google Scholar]
- 12.Gilbert ER, Liu D. Epigenetics: the missing link to understanding beta-cell dysfunction in the pathogenesis of type 2 diabetes. Epigenetics. 2012;7:841–85210. doi: 10.4161/epi.21238. [DOI] [PMC free article] [PubMed] [Google Scholar]
- 13.Rajasekar P, Kaviarasan S, Anuradha CV. L-carnitine administration prevents oxidative stress in high fructose fed insulin resistant rats. Diabetol Croat. 2005;34:21–28. [Google Scholar]
- 14.Wang ZQ, Zuberi A, Zhang XH, Macgowan J, Qin J, Ye X, Son L, Wu Q, Lian K, Cefalu WT. Effects of dietary fibers on weight gain, carbohydrate metabolism and gastric ghrelin gene expression in high fat diet fed mice. Metabolism. 2007;56:1635–1642. doi: 10.1016/j.metabol.2007.07.004. [DOI] [PMC free article] [PubMed] [Google Scholar]
- 15.Sharp P. Interference in glucose oxidase-peroxidase blood glucose methods. Clin Chem Acta. 1972;40:115–120. doi: 10.1016/0009-8981(72)90257-4. [DOI] [PubMed] [Google Scholar]
- 16.Dhahir FJ, Cook DB, Self CH. Amplified enzyme-linked immunoassay of human pro-insulin in serum. Clin Chem. 1992;38:227–232. [PubMed] [Google Scholar]
- 17.Pickavance LC, Tadayyon M, Widdowson PS, Buckingham RE, Wilding JP. Therapeutic index for rosiglitazone in dietary obese rats. Separation of efficacy and haemodilution. Br J Pharmacol. 1999;128:1570–1576. doi: 10.1038/sj.bjp.0702932. [DOI] [PMC free article] [PubMed] [Google Scholar]
- 18.Carroll NV, Longlev RW, Roe JH. The determination of glycogen in liver and muscle by use of anthrone reagent. J Biol Chem. 1956;220:583–593. [PubMed] [Google Scholar]
- 19.Bezerra RM, Ueno M, Silva MS, Tavares DQ, Carvalho CR, Saad MJ. A high fructose diet affects the early steps of insulin action in muscle and liver of rats. J Nutr. 2000;130:1531–1535. doi: 10.1093/jn/130.6.1531. [DOI] [PubMed] [Google Scholar]
- 20.Ye J. Mechanisms of insulin resistance in obesity. Front Med. 2013;7:14–24. doi: 10.1007/s11684-013-0262-6. [DOI] [PMC free article] [PubMed] [Google Scholar]
- 21.Bermudez V, Salazar J, Martínez MS, Chávez Castillo M, Olivar LC, Calvo MJ, Palmar J, Bautista J, Ramos E, Cabrera M, Pachano F, Rojas J. Prevalence and associated factors of insulin resistance in adults from Maracaibo City, Venezuela. Adv Prev Med. 2016;2016:9405105. doi: 10.1155/2016/9405105. [DOI] [PMC free article] [PubMed] [Google Scholar]
- 22.Guo S. Insulin signaling, resistance, and the metabolic syndrome: insights from mouse models to disease mechanisms. J Endocrinol. 2014;220:T1–T23. doi: 10.1530/JOE-13-0584. [DOI] [PMC free article] [PubMed] [Google Scholar]
- 23.Mahfouz MH, Ghanem HM, Mohamed MA. Therapeutic effect of L-carnitine on sialic acid, soluble Fas (sFas) and other biochemical variables in hyperinsulinemic rats. Life Sci J. 2009;6:76–82. [Google Scholar]
- 24.Hussein SA, Abd El-Hamid OM, Hemdan HS. Protective effect of L-carniteine on metabolic disorders, oxidactive stress, antioxidant status and inflammation in a rat model of insulin resistance. Benha Vet Med J. 2013;25:99–112. [Google Scholar]
- 25.de Castro UGM, Santos ASD, Silva ME, de Lima WG, Campagnole-Santos MJ, Alzamora AC. Age-dependent effect of high-fructose and high-fat diets on lipid metabolism and lipid accumulation in liver and kidney of rats. Lipids Health Dis. 2013;12:136. doi: 10.1186/1476-511X-12-136. [DOI] [PMC free article] [PubMed] [Google Scholar]
- 26.Al-Okbi SY, Mohamed DA, Hamed TE, Esmail RSH. Rice bran oil and pumpkin seed oil alleviate oxidative injury and fatty liver in rats fed high fructose diet. Pol J Food Nutr Sci. 2014;64:127–133. doi: 10.2478/pjfns-2013-0002. [DOI] [Google Scholar]
- 27.Hu Y, Hou Z, Yi R, Wang Z, Sun P, Li G, Zhao X, Wang Q. Tartary buckwheat flavonoids ameliorate high fructose-induced insulin resistance and oxidative stress associated with the insulin signaling and Nrf2/HO-1 pathways in mice. Food Funct. 2017;8:2803–2816. doi: 10.1039/C7FO00359E. [DOI] [PubMed] [Google Scholar]
- 28.Shawky NM, Shehatou GSG, Abdel Rahim M, Suddek GM, Gameil NM. Levocetirizine ameliorates high fructose diet-induced insulin resistance, vascular dysfunction and hepatic steatosis in rats. Eur J Pharmacol. 2014;740:353–363. doi: 10.1016/j.ejphar.2014.07.021. [DOI] [PubMed] [Google Scholar]
- 29.Konopelnyuk V, Yurchenko A, Karpovets T, Ostapchenko L. The development of obesity and prediabetes under conditions of long-term consumption of fructose solution in rats. J App Pharm Sci. 2015;5:001–005. [Google Scholar]
- 30.Shakib MC, Gabrial S, Gabrial G. Rice bran oil compared to atorvastatin for treatment of dyslipidemia in patients with type 2 diabetes. Macedonian J Med Sci. 2014;7:95–102. doi: 10.3889/oamjms.2014.017. [DOI] [Google Scholar]
- 31.Vafa M, Haghighat N, Moslehi N, Eghtesadi S, Heydari I. Effect of tocotrienols enriched canola oil on glycemic control and oxidative status in patients with type 2 diabetes mellitus: a randomized double-blind placebo-controlled clinical trial. J Res Med Sci. 2015;20:540–547. doi: 10.4103/1735-1995.165945. [DOI] [PMC free article] [PubMed] [Google Scholar]
- 32.Koo HY, Wallig MA, Chung BH, Nara TY, Cho BHS, Nakamura MT. Dietary fructose induces a wide range of genes with distinct shift in carbohydrate and lipid metabolism in fed and fasted rat liver. Biochim Biophys Acta. 2008;1782:341–348. doi: 10.1016/j.bbadis.2008.02.007. [DOI] [PubMed] [Google Scholar]
- 33.Nandhini AT, Anuradha CV. Taurine modulates kallikrein activity and glucose metabolism in insulin resistant rats. Amino Acids. 2002;22:27–38. doi: 10.1007/s726-002-8199-3. [DOI] [PubMed] [Google Scholar]
- 34.Blakely SR, Hallfrisch J, Reiser S, Prather E. Long-term effects of moderate fructose feeding on glucose tolerance parameters in rats. J Nutr. 1981;111:307–314. doi: 10.1093/jn/111.2.307. [DOI] [PubMed] [Google Scholar]
- 35.Nieto-Vazquez I, Fernández-Veledo S, de Alvaro C, Lorenzo M. Dual role of interleukin-6 in regulating insulin sensitivity in murine skeletal muscle. Diabetes. 2008;57:3211–3221. doi: 10.2337/db07-1062. [DOI] [PMC free article] [PubMed] [Google Scholar] [Retracted]
- 36.Shan W, Chen B, Zhu S, Jiang L, Zhou Y. Effects of GLUT4 expression on insulin resistance in patients with advanced liver cirrhosis. J Zhejiang Univ Sci B (Biomed & Biotechnol) 2011;12:677–682. doi: 10.1631/jzus.B1100001. [DOI] [PMC free article] [PubMed] [Google Scholar]
- 37.Karnieli E, Armoni M. Transcriptional regulation of the insulin-responsive glucose transporter GLUT4 gene: from physiology to pathology. Am J Physiol Endocrinol Metab. 2008;295:38–45. doi: 10.1152/ajpendo.90306.2008. [DOI] [PubMed] [Google Scholar]
- 38.Douard V, Ferraris RP. Regulation of the fructose transporter GLUT5 in health and disease. Am J Physiol Endocrinol Metab. 2008;295:E227–E237. doi: 10.1152/ajpendo.90245.2008. [DOI] [PMC free article] [PubMed] [Google Scholar]
- 39.Suzuki T, Douard V, Mochizuki K, Goda T, Ferraris RP. Diet-induced epigenetic regulation in vivo of the intestinal fructose transporter Glut5 during development of rat small intestine. Biochem J. 2011;435:43–53. doi: 10.1042/BJ20101987. [DOI] [PubMed] [Google Scholar]
- 40.Patel C, Douard V, Yu S, Tharabenjasin P, Gao N, Ferraris RP. Fructose-induced increases in expression of intestinal fructolytic and gluconeogenic genes are regulated by GLUT5 and KHK. Am J Phys Regul Integr Comp Phys. 2015;309:R499–R509. doi: 10.1152/ajpregu.00128.2015. [DOI] [PMC free article] [PubMed] [Google Scholar]
Associated Data
This section collects any data citations, data availability statements, or supplementary materials included in this article.
Supplementary Materials
(DOCX 23 kb)


