Abstract
In this study, arsenate (As-V) removal using micellar enhanced ultrafiltration (MEUF) modified by cationic surfactants was studied by a dead-end polyacrylonitrile (PAN) membrane apparatus. The UF membrane has been produced by a phase inversion process. The prepared membrane was characterized and analyzed for morphology and membrane properties. The influence of operating parameters such as initial concentrations of As-V, surfactants, pH, membrane thickness, and co-existing anions on the removal of As-V, surfactant rejection, and permeate flux have been studied. The experimental results show that from the two different cationic surfactants used the CPC (cetyl-pyridinium chloride) efficiency (91.7%) was higher than that of HTAB (hexadecyltrimethyl-ammonium bromide) (83.7%). The highest As-V removal was 100%, and was achieved using initial feed concentrations of 100–1000 μg/L, at pH 7 with a membrane thickness of 150 μm in a dead-end filtration system. This efficiency for As-V removal was similar to that obtained using a cross-flow system. Nevertheless, this flux reduction was less than the reduction achieved in the dead-end filtration process. The PAN fabricated membrane in comparison to the RO and NF processes selectively removed the arsenic and the anions, in the water taken from the well, and had no substantial effect on the cations.
Keywords: Arsenate removal, Surfactant enhancement, Ultrafiltration, Polyacrylonitrile membrane, Micelle optimization
Introduction
A range of industries and erosion processes are the primary contributors to arsenic contamination in water resources [1, 2]. Some heavy metals such as arsenic, lead, cadmium, nitrate, and mercury are toxic at certain low levels [3]. Arsenic is as a Group A carcinogen according to the United States Environmental Protection Agency (USEPA) [4]. Therefore, it poses a serious threat to human health and water resources in several regions around the world [5]. According to the USEPA, World Health Organization (WHO) and Iranian National Drinking Water standards, the maximum contaminant level (MCL) of arsenic in drinking water is 10 ppb [6–8]. Significant arsenic contamination levels in drinking waters have been recorded in several regions of Iran, China, India, Vietnam, Bangladesh and the USA [9–11]. The highest arsenic concentrations up to 100–1000 ppb were reported in rural areas of western Iran, that are 10 to 100 times more than the standard level [12, 13]. It is clearly necessary to develop treatment methods [14] and the success of different types of arsenic treatment depends on its type and both the chemical and physical properties of the water [15]. The two major forms of arsenic in water, which are based on valence, are arsenate (As-V) and arsenite (As-III). As-III is 60 times more toxic than As-V [16–18]. The pH of natural water is typically in the range pH 5–8, under these conditions, arsenate exists in an anionic form, while arsenite remains as a protonated natural species [19].
Various technologies for arsenic removal from water sources have been used, including coagulation/precipitation [20, 21], adsorption [22], ion exchange [23, 24], and membrane processes [25, 26]. High cost and volume of the produced toxic byproduct are the limitations of these methods [27]. Recently, membrane separation processes have been extensively utilized to remove heavy metal ions from drinking water [14, 28]. Among the membrane processes, ultrafiltration (UF) membranes have many applications in water and wastewater treatment [29].
The UF operated at low pressure, requires less energy, but it was not successful in the removal of low molecular weight dissolved constituents [19, 30]. In order to remove these contaminants, reverse osmosis (RO) and nanofiltration (NF) can be used due to the size of the ions in aqueous solution. Although, the operation costs of these processes are high, because of the limitation of their permeate flux and consume more energy [30, 31]. It was found that UF membranes, when combined with cationic surfactant micelles, are effective for the removal of dissolved aqueous pollutants [19, 32].
The micellar enhanced ultrafiltration (MEUF) process has potential as a separation method for the removal inorganic and organic pollutants from aqueous solution [33, 34]. The first tests with MEUF were made by Dunn et al. in the mid-80s [35]. Recent studies show that MEUF is an efficient method to remove of anionic contaminates, such as anionic heavy metals [34, 36], anionic organic dyes [37], phosphates [38], nitrates [39], and arsenate [34]. The main advantages of MEUF are low energy consumption, high removal efficiency, and high flux [40–42]. In this method, the surfactant may be added to the polluted solution above its critical micelle concentration (CMC). Surfactant concentrations greater than their CMC form micelles (aggregates of 50–100 surfactant molecules) which electrostatically bind with anionic arsenate species due to the absolute electrostatic potential and the high surface charge density. In the next step, the created micelles can be separated during UF because their size is physically too large to pass through membrane pores [43–46].
Several materials (e.g., metals, minerals, polymers, ceramics, and composites) have been used for the fabrication of membranes, but polymers are currently the most popular, because of their permeability and selectivity in the manufacturing phase [47, 48]. Polyacrylonitrile (PAN) polymer has proved to be extremely popular for membranes preparation due to its hydrophilicity, chemical stability, hydrophilicity, and for solvent stability [49]. The PAN membrane was prepared by the phase inversion method [49].
The novelty of this study is based on preparing a UF membrane by the PAN polymer with large molecular weight (MW) (100,000 g/mol) and using low surfactant concentrations to treat As-V contaminated water. For this purpose, our UF membrane has been fabricated from PAN polymer. Characterization of the membranes has been investigated and also, the influence of some process variables on the efficiency of As-V removal, such as, surfactant rejection and permeate flux were evaluated. Finally, the applicability of the process was investigated using real water samples obtained from contaminated wells of Kurdistan in Iran.
Experimental
Materials
Cetyl-pyridinium chloride (CPC) and hexadecyltrimethyl-ammoniumbromide (HTAB), cationic surfactants, were purchased from Aldrich, USA. The chemical formula, CMC, CAS Number, and molecular weights and properties of the surfactants are shown in Table 1. Arsenic (H3AsO4) and nitrate (NaNO3) standard solutions were purchased from Merck, Germany. Polyacrylonitrile (PAN, having an average molecular weight (MW) of 100,000 g/mol) was purchased from Polyacryle Company, Iran. N-N-dimethylformamide (DMF), sodium hydroxide (NaOH), and hydrochloric acid (HCl) were obtained from Merck, Germany. All reagents were analytical grade and used as received without further purification. Contaminated groundwater samples were obtained from the parts of rural areas of Kurdistan, Iran. For all experiments, double distilled deionized (DDI) water was used.
Table 1.
Properties of the two surfactants
| Surfactant | CMC (mM) | Molecular weight | CAS Number | Chemical formula |
|---|---|---|---|---|
| Cetylpyridinium chloride | 0.90 | 358.01 | 123–03-5 | C12H38ClN |
| Hexadecyltrimethyl-ammonium bromide | 0.92 | 364.46 | 57–09-0 | CH3(CH2)15N(Br)(CH3)3 |
Preparation of UF membrane
A PAN flat membrane was prepared by the phase inversion method using immersion precipitation. A 16% (w/v) solution was prepared by dissolving PAN in DMF at 55-60 °C [49]. The solution was agitated for 5 h to become completely homogenous. Then, the solution was kept for 2 h at room temperature in order to remove the air bubbles. Subsequently, the solution was cast using a hand casting knife with various thicknesses on a smooth glass plate. These membranes were exposed to the atmosphere for 90 s to complete the solvent evaporation. Next, the membranes were immersed in a water bath at room temperature. The new membranes were washed with water and then stored for 24 h to remove residual solvent. Finally, to complete the drying of the membrane, the membranes were placed between filter papers for 24 h at ambient temperature [28, 49].
Characterization of UF membrane
The membrane surface morphology was investigated by scanning electron microscopy (SEM) (model: SEM-5800, JEOL, Japan). The membrane samples were cut into small sections, dried by filter paper, and dipped in liquid nitrogen for 30 s, before the SEM measurement. SEM studies were conducted on the upper surface and on the cross section of samples of the membrane. The Fourier transform infrared (FT-IR) spectrum was determined by a Bruker spectrometer (Bruker Tensur 27, Germany) from 500 to 4000 cm−1 at room temperature using powder-pressed KBr pellets. Atomic force microscopy (AFM; Ara Research Co, model No. 0101/A, Iran) was used to analyze the surface roughness (Ra) of the prepared membrane. The membrane samples were now placed in a specimen holder and 2 × 2 μm areas and were scanned in air using the tapping mode.
The hydrophobicity of the polymer UF membrane surface was determined by terms of the water contact angle measurement. In this test, water was used as the probe liquid. The static contact angle of water was measured on the surface of the membrane using the drop method at 25 °C. The drops were created using a 10 μl Hamilton positive displacement syringe and the average contact angle value was evaluated from more than three locations on each membrane.
The porosity of the prepared membrane was calculated by observing the water uptake capacity of the membrane sample. The rectangular cut off membrane sample (20 × 30 mm) was taken and soaked for 24 h in deionized water and the wet weight was taken after wiping the excess water on the sample surface using a filter paper. Subsequently, the wet sample was placed in a vacuum oven at 80 °C for 24 h. The dry weight of the membrane sample was then recorded until the weight became constant and the membrane porosity was evaluated using Eq. 1 as follows [28]:
| 1 |
where ε is the membrane porosity, Ww and Wd (kg) are the wet and dry weights of the membrane sample, respectively, A (m2) is the membrane surface area, L ɩ(m) is the membrane thickness, and ρw (kg m−3) is the density of water.
UF experiments
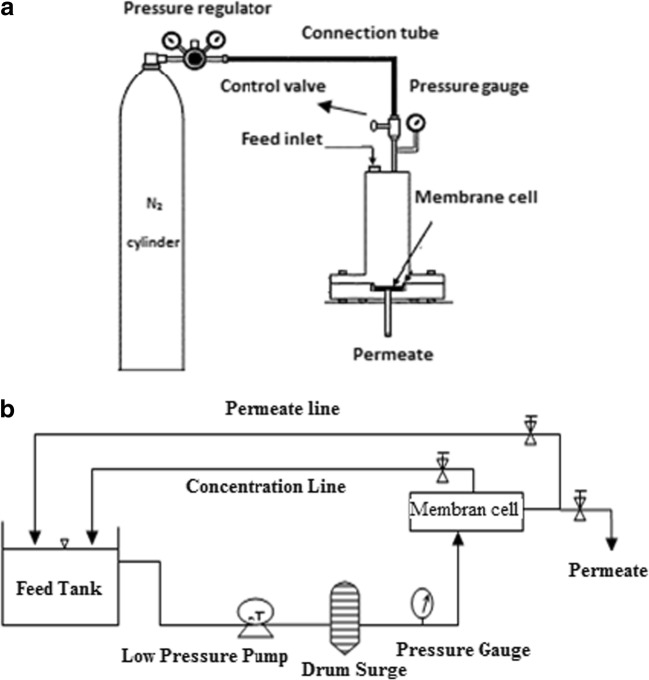
The UF experiments were performed by a dead-end cell filtration system with 300 ml capacity fitted with UF membrane, which had an effective membrane area of 12.4 cm2. The cell was connected to a nitrogen gas cylinder in order that nitrogen could be used to maintain the transmembrane pressure gradient. The schematic diagram of the dead-end UF unit is shown in Fig. 1(a). The experiments were performed to obtain the efficiency of the membrane in terms of flux and removal of As-V. The effect of concentrations of surfactants (0.1–5 mM), As-V concentrations (100, 500, 1000, 5000 μgl−1), pH (4–9), membrane thickness (50–150 μm), co-existing ion (NO3−) on As-V removal, the surfactants rejection, and permeate flux were also studied. For each set of experiments, the permeate samples were collected at specified time intervals and the removal efficiency was analyzed. Flux tests were performed at an operating pressure of 1 bar. The rejection (R) of As-V and surfactants was calculated using Eq. 2 [50]:
| 2 |
where Cp and Cf are the concentrations of the feed and permeate solutions as As-V concentration (μgl−1) respectively. The water flux was determined using Eq. (3) as follows [51]:
| 3 |
where Jw (Lm−2 h−1) is permeate flux, V (L) is the total volume of permeate water, A (m2) is the membrane effective area, and t (h) is the operation time.
Fig. 1.
Schematic diagram of a) dead-end apparatus, b) cross-flow apparatus
A custom built cross-flow filtration cell (active filtration area 12.1 cm2) was used to compare the performance of the UF membrane in some optimal and selected conditions. The schematic diagram of cross-flow UF unit is shown in Fig. 1(b). The As-V and nitrate concentrations were determined using a flame atomic absorption spectrophotometer (Varian spectra AA 200) and Ion Chromatography (IC, Metrohm 882 Compact, Switzerland) respectively, in feed and permeate samples [52, 53]. The concentration of CPC and HTAB were measured by UV-VIS spectrophotometer at the wavelengths of 259 and 206 nm respectively. Measures of samples were performed in triplicate. The pH was determined using a pH-meter (3510, Jenway).
Results and discussion
Characterization of UF membranes
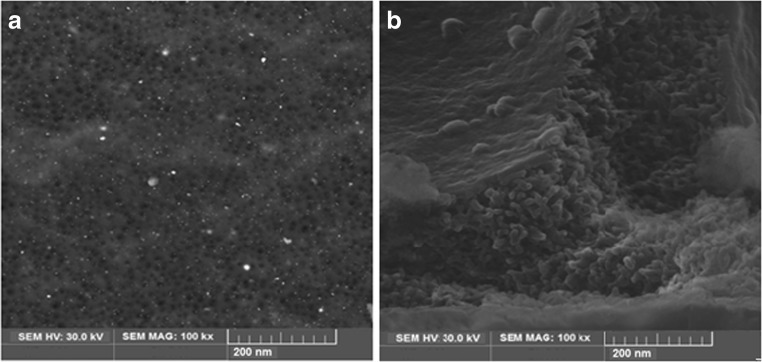
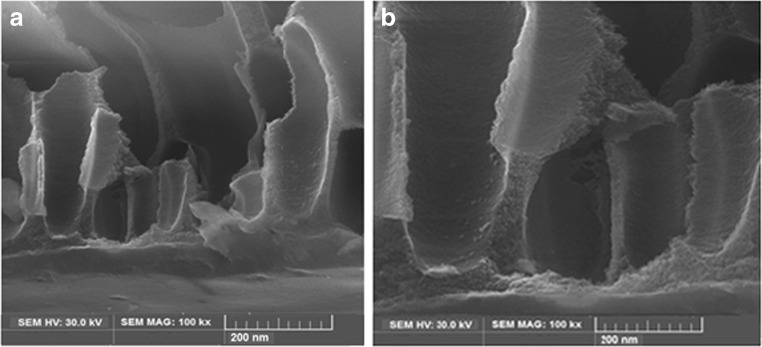
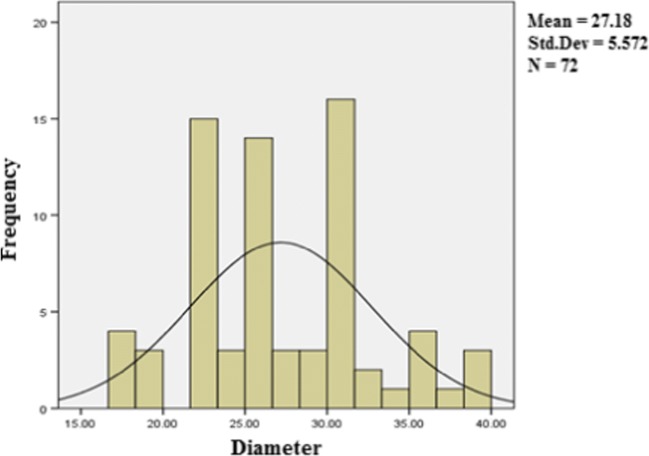
Figures 2 and 3 represent the SEM morphology of the upper surface and cross section of the membrane used before MEUF and after the arsenate micelles rejection, respectively. Clearly, the SEM images show a noticeable change in morphology of the membranes. The SEM images in Figs. 2(a) and 3(a) show that the membranes structures before filtration were soft and finger-like, while after MEUF as seen in Figs. 2(b) and 3(b), the arsenic micelles accumulated and formed like a layer of cake on the membrane surface. This layer of arsenate-micelles blocked the open pores and prevented micelles from passing through the membrane, which gives a higher retention capacity. However, this fouling film lowers the permeability of the membrane, limits the capacity of the filter and increases the transmembrane pressure. The pore size distribution of the UF membrane is shown in Fig. 4 and the average pore size of UF membrane is 27.18 nm.
Fig. 2.
SEM images of the top surface of the UF membranes: a) before filtration b) after filtration
Fig. 3.
SEM images of the cross section of the UF membrans: a) before filtration b) after filtration
Fig. 4.
The pore size distribution of the UF membrane
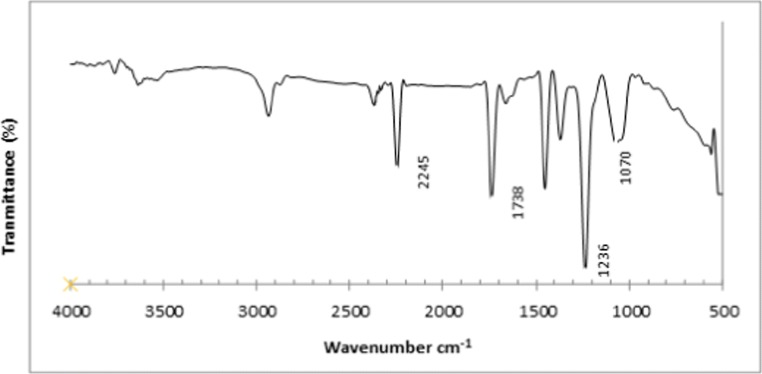
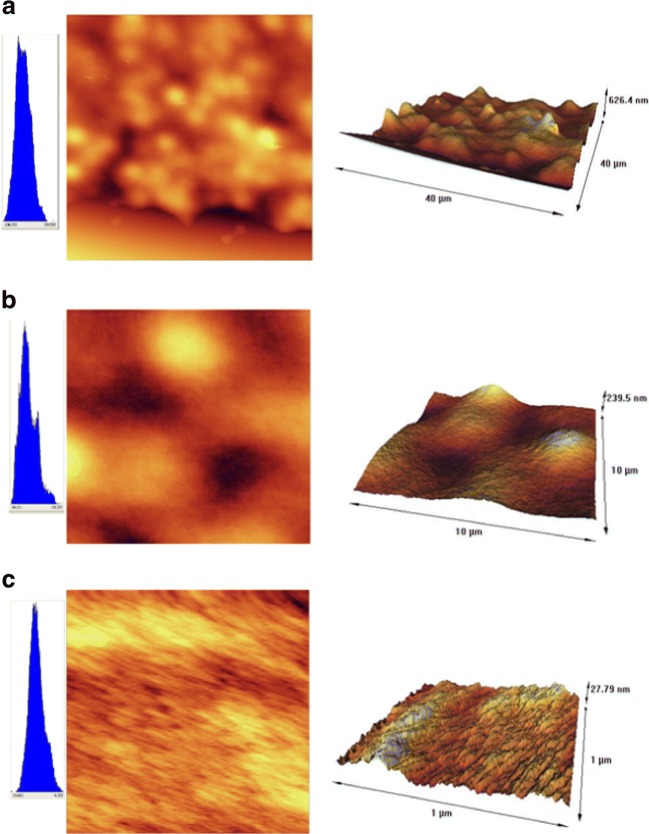
The FT-IR spectra of the PAN membrane is shown in Fig. 5. These spectra exhibit the characteristic bands of nitrile (2245 cm−1), carbonyl (1738 cm−1), and ether (1236 and 1070 cm−1) groups; ether and carbonyl bands originate from the methylacrylate co-monomer. Figure 6(a–c) shows the two-dimensional and three-dimensional AFM images of the upper surface of the synthesized membranes at a different magnification, respectively. In image 6 (a) with a magnification of 40 μm, the bright high peaks denote the nodules, and the dark depressions represent the pores present on the surface. The bright and dark areas in images 6 (b) and (c) (with a magnification of 10 μm and 1 μm respectively) are less readily seen.
Fig. 5.
FT-IR pattern of PAN membrane
Fig. 6.
AFM two-dimensional and three-dimensional surface morphology of the PAN membrane with magnification of a) 40, b) 10, and c) 1 μm
Furthermore, Table 2 shows the various degrees of roughness of the membrane surface with a magnification of 40 μm.
Table 2.
Surface roughness of the PAN membranes obtained based on 3 selected AFM surface images
| Magnification (μm) | Mean surface roughness (Ra-nm) |
|---|---|
| 40 | 88.84 |
| 10 | 38.7 |
| 1 | 4.13 |
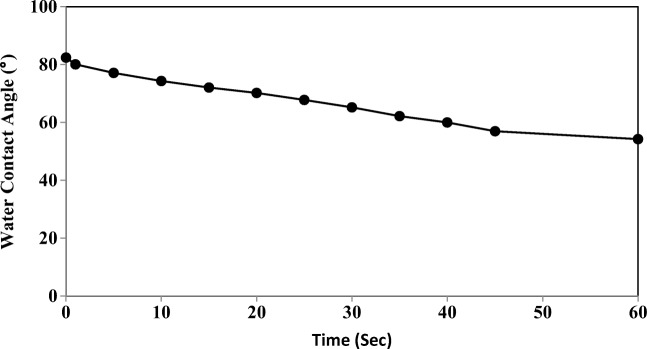
The water contact angle measurement is one of the most appropriate methods for evaluating the surface hydrophilicity of UF membranes (Fig. 7). By theory, the contact angle of a hydrophilic UF membrane should be less in comparison with a hydrophobic UF membrane, when the membrane morphologies are similar [54].
Fig. 7.
Time dependence of water contacts angle for the UF membrane
In Fig. 7, it can be observed that the water contact angle changed from 82.4° to 54.2° within 60 s. The PAN porosity is of the order of 59% and appears to be the reason that water is capable of penetrating the PAN surface pores.
Dead-end experiments
Effect of type of surfactants on as-V removal
The effects of various surfactants on their removal ability for As-V have been investigated in terms of the surfactants rejection capability, and permeate flux in the MEUF. Fig. 8(a) and (b) show the As-V removal results using the different cationic surfactants at various concentrations. The removal of As-V in aqueous solution increased from 75 to 91.7% and from 26 to 83.7% in the first 0.5 min when the CPC concentration and HTAB increased from 1 to 3 mM, respectively. When the concentration of surfactants increased from 3 to 5 mM, the increase in the removal of As-V was negligible (<7%) for both surfactants. Thus with the concentration of surfactant more than 3 mM, more than 90% As-V removal from aqueous solution was achieved. However, the largest removal with no surfactant present was 25% (result not shown). The removal of As-V with the HTAB was slightly lower than the CPC. When the concentration of the cationic surfactants was above the CMC, the removal efficiency was significantly increased. These results confirm that the As-V ions are associated with the cationic micelles. The results are consistent with the observation by Beolchini et al., who reported that in UF, the As-V ions are associated with CPC micelles by the polyether sulphone (PES) membrane [55]. These results clearly indicate that the As-V ions effectively bind with cationic surfactant micelles. Other previous studies have also shown similar results [55, 56]. An unusual observation was that relatively good removals were obtained with cationic surfactant concentrations below the CMC. A CPC concentration of 0.1 mM, which is nine times lower than the CMC, generating an As-V removal of 70%. It may be assumed that membrane modification is responsible for this effective removal. Evidence of this modification is provided by the analysis of the permeate fluxes, which were decreased by the presence of a cationic surfactant in the feed, compared to the flux of pure water (63.1 Lm−2 h−1). It is possible that an aggregation of surfactant monomers took place in the membrane, reducing the diameter of its pores. Thus, accumulation within the restricted pore volume might play the role of the free micelles in the bulk. Another possible explanation could be the adsorption of the cationic surfactant on the PAN polymer contain negative charges, thus arsenate removal increases [57, 58]. This observation is consistent with the data reported by Tanhaei and colleagues [59].
Fig. 8.
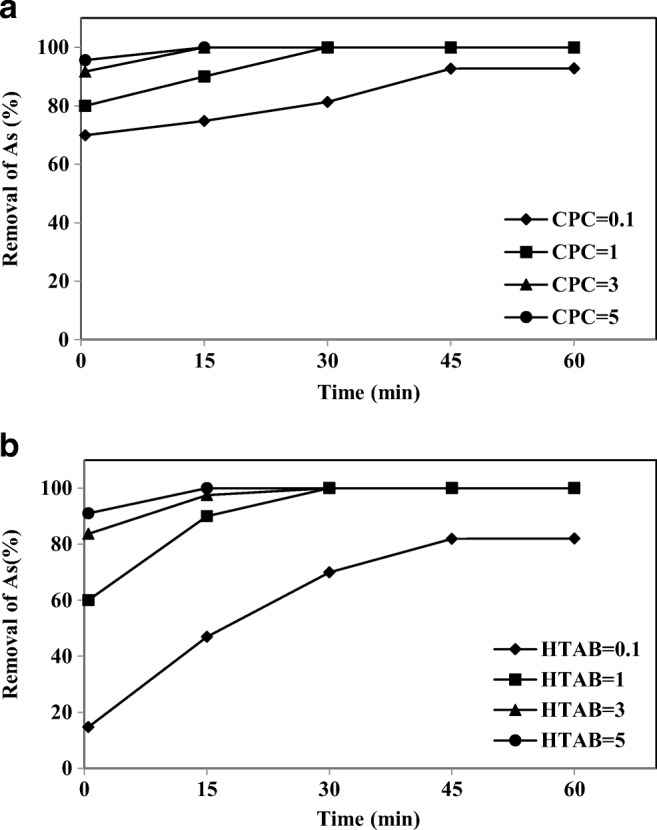
Removal of As-V by a) CPC and b) HTAB at different intervals (As-V concentration 1000 μgl−1, membrane thickness 150 μm, pH 7)
The surfactant rejection is a key parameter for the effluent treatment process from an economical perspective and the suitability of the source water. It was observed from the surfactants rejection versus time plot in Fig. 9(a) and (b), that the rejection of the surfactants increased with the surfactant concentration in the feed. Rejection of both CPC and HTAB were more than 96% for the concentrations of 1 and 3 mM in the first 0.5 min. This can be attributed to the chelating ability of As-V. At lower concentrations, the surfactants exist in monomeric form and these monomers could pass through the membrane instead of being retained by the membrane. Therefore, the rejection of surfactant at low concentrations (0.1 mM) was quite low [34]. But even in low concentrations, the permeate concentration of CPC could not be above the CMC of surfactants (0.9 mM). Consequently, only a few surfactants molecules did not participate in forming micelles.
Fig. 9.
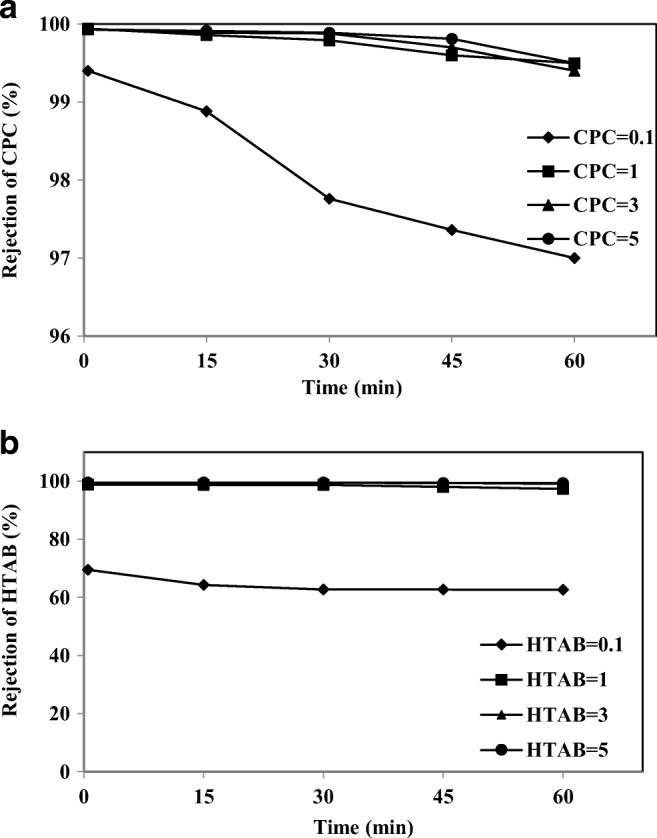
The rejection of a) CPC and b) HTAB at different intervals (As-V concentration 1000 μgl−1, membrane thickness 150 μm, pH 7)
A major disadvantage of membrane processes is the flux decline due to membrane fouling. Figure 10(a) and (b) report the permeate fluxes for CPC and HTAB at the transmembrane pressure of 1 bar at different intervals of the filtration, respectively. The flux of cationic surfactant in the feed are compared to the flux of pure water (63.1 Lm−2 h−1). All these fluxes are lowered by the presence of CPC and HTAB in the feed; in particularly, HTAB showed a severe decline in flux. The flux decreased sharply initially and then the decline rate became very slow. The rapid phase flux declination was due to the concentration polarization and the second phase resulted in a slow decrease, which was due to gel formation over the membrane surface [42]. After 15 min of filtration, the permeate flux was found to be 26.3% and 10.14% of the flux of pure water for CPC and HTAB in the concentration of 3 mM, respectively. In Fig. 10, the flux decreased as the HTAB surfactant concentration increased because a secondary membrane was produced on the membrane surface [60].
Fig. 10.
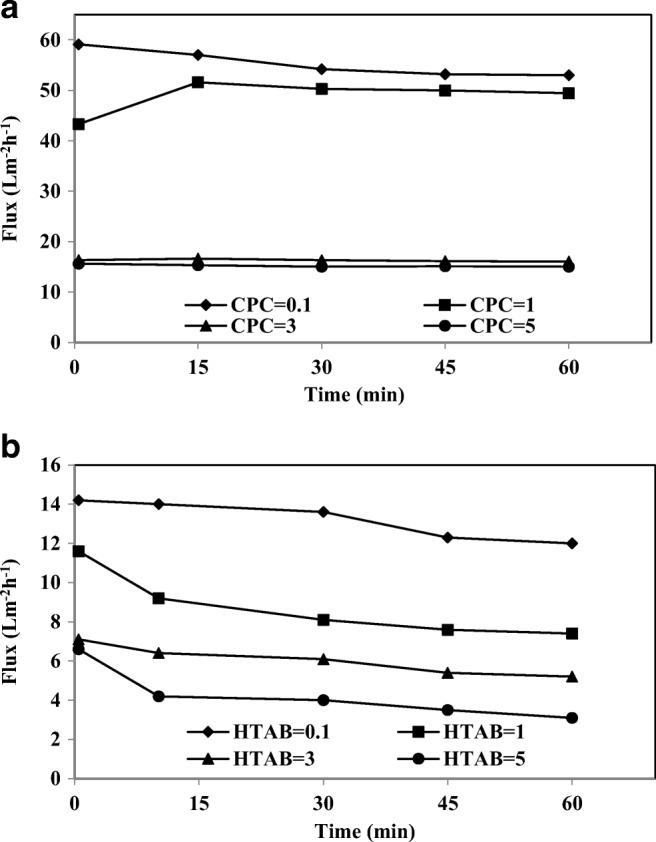
The permeate flux of a) CPC and b) HTAB at different time intervals (As-V concentration 1000 μgl−1, membrane thickness 150 μm, pH 7)
Effect of pH
The electrostatic interaction intensity connecting the micelles and the arsenic species will vary due to the valency number on the arsenic ion [56]. Hence, the nature of the removal of arsenic species is strongly related to pH. Figure 11(a) shows the influence of pH on arsenic removal at different pH intervals. When the pH is 4, the removal efficiency falls by 6–7% because arsenic is present as the mono-ionic (H2AsO4−) species and also due to the differences in the pKi values of H3AsO4. The various dissociation reactions for the three arsenic species are shown in mol/dm3 [19]:
| 4 |
| 5 |
| 6 |
Fig. 11.
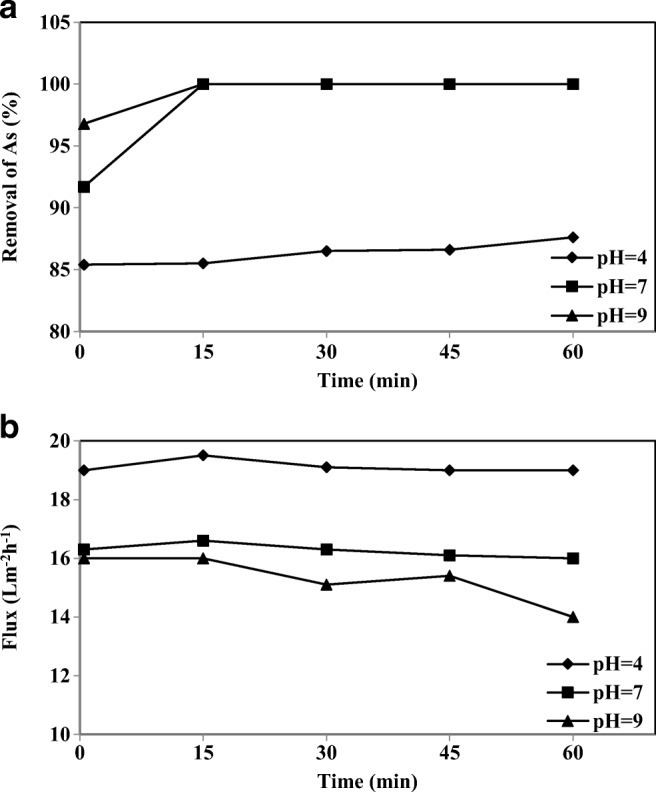
Effect of pH on the a) removal of As-V and b) permeate flux at different intervals (As-V concentration 1000 μgl−1, CPC 3 mM, membrane thickness 150 μm)
Equilibrium concentrations of As-V species were calculated at different pH values from the pKai (i = 1, 2, and 3) data using Eqs. (4) to (6). For example, at pH 1.0, the As-V species are mostly in the neutral form. From pH 2.22 to 6.98, the As-V species moves to the mono-anionic form, and from pH 6.98, the mono-anionic form of As-V dissociates to the di-anionic species. At pH 11.4, the di-anionic form of As-V dissociates to the tri-anionic form. Therefore, the highest arsenic removal occurs at pH 7 and 9 because of the di- and tri-anionic forms of As-V probably bind to the surfactant micelles [15, 19].
Also, the influence of pH on the permeate flux is illustrated in Fig. 11(b), whereas an increase in the feed water pH from 4 to 9 decreases the permeate flux of the UF membrane by 15.7%. At pH 7 and 9, HAsO42− ion attaches to the two CPC surfactant groups, allowing the closer packing of the surfactant head groups. Thus, the cross-sectional area occupied by the surfactant head group at the micelle-solution interface becomes smaller possibly affecting the shape of the micelle (changing from a spherical to cylindrical micelle) and this transformation increases the micellar aggregation number [61]. Consequently, due to this accumulation of the closely packed layer of surfactant aggregates on the membrane surface, the permeate flux decreases even more.
Effect of as-V concentration
The influence of different As-V concentrations at different intervals for a constant concentration of CPC (3 mM) is shown in Fig. 12(a). It is clear that the arsenic concentration in the permeate solution increased for higher feed As-V concentrations. This effect was due to the reaction of As-V ions with a constant concentration of CPC. For greater concentrations of As-V, all the ions did not react with the micelles and therefore were not separated by the UF membrane. For 100, 500 and 1000 μgl−1 feed concentrations, complete removal of As-V was observed in the first 15 min operation, but for 5000 μgl−1 feed concentration, the As-V concentration of permeate was higher than the MCL of 10 μgl−1 (safe limit). It is evident from Fig. 12(a), that for the high concentration of As-V, the removal of As-V decreased with time. This occurred due to the deposition of additional micelles on the membrane surface, which resulted in an increase in the membrane surface concentration (concentration polarization). Consequently, there was an increase in the transport of the As-V to the permeate side and this increased the permeate side concentration. Purkait et al. [62] reported a similar trend for the removal of dye by micellar enhanced UF applying a CPC with a polyamide membrane. Also, the increase of As-V concentration in the feed water leads to a decrease in the permeate flux (Fig. 12(b)). This decline in flux is attributed to the dynamic exchange between the surfactant chloride counter-ion, and the coexisting As-V anion. The increase in As-V concentration produces more CP (As-V) micelles in equilibrium. The amount of CP (As-V) micelles is large relative to the CP (Cl−) micelles. Therefore, these block more membrane pores thus decreasing the permeate flux (24). For As-V concentration of 5000 μgl−1, the flux was measured as 15.8% pure water.
Fig. 12.
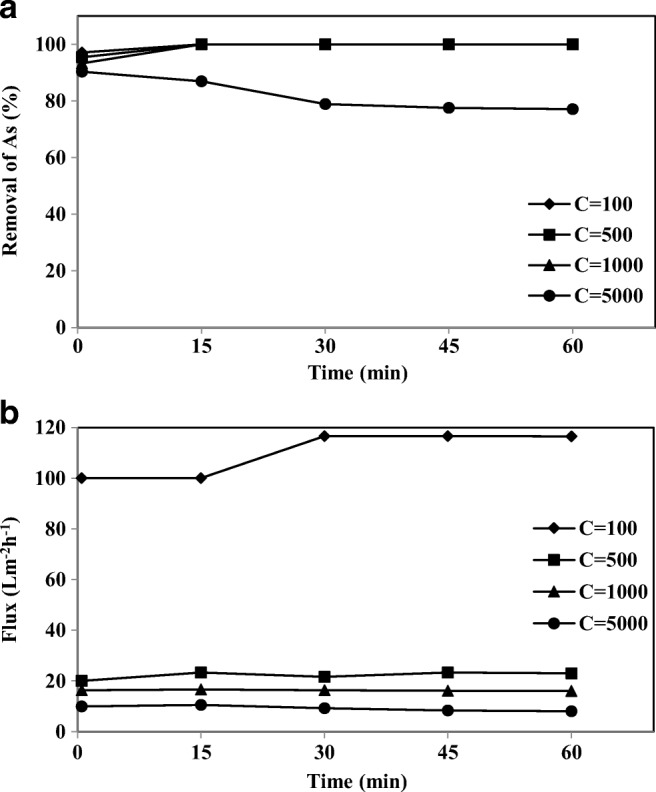
The effect of As-V different concentration on a) removal of As-V and b) permeate flux at different intervals (CPC 3 mM, membrane thickness 150 μm, pH 7)
Effect of membrane thickness
The removal of As-V and the membrane permeate flux at different thicknesses were also studied at the pressure of 1 bar in Fig. 13(a) and (b). As the thickness was increased from 50 to 150 μm, the removal of As-V increased from 89 to 96.94% and the flux decreased from 47.3 to 16.6 Lm−2 h−1 in the first 15 min, which this is due to increased mass transfer resistance. The water flux results showed that the PAN has a low hydraulic resistance relative to the change in the layer thickness. In the case of a thinner membrane, a lower permeate flux can be achieved primarily due to lower mass transfer resistance and shorter overall transport path [63, 64]. This finding is similar to the studies by Liu et al. (2013), which have reported that with an increasing thickness of electrospun PVA membrane from 20 to 40 μm, the pure water flux was decreased from 7382 ± 462 to 4767 ± 457 Lm−2 h−1.
Fig. 13.
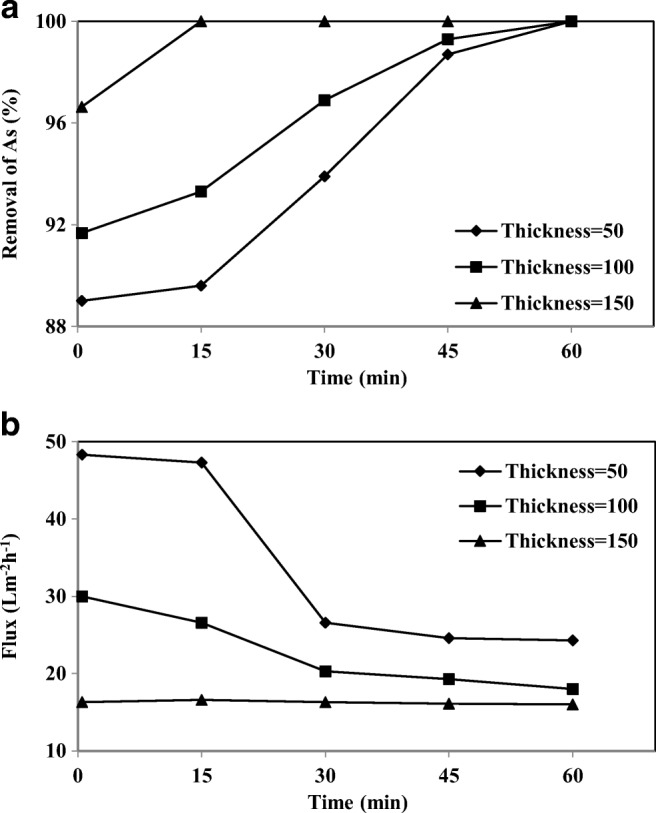
The effect of membrane thickness on a) removal of As-V and b) permeate flux at different intervals (As concentration 1000 μgl−1, CPC 3 mM, pH 7)
Effect of co-existing anion on as-V removal
Small quantities of nitrate ([NO3−] 100 mg/l) have been added to study the effect of this ion on the removal of As-V from aqueous solution. Figure 14(a) shown that As-V removal efficiency decreased by 4–6%. The decrease in the As-V removal is due to the competition for the accessible binding sites of CPC micelles, a reduction in electrostatic repulsion, and the disintegration of CPC micelles (1). It shows there is competitive binding to CPC micelles between NO3− and As-V. As a result, As-V ions bind to CPC micelles preferentially, and NO3− binds to the micelles after the binding of arsenic species has reached saturation. Baek et al. reported that the removal of ferric cyanide (trivalent anions) was higher than that of chromate (divalent anion) removal in the MEUF. In the conditions for the co-existence of ferric cyanide and chromate, ferric cyanide binds to CPC micelles more preferentially than to chromate, after saturation of ferric cyanide binding, the binding of chromate started to increase sharply [51]. The presence of NO3− decreases the permeate flux by about 17% compared to the condition without ions as shown in Fig. 14(b).
Fig. 14.
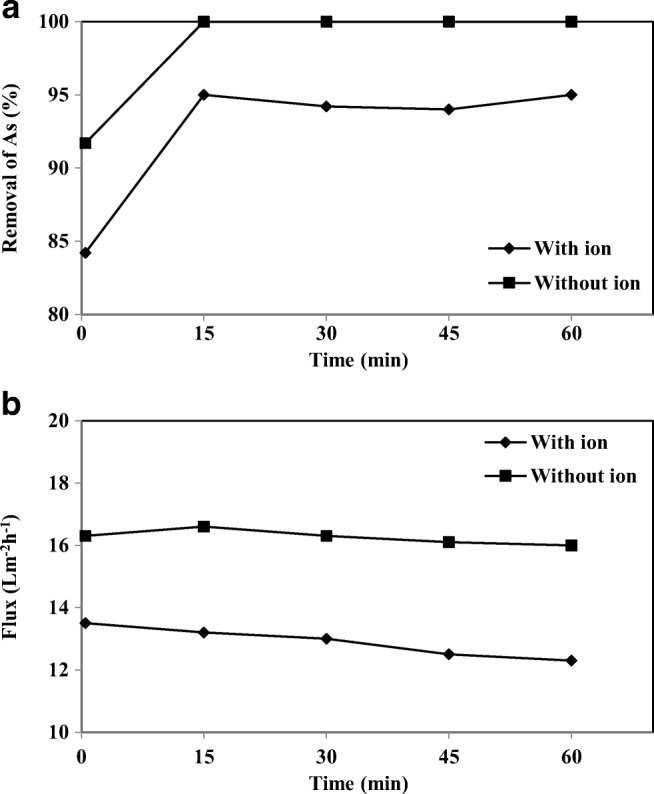
Effect of nitrate on a) removal of As-V and b) permeate flux at different intervals (As-V concentration 1000 μgl−1, CPC 3 mM, membrane thickness 150 μm, pH 7)
Evaluation of MEUF performance for real samples
Water samples were received from wells in the Kurdistan rural areas in Iran. The average arsenic concentration of the water of the well was 93 μgl−1. In addition to arsenic, the major constituents of the well waters included TDS, alkalinity, chloride, sulfate, calcium, and magnesium. The well water was treated as received with no pH adjustment and using the same operating conditions applied to the syntactic samples (CPC 3 mM, TMP 1 bar, membrane thickness 150 μm). The results are shown in the Table 3. The arsenic concentration in permeate water was analysed and found to be below the detection limit of the ICP (1 μgl−1). In addition to arsenic removal, a significant amount of co-ions, sulfate, and chloride were removed from the water, suggesting that enough binding sites on the micellar aggregates were available. Wimalawansa et al. used reverse osmosis technology for the treatment of contaminated water. The results demonstrated that a properly designed reverse osmosis system is capable of removing more than 95% of all potential toxic contaminants and also other essential elements required for health, that is, Na, Ca, Mg [65]. However, the PAN fabricated membrane in comparison to RO and NF processes selectively removed the arsenic and anionic ions from the water but did not substantially affect the cationic ions, TDS, Ca, and Mg, which was shown as the novelty of this work. The CPC rejection was measured as 99.98%. The occurrence of several inorganic solutes in the well-water decreased the permeate flux. The permeate flux was found to be about 31% of the pure water flux (63.1 Lm−2 h−1).
Table 3.
Chemical analysis of treated wells waters using a PAN membrane and 3 mM CPC
| Parameter (ppm) | Untreated water (ppm) | Treated water (ppm) | Removal (%) | Removal (%) in RO [65] |
|---|---|---|---|---|
| Arsenic | 0.093 | ND* | 99.99 | 95 |
| TDS | 210 | 200.2 | 4.7 | – |
| Alkalinity | 437.1 | 411 | 3.5 | – |
| Chloride | 40.8 | 1.2 | 97 | 92 |
| Sulfate | 146.44 | 6.4 | 95 | 94 |
| Calcium | 104.21 | 98 | 6 | 97 |
| Magnesium | 33.9 | 31 | 8.5 | 96 |
| pH | 7.8 | 7.8 | 0 | – |
*ND Not detectable
Cross-flow experiments
Based on the results, the optimal operating conditions were: feed water containing As-V (1000 ppb) and CPC (3 mM) for the cross-flow cell. Figure 15(a) and (b) demonstrated the comparison between the dead-end and cross-flow systems on the removal efficiency of As-V and the permeate flux. The removal in the cross-flow system was quite comparable to that of the dead-end system, but in the case of the flux, the cross-flow system exhibited a higher flux as well as a lower flux decline compared with the dead-end system. In the cross-flow system, the pure water flux was 43.2 Lm−2 h−1 and the actual solution flux was about 41.7% of the pure water flux.
Fig. 15.
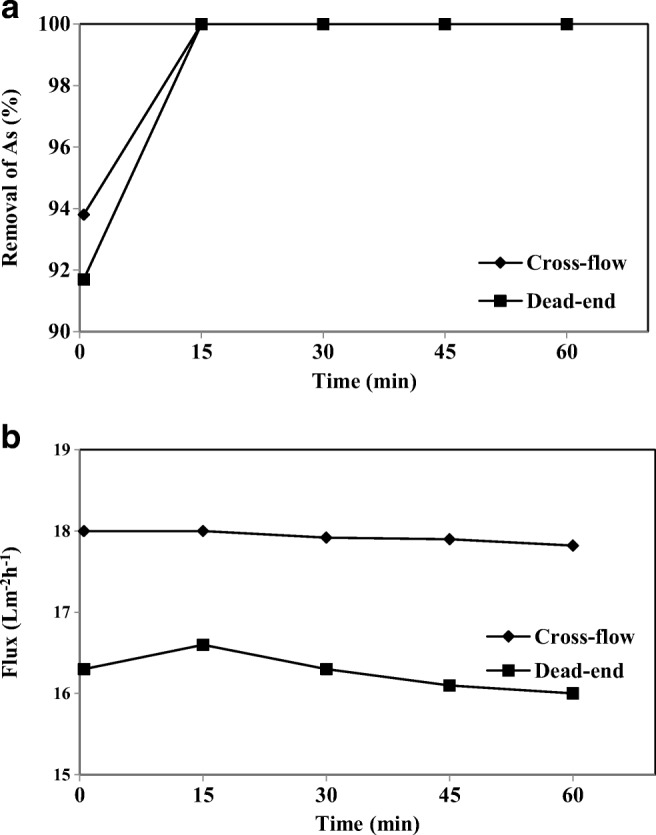
Comparison of cross-flow and dead-end systems: a) removal of As-V and b) permeate flux
Conclusion
A PAN UF membrane was produced using the phase inversion method and the morphology and characterization of the membrane were performed. The experimental results, demonstrated that the novel PAN membrane developed, had a high molecular weight, which allowed the treatment of large fluxes of concentrated As-V containing solution (100–5000 μgl−1), even only using low surfactant concentrations (1–3 mM). The removal of As-V depended on the characteristics of the surfactant. The highest removal efficiency was obtained using the CPC membrane. The UF membrane without the surfactant micelles was not very effective for As-V removal and the surfactant leakage in the permeate was always below the CMC. The removal of As-V was strongly dependent on pH because the oxidation states (or valence) of As-V change as a function of pH. In the presence of other anionic species the competition between As-V and nitrate resulted in only a slight decrease in the removal efficiency. In the case of the cross-flow filtration method, a similar removal of As-V and rejection of surfactant were obtained, while the decline in flux was much lower than in the dead-end system. Initially, 100% removal was achieved for the 100–1000 μgl−1 range of As-V concentrations, at pH 7, and using a membrane thickness 150 μm. The PAN fabricated membrane, in comparison to RO and NF processes, selectively removed the arsenic (below the detection limit of AA, 1 μgl−1) and anionic ions from the well water and did not substantially affect the removal of the cationic ions. This favorable combination can benefit the removal of As-V from the water in water treatment systems.
Acknowledgements
This manuscript is extracted from the Ph.D. thesis of the first author and approved by the Environmental Health Research Center and funded by the Kurdistan University of Medical Sciences (IR.MUK.REC.1394/57). The authors offer their thanks to the sponsors of the project. We also thank Prof. Mohammad Ali Zazouli for the scientific comments in editing the article.
Compliance with ethical standards
Conflict of interest
There is no conflict of interest.
Footnotes
Publisher’s note
Springer Nature remains neutral with regard to jurisdictional claims in published maps and institutional affiliations.
Contributor Information
Afshin Maleki, Email: maleki43@yahoo.com.
Gordon McKay, Email: gmckay@qf.org.qa.
References
- 1.Liu X, Zhang W, Hu Y, Hu E, Xie X, Wang L, Cheng H. Arsenic pollution of agricultural soils by concentrated animal feeding operations (CAFOs) Chemosphere. 2015;119:273–281. doi: 10.1016/j.chemosphere.2014.06.067. [DOI] [PubMed] [Google Scholar]
- 2.Jais FM, Ibrahim S, Yoon Y, Jang M. Enhanced arsenate removal by lanthanum and nano–magnetite composite incorporated palm shell waste–based activated carbon. Sep Purif Technol. 2016;169:93–102. [Google Scholar]
- 3.Zazouli MA, Bandpei AM, Maleki A, Saberian M, Izanloo H. Determination of cadmium and lead contents in black tea and tea liquor from Iran. Asian J Chem. 2010;22(2):1387. [Google Scholar]
- 4.Lien H-L, Wilkin RT. High-level arsenite removal from groundwater by zero-valent iron. Chemosphere. 2005;59(3):377–386. doi: 10.1016/j.chemosphere.2004.10.055. [DOI] [PubMed] [Google Scholar]
- 5.Rezaee R, Nasseri S, Mahvi AH, Nabizadeh R, Mousavi SA, Rashidi A, Jafari A, Nazmara S. Fabrication and characterization of a polysulfone-graphene oxide nanocomposite membrane for arsenate rejection from water. J Environ Health Sci Eng. 2015;13(1):61. doi: 10.1186/s40201-015-0217-8. [DOI] [PMC free article] [PubMed] [Google Scholar]
- 6.Agency for Toxic Substances and Diesease Registry (ATSDR), ToxFAQs for arsenic. (2001).
- 7.Water, U.S.E.P.A.O.o.: 2004 Edition of the drinking water standards and health advisories. United States Environmental Protection Agency, Office of Water, (2004).
- 8.Organization, W.H.: Guidelines for drinking-water quality: incorporating first and second addenda to third edition, Vol. 1, Recommendations. In. Geneva: WHO Press, (2008).
- 9.Ebrahimi R, Maleki A, Shahmoradi B, Daraei H, Mahvi AH, Barati AH, Eslami A. Elimination of arsenic contamination from water using chemically modified wheat straw. Desalin Water Treat. 2013;51(10–12):2306–2316. [Google Scholar]
- 10.Jiang Y, Zeng X, Fan X, Chao S, Zhu M, Cao H. Levels of arsenic pollution in daily foodstuffs and soils and its associated human health risk in a town in Jiangsu Province, China. Ecotoxicol Environ Saf. 2015;122:198–204. doi: 10.1016/j.ecoenv.2015.07.018. [DOI] [PubMed] [Google Scholar]
- 11.McArthur J, Ghosal U, Sikdar P, Ball J. Arsenic in groundwater: the deep late pleistocene aquifers of the Western Bengal Basin. Environ Sci Technol. 2016;50(7):3469–3476. doi: 10.1021/acs.est.5b02477. [DOI] [PubMed] [Google Scholar]
- 12.Jebelli MA, Maleki A, Amoozegar MA, Kalantar E, Shahmoradi B, Gharibi F. Isolation and identification of indigenous prokaryotic bacteria from arsenic-contaminated water resources and their impact on arsenic transformation. Ecotoxicol Environ Saf. 2017;140:170–176. doi: 10.1016/j.ecoenv.2017.02.051. [DOI] [PubMed] [Google Scholar]
- 13.Barati A, Maleki A, Alasvand M. Multi-trace elements level in drinking water and the prevalence of multi-chronic arsenical poisoning in residents in the west area of Iran. Sci Total Environ. 2010;408(7):1523–1529. doi: 10.1016/j.scitotenv.2009.12.035. [DOI] [PubMed] [Google Scholar]
- 14.Mohanty D. Conventional as well as emerging arsenic removal technologies—a critical review. Water Air Soil Pollut. 2017;228(10):381. [Google Scholar]
- 15.Gecol H, Ergican E, Fuchs A. Molecular level separation of arsenic (V) from water using cationic surfactant micelles and ultrafiltration membrane. J Membr Sci. 2004;241(1):105–119. [Google Scholar]
- 16.Lakshmipathiraj P, Prabhakar S, Raju GB. Studies on the electrochemical decontamination of wastewater containing arsenic. Sep Purif Technol. 2010;73(2):114–121. [Google Scholar]
- 17.Meng C, Mao Q, Luo L, Zhang J, Wei J, Yang Y, et al. Performance and mechanism of as (III) removal from water using Fe-Al bimetallic material. Sep Purif Technol. 2017.
- 18.Jebeli MA, Maleki A, Amoozegar MA, Kalantar E, Izanloo H, Gharibi F. Bacillus flexus strain as-12, a new arsenic transformer bacterium isolated from contaminated water resources. Chemosphere. 2017;169:636–641. doi: 10.1016/j.chemosphere.2016.11.129. [DOI] [PubMed] [Google Scholar]
- 19.Chen M, Shafer-Peltier K, Randtke SJ, Peltier E. Modeling arsenic (V) removal from water by micellar enhanced ultrafiltration in the presence of competing anions. Chemosphere. 2018;213:285–294. doi: 10.1016/j.chemosphere.2018.09.046. [DOI] [PubMed] [Google Scholar]
- 20.Zheng Y, Wang A. Removal of heavy metals using polyvinyl alcohol semi-IPN poly (acrylic acid)/tourmaline composite optimized with response surface methodology. Chem Eng J. 2010;162(1):186–193. [Google Scholar]
- 21.Cui J, Jing C, Che D, Zhang J, Duan S. Groundwater arsenic removal by coagulation using ferric (III) sulfate and polyferric sulfate: a comparative and mechanistic study. J Environ Sci. 2015;32:42–53. doi: 10.1016/j.jes.2014.10.020. [DOI] [PubMed] [Google Scholar]
- 22.Hong J, Zhu Z, Lu H, Qiu Y. Synthesis and arsenic adsorption performances of ferric-based layered double hydroxide with α-alanine intercalation. Chem Eng J. 2014;252:267–274. [Google Scholar]
- 23.Misra R, Jain S, Khatri P. Iminodiacetic acid functionalized cation exchange resin for adsorptive removal of Cr (VI), cd (II), Ni (II) and Pb (II) from their aqueous solutions. J Hazard Mater. 2011;185(2):1508–1512. doi: 10.1016/j.jhazmat.2010.10.077. [DOI] [PubMed] [Google Scholar]
- 24.Dominguez-Ramos A, Chavan K, García Vn, Jimeno G, Albo J, Marathe KV, Yadav GD, Irabien A. Arsenic removal from natural waters by adsorption or ion exchange: an environmental sustainability assessment. Ind Eng Chem Res. 2014;53(49):18920–18927. [Google Scholar]
- 25.Molinari R, Argurio P. Arsenic removal from water by coupling photocatalysis and complexation-ultrafiltration processes: a preliminary study. Water Res. 2017;109:327–336. doi: 10.1016/j.watres.2016.11.054. [DOI] [PubMed] [Google Scholar]
- 26.Mondal P, Tran ATK, Van der Bruggen B. Removal of as (V) from simulated groundwater using forward osmosis: effect of competing and coexisting solutes. Desalination. 2014;348:33–38. [Google Scholar]
- 27.Xiao S, Ma H, Shen M, Wang S, Huang Q, Shi X. Excellent copper (II) removal using zero-valent iron nanoparticle-immobilized hybrid electrospun polymer nanofibrous mats. Colloids Surf A Physicochem Eng Asp. 2011;381(1):48–54. [Google Scholar]
- 28.Krishnamoorthy R, Sagadevan V. Polyethylene glycol and iron oxide nanoparticles blended polyethersulfone ultrafiltration membrane for enhanced performance in dye removal studies. E-Polymers. 2015;15(3):151–159. [Google Scholar]
- 29.Wang X, Fang D, Yoon K, Hsiao BS, Chu B. High performance ultrafiltration composite membranes based on poly (vinyl alcohol) hydrogel coating on crosslinked nanofibrous poly (vinyl alcohol) scaffold. J Membr Sci. 2006;278(1):261–268. [Google Scholar]
- 30.Samper E, Rodríguez M, De la Rubia M, Prats D. Removal of metal ions at low concentration by micellar-enhanced ultrafiltration (MEUF) using sodium dodecyl sulfate (SDS) and linear alkylbenzene sulfonate (LAS) Sep Purif Technol. 2009;65(3):337–342. [Google Scholar]
- 31.Juang R-S, Lin S-H, Peng L-C. Flux decline analysis in micellar-enhanced ultrafiltration of synthetic waste solutions for metal removal. Chem Eng J. 2010;161(1–2):19–26. [Google Scholar]
- 32.Huang J, Yuan F, Zeng G, Li X, Gu Y, Shi L, Liu W, Shi Y. Influence of pH on heavy metal speciation and removal from wastewater using micellar-enhanced ultrafiltration. Chemosphere. 2017;173:199–206. doi: 10.1016/j.chemosphere.2016.12.137. [DOI] [PubMed] [Google Scholar]
- 33.Rahmanian B, Pakizeh M, Maskooki A. Micellar-enhanced ultrafiltration of zinc in synthetic wastewater using spiral-wound membrane. J Hazard Mater. 2010;184(1–3):261–267. doi: 10.1016/j.jhazmat.2010.08.031. [DOI] [PubMed] [Google Scholar]
- 34.Iqbal J, Kim H-J, Yang J-S, Baek K, Yang J-W. Removal of arsenic from groundwater by micellar-enhanced ultrafiltration (MEUF) Chemosphere. 2007;66(5):970–976. doi: 10.1016/j.chemosphere.2006.06.005. [DOI] [PubMed] [Google Scholar]
- 35.Dunn RO, Jr, Scamehorn JF, Christian SD. Use of micellar-enhanced ultrafiltration to remove dissolved organics from aqueous streams. Sep Sci Technol. 1985;20(4):257–284. [Google Scholar]
- 36.De, S., Mondal, S.: Micellar enhanced ultrafiltration: Fundamentals & Applications. CRC Press, (2012).
- 37.Purkait M, DasGupta S, De S. Micellar enhanced ultrafiltration of eosin dye using hexadecyl pyridinium chloride. J Hazard Mater. 2006;136(3):972–977. doi: 10.1016/j.jhazmat.2006.01.040. [DOI] [PubMed] [Google Scholar]
- 38.Camarillo R, Asencio I, Rincón J. Micellar enhanced ultrafiltration for phosphorus removal in domestic wastewater. Desalin Water Treat. 2009;6(1–3):211–216. [Google Scholar]
- 39.Baek K, Kim B-K, Yang J-W. Application of micellar enhanced ultrafiltration for nutrients removal. Desalination. 2003;156(1–3):137–144. [Google Scholar]
- 40.Jana DK, Roy K, Dey S. Comparative assessment on lead removal using micellar-enhanced ultrafiltration (MEUF) based on a type-2 fuzzy logic and response surface methodology. Sep Purif Technol. 2018;207:28–41. [Google Scholar]
- 41.Huang J, Li H, Zeng G, Shi L, Gu Y, Shi Y, et al. Removal of cd (II) by MEUF-FF with anionic-nonionic mixture at low concentration. Sep Purif Technol. 2018.
- 42.Grzegorzek M, Majewska-Nowak K. The use of micellar-enhanced ultrafiltration (MEUF) for fluoride removal from aqueous solutions. Sep Purif Technol. 2018;195:1–11. [Google Scholar]
- 43.Geanta RM, Ruiz MO, Escudero I. Micellar-enhanced ultrafiltration for the recovery of lactic acid and citric acid from beet molasses with sodium dodecyl sulphate. J Membr Sci. 2013;430:11–23. [Google Scholar]
- 44.Acero JL, Benitez FJ, Real FJ, Teva F. Removal of emerging contaminants from secondary effluents by micellar-enhanced ultrafiltration. Sep Purif Technol. 2017;181:123–131. [Google Scholar]
- 45.Huang J, Peng L, Zeng G, Li X, Zhao Y, Liu L, Li F, Chai Q. Evaluation of micellar enhanced ultrafiltration for removing methylene blue and cadmium ion simultaneously with mixed surfactants. Sep Purif Technol. 2014;125:83–89. [Google Scholar]
- 46.Tanhaei B, Chenar MP, Saghatoleslami N, Hesampour M, Laakso T, Kallioinen M, Sillanpää M, Mänttäri M. Simultaneous removal of aniline and nickel from water by micellar-enhanced ultrafiltration with different molecular weight cut-off membranes. Sep Purif Technol. 2014;124:26–35. [Google Scholar]
- 47.Li Q, Jensen JO, Savinell RF, Bjerrum NJ. High temperature proton exchange membranes based on polybenzimidazoles for fuel cells. Prog Polym Sci. 2009;34(5):449–477. [Google Scholar]
- 48.Park JS, Lee SH, Han TH, Kim SO. Hierarchically ordered polymer films by templated organization of aqueous droplets. Adv Funct Mater. 2007;17(14):2315–2320. [Google Scholar]
- 49.Khamforoush M, Pirouzram O, Hatami T. The evaluation of thin film composite membrane composed of an electrospun polyacrylonitrile nanofibrous mid-layer for separating oil–water mixture. Desalination. 2015;359:14–21. [Google Scholar]
- 50.Jana S, Saikia A, Purkait M, Mohanty K. Chitosan based ceramic ultrafiltration membrane: preparation, characterization and application to remove hg (II) and as (III) using polymer enhanced ultrafiltration. Chem Eng J. 2011;170(1):209–219. [Google Scholar]
- 51.Baek K, Yang T-W. Competitive bind of anionic metals with cetylpyridinium chloride micelle in micellar-enhanced ultrafiltration. Desalination. 2004;167:101–110. [Google Scholar]
- 52.Kim B-K, Baek K, Yang J-W. Simultaneous removal of nitrate and phosphate using cross-flow micellar-enhanced ultrafiltration (MEUF) Water Sci Technol. 2004;50(6):227. [PubMed] [Google Scholar]
- 53.Beolchini F, Pagnanelli F, De Michelis I, Vegliò F. Micellar enhanced ultrafiltration for arsenic (V) removal: effect of main operating conditions and dynamic modelling. Environ Sci Technol. 2006;40(8):2746–2752. doi: 10.1021/es052114m. [DOI] [PubMed] [Google Scholar]
- 54.Malaisamy R, Berry D, Holder D, Raskin L, Lepak L, Jones KL. Development of reactive thin film polymer brush membranes to prevent biofouling. J Membr Sci. 2010;350(1–2):361–370. [Google Scholar]
- 55.Beolchini F, Pagnanelli F, De Michelis I, Veglio F. Treatment of concentrated arsenic (V) solutions by micellar enhanced ultrafiltration with high molecular weight cut-off membrane. J Hazard Mater. 2007;148(1–2):116–121. doi: 10.1016/j.jhazmat.2007.02.031. [DOI] [PubMed] [Google Scholar]
- 56.Ergican E, Gecol H, Fuchs A. The effect of co-occurring inorganic solutes on the removal of arsenic (V) from water using cationic surfactant micelles and an ultrafiltration membrane. Desalination. 2005;181(1–3):9–26. [Google Scholar]
- 57.Morel G, Ouazzani N, Graciaa A, Lachaise J. Surfactant modified ultrafiltration for nitrate ion removal. J Membr Sci. 1997;134(1):47–57. [Google Scholar]
- 58.Juang R-S, Xu Y-Y, Chen C-L. Separation and removal of metal ions from dilute solutions using micellar-enhanced ultrafiltration. J Membr Sci. 2003;218(1):257–267. [Google Scholar]
- 59.Tanhaei B, Chenar MP, Saghatoleslami N, Hesampour M, Kallioinen M, Sillanpää M, Mänttäri M. Removal of nickel ions from aqueous solution by micellar-enhanced ultrafiltration, using mixed anionic–non-ionic surfactants. Sep Purif Technol. 2014;138:169–176. [Google Scholar]
- 60.Baek K, Lee H-H, Yang J-W. Micellar-enhanced ultrafiltration for simultaneous removal of ferricyanide and nitrate. Desalination. 2003;158(1–3):157–166. [Google Scholar]
- 61.Rosen, M.J., Kunjappu, J.T.: Surfactants and interfacial phenomena. John Wiley & Sons, (2012).
- 62.Purkait M, DasGupta S, De S. Removal of dye from wastewater using micellar-enhanced ultrafiltration and recovery of surfactant. Sep Purif Technol. 2004;37(1):81–92. [Google Scholar]
- 63.Olcay AN, Polat M, Polat H. Ancillary effects of surfactants on filtration of low molecular weight contaminants through cellulose nitrate membrane filters. Colloids Surf A Physicochem Eng Asp. 2016;492:199–206. [Google Scholar]
- 64.Liu Y, Wang R, Ma H, Hsiao BS, Chu B. High-flux microfiltration filters based on electrospun polyvinylalcohol nanofibrous membranes. Polymer. 2013;54(2):548–556. [Google Scholar]
- 65.Wimalawansa SJ. Purification of contaminated water with reverse osmosis: effective solution of providing clean water for human needs in developing countries. J Emerg Technol Adv Eng. 2013;3(12):75–89. [Google Scholar]


