

Abstract
Floral authenticity of coriander (Coriandrum sativum) honey samples was confirmed by melissopalynology. Effect of temperature, time and pH on quality parameters i.e. hydroxymethylfurfural (HMF) content, diastase and invertase activity of coriander honey was analysed using response surface methodology. Central composite rotatable design was adopted for optimization of process variables. An increased in HMF content was observed with increase in temperature and pH whereas diastase activity decreased with increase in temperature and with a pH value other than the optimum value of 4.6–5.6. Invertase activity was maximum at 4.8 pH. Interaction effect of temperature and pH was significant for HMF whereas interaction effect of temperature and time was significant for HMF, diastase and invertase activity. Optimization of variables was done by the mathematical method, and optimized values of HMF content, diastase, and invertase activity were obtained as 7.78 (mg/kg), 17.95 DN and 13.96 IN, respectively at 47.5 °C (temperature), 4.7 (pH) and 9 min (time).
Keywords: Diastase, HMF, Honey, Invertase, RSM
Introduction
Honey is a naturally sweet product, which has been collected and transformed by combining with specific substances from the nectar of plants or from secretions of living parts of the plants by honeybees. Pollen plays an important role to investigate the floral origin of honey. Honey produced from some plant taxa obtains more prices due to its nutritional and therapeutic properties (Bibi et al. 2008). The ideal approach to decide the variety of honey and geographical origin is, to identify and quantify the pollen grains present in the honey (Vaughn and Bryant 2001).
Honey is introduced in the market after applying some processing techniques like heat treatment. Hydroxymethylfurfural (HMF) content, diastase and invertase activity are employed as main quality control for assessing overheating and freshness (Ramirez Cervantes et al. 2000). HMF is a breakdown product of acid-catalyzed dehydration of hexose sugar with fructose and diastase (Yilmaz and Kufrevioglu 2001; Nafea et al. 2014) with an increase in temperature and formation of HMF is self-catalytic (Ghoshdastidar and Chakrabarti 1992). HMF is an important component and is an indicator of the freshness of honey; hence, it is used to assess storage period and overheating (Tosi et al. 2002; Ruoff and Bogdanov 2004). Fresh honey has a very small quantity of HMF content, but it increases with storage period and also depends on honey temperature and pH (Fallico et al. 2004; Visquert et al. 2004). The diastase activity of honey is correlated to the plant taxa and environmental conditions prevailing in the province. White et al. (1964) asserted that invertase might be a superior indicator of honey quality over diastase as invertase is destroyed more rapidly by heating than diastase. According to international regulatory standards, HMF content must < 40 mg/kg (European Economic Community 2002; Codex Alimentarius 2001). The diastase activity must be > 8 DN and invertase activity of honey samples should be > 10 IN (Codex Alimentarius 2001).
White et al. (1964) depicted the effect of storage and increased the temperature on HMF, diastase and invertase. Takenaka and Echigo (1974) observed a decrease in diastase and invertase activity during storage. Honey samples (pine, thymus, cotton, helianthus and orange) from the different origin of Athens were heated at 35, 45, 55, 65 and 75 °C for 24 h and investigators (Karabournioti and Zervalaki 2001) depicted that HMF concentration increased and invertase activity decreased with increase in temperature. Hasan (2013) indicated that there was a decrease in diastase number, invertase content and increase in HMF content, when honey samples were heated at different temperatures, i.e. 55, 65 and 75 °C for 5, 15, 20 and 25 min. Nanda et al. (2006) also reported that there was an increase in HMF content with an increase in temperature and pH whereas diastase activity decreased with increase in temperature. Babacan et al. (2002) also found that at 85 °C there was a significant decrease in the diastase activity.
Various authors revealed suitable application of response surface methodology (RSM) for optimization of several process variables (Nanda et al. 2004, 2006; Singh et al. 2010; Nayik et al. 2016). Correlation of temperature and HMF content, temperature and diastase activity, pH and diastase activity and temperature and invertase activity have been observed by various researchers (Karabournioti and Zervalaki 2001; Nanda et al. 2006; Hasan 2013). However, the effect on HMF content, diastase activity and invertase activity as a function of temperature, pH and time has not been testified until now. The present investigation aims to optimize temperature, pH and time regarding HMF content, diastase activity and invertase activity without altering the quality parameters of honey by using RSM.
Materials and methods
Chemicals and reagents
Carrez solution I, carrez solution II, sodium bisulphite solution, starch solution, acetate buffer solution, sodium chloride, p-nitrophenyl-α-d-glucopyranoside (pNPG) solution and tris-(hydroxymethyl) aminomethane were procured from Fluka Goldie, Mumbai, India.
Honey sample collection and pollen analysis
Twenty honey samples of coriander (Coriandrum sativum) were collected from local beekeepers (Rajasthan). Samples were collected between September 2009 to October 2013 and preserved in glass bottles and stored at a temperature of 4 °C in laboratory refrigerator. Melissopalynology confirmed the source of each honey samples and classified as per their floral source by the method depicted by Von der Ohe et al. (2004). The terms used for classification were: predominant pollen (> 45%), secondary pollen (16–45%), important minor pollen (3–15%) and minor pollen (< 3%).
Heat treatment of honey
The thermal treatment of honey was carried out at a temperature range from 45 to 55 °C for 5–15 min and pH value of honey samples was maintained from 3.8 to 5.8 by acetate buffer solutions (0.1 M of sodium acetate and 0.1 M of acetic acid). Then honey samples were kept in water bath at required temperature after sealing glass containers with rubber stoppers. A thermocouple was also inserted in the glass containers to observe internal temperature of honey. The sample was kept in the water bath for stipulated time after the required internal temperature had been achieved and then cooled to 20 °C in an ice bath. HMF content, diastase and invertase activity of these samples were evaluated in duplicate.
HMF content
HMF was determined by using sodium bisulphite and carrez reagents (I and II) in the honey samples (International Honey Commission 2009). The absorbance of the sample solution against the reference solution at 284 and 336 nm was determined in quartz cuvette by using spectrophotometer (Hach Lange DR6000 UV–VIS Spectrophotometer, Germany). The results were expressed in mg/kg.
Diastase activity
Diastase activity was calculated spectrophotometrically (Hach Lange DR6000 UV–VIS Spectrophotometer, Germany) as per International Honey Commission (2009) using a buffered solution of starch and honey. Results were represented as DN per gram of honey.
Invertase activity
Invertase activity was measured using International Honey Commission (2009) method. p-nitrophenyl-α-d-glucopyranoside (pNPG) was used as a substrate which was decomposed by invertase present in the honey into p-nitrophenol and glucose. To stop the enzymatic reaction pH was adjusted to 9.5 and measured at 400 nm with spectrophotometer (Hach Lange DR6000 UV–VIS Spectrophotometer, Germany). Invertase activity of honey samples was determined by multiplying the absorbance with a factor of 21.64 and expressed as invertase number (IN).
Experimental design
Response surface methodology (RSM) was adopted for the design of experimental combinations using Design-Export version 10.0.3.1 (Statease Inc., Minneapolis, MN, USA) to investigate the combined effect of three variables temperature (45–55 °C), pH (3.8–5.8) and time (5–15 min) on three responses (HMF content, diastase and invertase activity) of honey. Three factor and three levels CCRD consisting of twenty experimental runs with six replicates at centre point were used. The data was examined by multiple regressions using the least square method. The data was fitted into a second order polynomial equation which is as under:
where Yk is response variables (Y1 is HMF content, Y2 is diastase activity and Y3 is invertase activity), T, P and t symbolize the coded independent variables for temperature (°C), pH and time (min), respectively. The value of the fitted response at the centre point of the design i.e. (0,0,0) was βo. β1–3 and β11–33 were the linear and quadratic regression coefficients respectively whereas β12, β13 and β23 were cross-product regression coefficients.
Analysis of variance (ANOVA) was used to test of statistical significance of fitted model. The efficiency of the model was checked by lack of fit tests and R2. The three-dimensional graphs from the regression model were generated from the statistical calculation of regression of coefficients.
Results and discussion
Pollen morphology
Pollen grains of Coriandrum sativum honey were medium in size. Pollens obtained from Coriandrum sativum honey was prolate in shape, size ranged from length 29.8–32.7 μm and breadth 11.9–12.7 μm, having tricolporate aperture, scabrate wall and bilateral symmetry. The amount of pollen present in honey samples is associated with the percentage of pollens of the plant from which nectar has been obtained. Coriander (Coriandrum sativum) honey contained 48% pollen of Coriandrum sp. confirming unifloral honey. Atanassova and Kondova (2004) also observed pollen count > 45% confirming unifloral coriander honey from Bulgaria.
For optimizing the process parameters, i.e. temperature, pH and time to establish the quality parameters of HMF content, diastase activity and invertase activity CCRD was used as described by Khuri and Cornell (1987). The responses of HMF, diastase and invertase activity thus obtained are shown in Table 1.
Table 1.
Effect of variables (temperature, pH and time) on responses HMF, diastase and invertase activity of coriander honey
| Experiment no. | Variable levels | Responses | ||||
|---|---|---|---|---|---|---|
| Temperature (°C) A |
pH B |
Time (min) C |
HMF (mg/kg) | Diastase activity (DN) | Invertase activity (IN) | |
| 1 | 45.0 | 5.8 | 5.0 | 5.07 | 18.88 | 12.71 |
| 2 | 45.0 | 3.8 | 15.0 | 9.29 | 16.33 | 13.38 |
| 3 | 45.0 | 5.8 | 15.0 | 10.01 | 18.03 | 13.89 |
| 4 | 50.0 | 4.8 | 10.0 | 8.74 | 17.62 | 14.22 |
| 5 | 50.0 | 4.8 | 10.0 | 8.86 | 17.72 | 14.27 |
| 6 | 55.0 | 3.8 | 15.0 | 11.09 | 15.63 | 15.69 |
| 7 | 41.6 | 4.8 | 10.0 | 6.69 | 17.95 | 14.97 |
| 8 | 55.0 | 5.8 | 15.0 | 12.99 | 17.28 | 15.71 |
| 9 | 55.0 | 5.8 | 5.0 | 7.13 | 17.81 | 12.87 |
| 10 | 50.0 | 4.8 | 10.0 | 8.81 | 17.73 | 14.33 |
| 11 | 50.0 | 4.8 | 10.0 | 8.87 | 17.72 | 14.35 |
| 12 | 45.0 | 3.8 | 5.0 | 4.75 | 17.19 | 12.07 |
| 13 | 50.0 | 6.5 | 10.0 | 9.26 | 17.23 | 11.17 |
| 14 | 58.4 | 4.8 | 10.0 | 10.14 | 16.45 | 16.96 |
| 15 | 50.0 | 4.8 | 10.0 | 8.79 | 17.72 | 14.38 |
| 16 | 50.0 | 4.8 | 18.4 | 12.37 | 17.59 | 15.79 |
| 17 | 50.0 | 4.8 | 1.6 | 4.15 | 19.01 | 11.89 |
| 18 | 50.0 | 3.1 | 10.0 | 7.52 | 14.67 | 10.84 |
| 19 | 50.0 | 4.8 | 10.0 | 8.89 | 17.74 | 14.26 |
| 20 | 55.0 | 3.8 | 5.0 | 5.95 | 16.26 | 12.59 |
Diagnostics checking of the fitted model
On regression analysis for various models, a large value of correlation coefficient (more than 95%) and a small P value specified that fitted quadratic models had a significant effect on the different response variables. Multiple regression equations were produced relating HMF concentration, diastase and invertase activity to coded levels of the variables.
Models were developed as follows:
where A is temperature; B is pH; C is time; Y1 is HMF; Y2 is diastase activity; Y3 is invertase activity.
Linear, quadratic and interaction effects were estimated for every model. The regression and correlation coefficient for each model are represented in Table 2. The significant coefficients of the second order polynomial equation were calculated from experimental data (Table 2).
Table 2.
Estimated coefficients of fitted quadratic equation for different responses based on t-statistic of coriander honey
| Coefficients | Estimated coefficients | ||
|---|---|---|---|
| HMF (mg/kg) | Diastase activity (DN) | Invertase activity (IN) | |
| Intercept | 8.83*** | 17.71*** | 14.30*** |
| A | 1.01*** | – 0.44*** | 0.59*** |
| B | 0.52*** | 0.80*** | 0.15* |
| C | 2.51*** | – 0.39*** | 1.09*** |
| A2 | – 0.15*** | – 0.17*** | 0.59*** |
| B2 | – 0.16*** | – 0.61*** | – 1.15*** |
| C2 | – 0.21*** | 0.22*** | – 0.15*** |
| AB | 0.26*** | – 0.02 | – 0.11* |
| AC | 0.19*** | 0.07* | 0.43*** |
| BC | 0.14* | 0.01 | – 0.05 |
| R2 | 0.99 | 0.99 | 0.99 |
| Adjusted R2 | 0.99 | 0.99 | 0.99 |
| Predicted R2 | 0.99 | 0.98 | 0.99 |
| Adeq. precision | 140.47 | 87.41 | 92.62 |
| Lack of fit | 0.08 | 0.07 | 0.08 |
Where A: Temperature, B: pH and C: Time
*Significant at P < 0.05; ***Significant at P < 0.0001, df = 9
The ANOVA revealed the suitability of the quadratic model to validate significant regression, low residual values and no lack of fit with coefficients of multiple determinations (R2) is 0.99 for all responses. A higher value of R2 did not mean the adequacy of the model. Consequently, an adjusted R2 of more than 90% were used to calculate the adequacy of the model. In the present study all the responses having adjusted R2 more than 90%.
The temperature had a positive linear effect on HMF content and invertase activity, while a negative linear effect on diastase activity (Table 2). With increase in temperature (45–55 °C) and time (5–15 min) HMF content increased significantly. Several researchers (Singh and Bath 1997; Bath and Singh 1999, 2000) also reported an increase in HMF at elevated temperature and longer storage time. In analysed honey samples, temperature showed the negative quadratic effect on HMF and diastase activity while a positive quadratic effect on invertase activity. Positive linear and the negative quadratic effect was also observed on HMF content, diastase and invertase activity with pH. The time depicted positive linear and negative quadratic effect on HMF content and invertase activity, whereas negative linear and positive quadratic effect on the diastase activity. The effect of temperature and pH was significant on HMF (P < 0.0001) and invertase activity (P < 0.05). HMF formation is correlated with free acid content, total acidity, lactone content, pH and mineral content (Shapla et al. 2018). Time and temperature showed a significant effect (P < 0.0001) on HMF and diastase activity as well as invertase activity (P < 0.05). pH and time interaction effect was significant (P < 0.05) on HMF content of coriander honey. Minimum HMF content (4.15 mg/kg) while maximum diastase activity (19.01 DN) was observed at 50 °C, pH value of 4.8 and 1.6 min duration and a temperature of 55 °C, 5.8 pH and 15 min duration resulted highest HMF content (12.99 mg/kg). The interaction effect of temperature and duration of heating on HMF formation was also highly significant (Bath and Singh 1999) in different Indian honey types. Diastase (14.67 DN) and invertase (10.84 IN) activity was lowest at 50 °C, 3.1 pH and 10 min. Maximum invertase (16.96 IN) activity was observed at a temperature of 58.4 °C, 4.8 pH and 10 min.
Analysis of variance
Second order polynomial model was satisfactory fitted as depicted in ANOVA (Table 3). F value test was carried out to check the significance of the model. The F value of coriander honey for HMF content, diastase activity and invertase activity were 1461, 453.84 and 617.52, respectively. On the basis of F value, it may be concluded that these models sufficiently represented the experimental data for HMF content, diastase and invertase activity.
Table 3.
ANOVA for response surface quadratic model of coriander honey
| Responses | Source of variation | SS | df | MS | F value | P > F |
|---|---|---|---|---|---|---|
| HMF | Model | 105.940 | 9 | 11.770 | 1461.000 | < 0.0001 |
| Residual | 0.081 | 10 | 0.008 | |||
| Lack of fit | 0.064 | 5 | 0.013 | 0.077 | ||
| Pure error | 0.016 | 5 | 0.003 | |||
| Corr. total | 106.020 | 19 | ||||
| Diastase activity | Model | 20.130 | 9 | 2.240 | 453.840 | < 0.0001 |
| Residual | 0.049 | 10 | 0.005 | |||
| Lack of fit | 0.040 | 5 | 0.008 | 0.074 | ||
| Pure error | 0.009 | 5 | 0.001 | |||
| Corr. total | 20.180 | 19 | ||||
| Invertase activity | Model | 49.990 | 9 | 5.550 | 617.520 | < 0.0001 |
| Residual | 0.090 | 10 | 0.009 | |||
| Lack of fit | 0.070 | 5 | 0.010 | 0.084 | ||
| Pure error | 0.019 | 5 | 0.003 | |||
| Corr. total | 50.080 | 19 |
SS sum of squares, df degree of freedom, MS mean square
Conditions for optimum responses
The contour plots for each response were achieved by choosing two independent variables and the third one has the value of the optimum response.
HMF content
HMF is an important component, which is an indicator of purity and freshness of honey; hence, it is used to assess storage time and overheating. Linear terms of variables like temperature, pH and time (Table 2) had a strong significant effect on HMF content (P < 0.0001) and the coefficient of determination (R2) of the fitted model was 0.99.
The surface plot of HMF content as a function of temperature and pH at the constant time indicated that HMF concentration increased as temperature increased from 45 to 55 °C (Fig. 1a) of honey samples. Whereas, at the constant pH, an increase in the concentration of HMF content was observed as the time passed from 5 to 15 min (Fig. 1b). At a constant temperature, as pH increased from 3.8 to 5.8 an increase in the HMF concentration (Fig. 1c) was observed. These results were in close agreement with Nanda et al. (2006). Visquert et al. (2004) also observed an increase in the HMF content with an increase in temperature without pH. The reason to increase in HMF content could be acid catalyzation and dehydration of hexose sugar with fructose and diastase (Yilmaz and Kufrevioglu 2001; Nafea et al. 2014). The heat treatment is not only the reason for increase in HMF, some other factors may also affect HMF, like presence of organic acids, moisture content, sugar profile, pH, water activity (aw) and floral source of the honey (Castro-Vazquez et al. 2007; Barra et al. 2010; Tornuk et al. 2013).
Fig. 1.
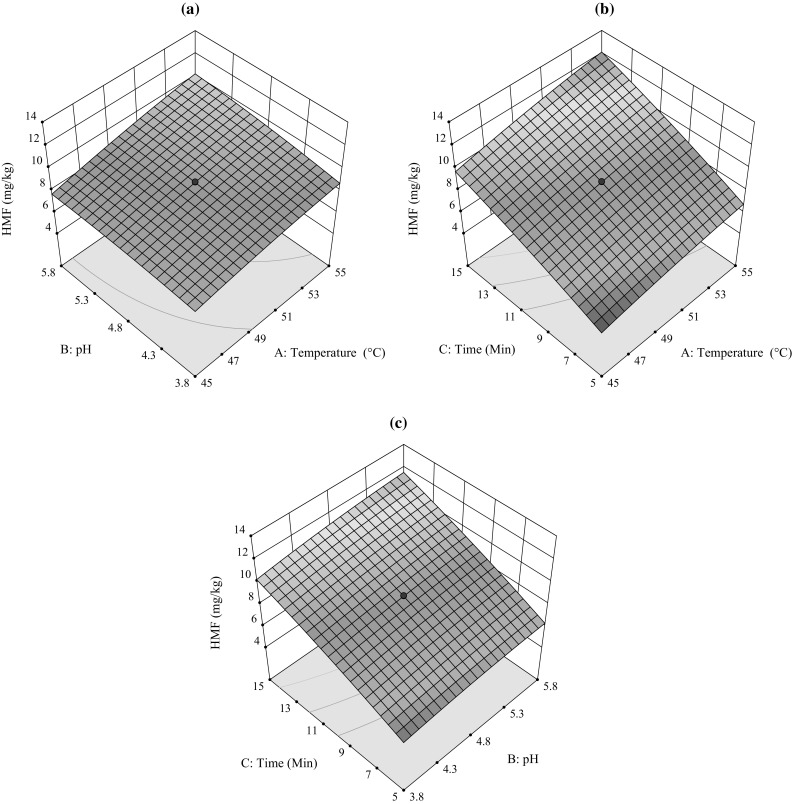
Response surface plot of HMF content as a function of a temperature and pH, b temperature and time, c time and pH of coriander honey
Diastase activity
Diastase present in honey breaks down starch or glycogen into smaller sugars (Bogdanov et al. 2008). The diastase activity of honey is correlated to the plant taxa and environmental conditions of the State. Linear terms of variables like temperature, pH and time (Table 2) had a strong significant effect on diastase activity (P < 0.0001) and the coefficient of determination (R2) of the fitted model was 0.99.
The surface plot of diastase activity at a constant time and as a function of temperature and pH designated that initially, diastase activity increased with increase in pH whereas a further increase in pH resulted in a decrease in diastase activity (Fig. 2a). The present results were comparable with the results of various workers (Babacan et al. 2002; Nanda et al. 2006; Babacan and Rand 2007), which revealed that there is a fall in diastase activity as the pH shifted from 4.6 to 5.6. At low pH with an increase in temperature, a small change in diastase activity was observed (Fig. 2a), whereas at higher pH there was a sharp decline in diastase activity with elevation in the temperature. Figure 2b; revealed that diastase activity decreased with increase in temperature and time in honey samples. It is also observed from the Fig. 2c that at a constant temperature, diastase activity increased with increase in pH.
Fig. 2.
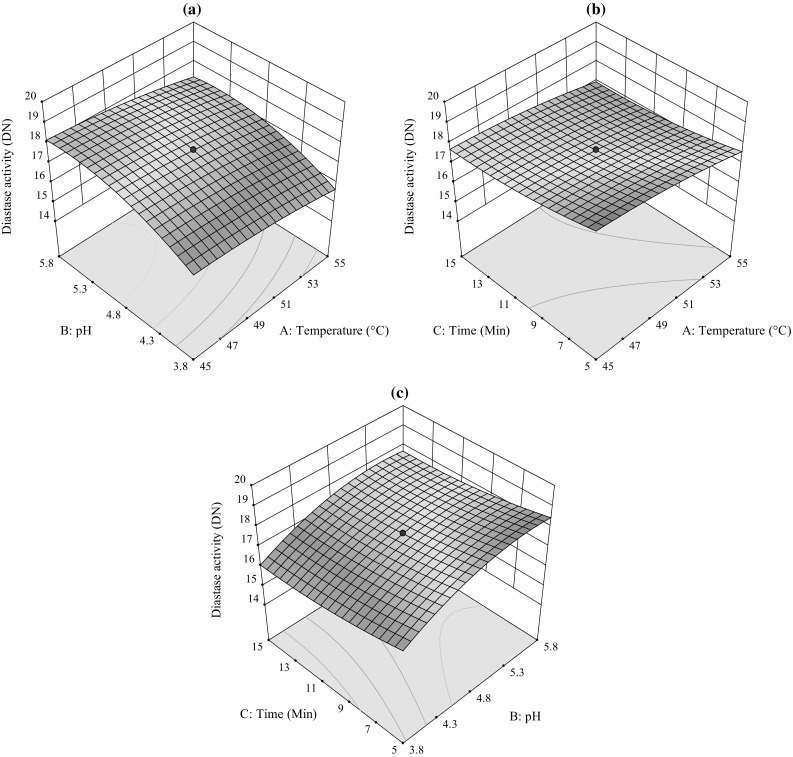
Response surface plot of diastase activity as a function of a temperature and pH, b temperature and time, c time and pH of coriander honey
Invertase activity
Invertase is responsible for most of the chemical changes occur at the time of conversion of the nectar to honey as well as converts sucrose into glucose and fructose (Bogdanov et al. 2008). Invertase is generally available in a small amount, which differs with a botanical source of the honey, and is inactivated by heating (Babacan and Rand 2005). Linear terms of variables like temperature, pH and time (Table 2) had a strong significant effect on invertase activity and the coefficient of determination (R2) of the fitted model was 0.99.
Maximum invertase activity was observed at 4.8 pH (Fig. 3a) which is the optimum pH of invertase (Sacan and Yanardag 2012). The surface plot of invertase activity (Fig. 3b) of honey also revealed that invertase activity is highly influenced by both the variables, i.e. temperature and time. It is observed from the Fig. 3c that at a constant temperature, invertase activity increased with increase in pH.
Fig. 3.
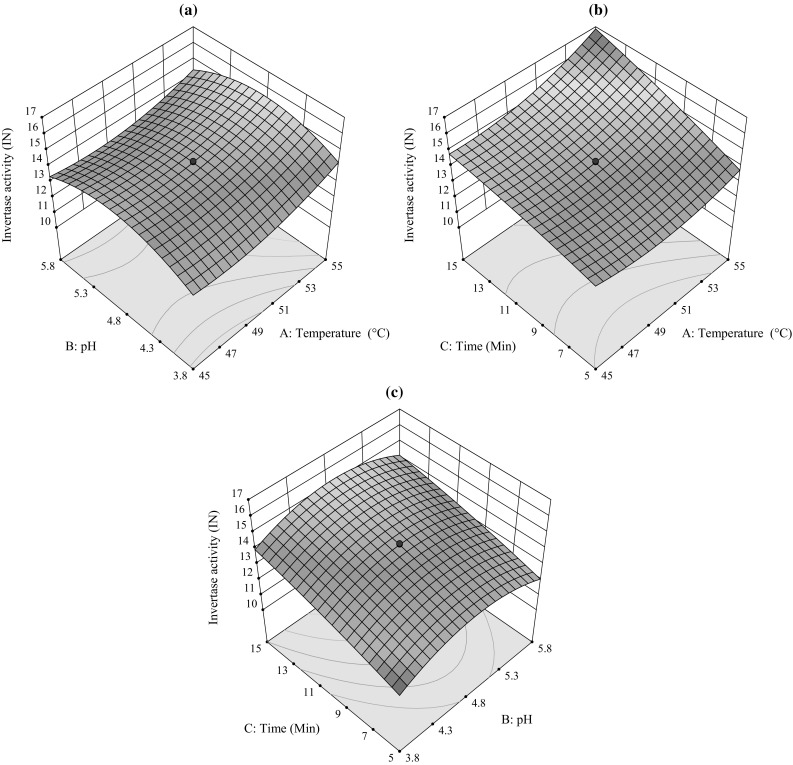
Response surface plot of invertase activity as a function of a temperature and pH, b temperature and time, c time and pH of coriander honey
Optimization of independent variables
The process of optimization of all three process variables were obtained by keeping these variables in range viz. temperature, pH and time in the range of 45–55 °C, 3.8–5.8 and 5–15 min, respectively. Literature reveals that HMF content between 5 and 12.99 mg/kg, diastase activity between 9 and 16.52 DN and invertase activity between 10 and 15.78 IN were acceptable. A minimised concentration of HMF and maximised levels of diastase activity and invertase activity were considered for the optimization process.
The solution was obtained by applying desirability method; the solution was achieved for the optimum covering criteria with a desirability value of 0.851 of coriander honey. The final optimum conditions for HMF (5–12.99 mg/kg), diastase activity (9–16.52 DN) and invertase activity (10–15.78 IN) were computed. The optimum conditions were experimentally tested and obtained HMF content of 7.78 mg/kg, diastase activity of 17.95 DN and invertase activity of 13.96 IN of coriander honey. These experimental values at the optimum reaction conditions were in good agreement with the predicted values.
Conclusion
Under the present investigation, the RSM was used and found very useful for optimization of HMF content, diastase activity and invertase activity. Optimized values of HMF content, diastase activity and invertase activity were obtained as 7.78 (mg/kg), 17.95 DN and 13.96 IN, respectively at 47.5 °C (temperature), 4.7 (pH) and 9 min (time). It may be concluded that the values obtained under the present study were found within the range of prescribed limits for these parameters.
Acknowledgements
The first author is thankful to local beekeepers of Rajasthan (India) for providing honey samples.
Compliance with ethical standards
Conflict of interest
The authors declare that they have no conflict of interests.
Footnotes
Publisher's Note
Springer Nature remains neutral with regard to jurisdictional claims in published maps and institutional affiliations.
References
- Atanassova J, Kondova V. Pollen and chemical-physical analysis of unifloral honey from different regions of Bulgaria. Phytol Balc. 2004;10(1):45–50. [Google Scholar]
- Babacan S, Rand AG. Purification of amylase from honey. J Food Sci. 2005;70:413–418. doi: 10.1111/j.1365-2621.2005.tb11439.x. [DOI] [Google Scholar]
- Babacan S, Rand AG. Characterization of honey amylase. J Food Sci. 2007;72:50–55. doi: 10.1111/j.1750-3841.2006.00215.x. [DOI] [PubMed] [Google Scholar]
- Babacan S, Pivarnik LF, Rand AG. Honey amylase activity and food starch degradation. J Food Sci. 2002;67:1625–1630. doi: 10.1111/j.1365-2621.2002.tb08695.x. [DOI] [Google Scholar]
- Barra MPG, Ponce-Diaz MC, Venegas-Gallegos C. Volatile compounds in honey produced in the central valley of Nuble Province, Chile. Chile J Agric Res. 2010;70:75–84. [Google Scholar]
- Bath PK, Singh N. A comparison between Helianthus annuus and Eucalyptus lanceolatus honey. Food Chem. 1999;67:389–397. doi: 10.1016/S0308-8146(99)00132-6. [DOI] [Google Scholar]
- Bath PK, Singh N. A research note chemical changes in Helianthus annuus and Eucalyptus lanceolatus honey during storage. J Food Qual. 2000;23:443–451. doi: 10.1111/j.1745-4557.2000.tb00570.x. [DOI] [Google Scholar]
- Bibi S, Husain SZ, Malik RM. Pollen analysis and heavy metals detection in honey samples from seven selected countries. Pak J Bot. 2008;40:507–516. [Google Scholar]
- Bogdanov S, Jurendic T, Sieber R. Honey for nutrition and health: a review. J Am Coll Nutr. 2008;27:677–689. doi: 10.1080/07315724.2008.10719745. [DOI] [PubMed] [Google Scholar]
- Vaughn M, Bryant Jr. Palynology Laboratory, Texas A and M University, College Station, Texas 77843–4352, USA. CAP Newsl. 2001;24:10–24. [Google Scholar]
- Castro-Vazquez L, Diaz-Maroto MC, Perez-Coello MS. Aroma composition and new chemical markers of Spanish citrus honeys. Food Chem. 2007;103:601–606. doi: 10.1016/j.foodchem.2006.08.031. [DOI] [Google Scholar]
- Codex Alimentarius Commission . Revised standard for honey. Codex Standard 12-1981. Rev 1 (1987), Rev 2 (2001) Rome: FAO; 2001. [Google Scholar]
- European Economic Community EEC Council Directive 2001/110/EC of 20 December 2001 relating to honey. Off J Eur Commun. 2002;110:47–52. [Google Scholar]
- Fallico B, Zappala M, Arena E, Verzera A. Effects of conditioning on HMF content in unifloral honeys. Food Chem. 2004;85:305–313. doi: 10.1016/j.foodchem.2003.07.010. [DOI] [Google Scholar]
- Ghoshdastidar N, Chakrabarti J. Studies on hydroxymethylfurfural formation during storage of honey. J Food Sci Technol. 1992;29:399–400. [Google Scholar]
- Hasan SH. Effect of storage and processing temperature on honey quality. J Babylon Univ Pure Appl Sci. 2013;21:2244–2253. [Google Scholar]
- International Honey Commission (2009) Harmonized methods of the International Honey Commission. http://www.ihcplatform.net/ihcmethods2009.pdf
- Karabournioti S, Zervalaki P. The effect of heating on honey HMF and invertase. Apiacta. 2001;36:177–181. [Google Scholar]
- Khuri AI, Cornell JA. Response surfaces design and analysis. New York: Marcel Dekker Inc; 1987. [Google Scholar]
- Nafea EA, Gumgumjee NM, Danial EN, Hajair AS. Physiochemical and antimicrobial properties of four Egyptian honeys with reference to American foul Brood disease. Life Sci J. 2014;11:41–46. [Google Scholar]
- Nanda V, Singh S, Raina CS, Jindal N, Singh K, Saxena DC. Optimization of the process variables for the preparation of processed paneer using response surface methodology. Eur Food Res Technol. 2004;218:529–534. doi: 10.1007/s00217-004-0903-8. [DOI] [Google Scholar]
- Nanda V, Bera MB, Bakhshi AK. Optimization of the process parameters to establish the quality attributes of hydroxymethylfurfural content and diastase activity of sunflower (Helianthus annus) honey using response surface methodology. Eur Food Res Technol. 2006;222:64–70. doi: 10.1007/s00217-005-0133-8. [DOI] [Google Scholar]
- Nayik GA, Dar BN, Nanda V. Optimization of the process parameters to establish the quality attributes of DPPH radical scavenging activity, total phenolic content, and total flavonoid content of apple (Malus domestica) honey using response surface methodology. Int J Food Prop. 2016;19:1738–1748. doi: 10.1080/10942912.2015.1107733. [DOI] [Google Scholar]
- Ramirez Cervantes MA, Gonzalez Novelo SA, Sauri Duch E. Effect of the temporary thermic treatment of honey on variation of the quality of the same during storage. Apiacata. 2000;35:162–170. [Google Scholar]
- Ruoff K, Bogdanov S. Authenticity of honey and other bee products. Apiacta. 2004;38:317–327. [Google Scholar]
- Sacan O, Yanardag R. Purification and some properties of rose (Fructus cynosbati) hips invertase. Indian J Biochem Biophy. 2012;49:109–114. [PubMed] [Google Scholar]
- Shapla UM, Solayman M, Alam N, Khalil MI, Gan SH. 5-Hydroxymethylfurfural (HMF) levels in honey and other food products: effects on bees and human health. Chem Cent J. 2018;12:35. doi: 10.1186/s13065-018-0408-3. [DOI] [PMC free article] [PubMed] [Google Scholar]
- Singh N, Bath PK. Quality evaluation of different types of Indian honey. Food Chem. 1997;58:129–133. doi: 10.1016/S0308-8146(96)00231-2. [DOI] [Google Scholar]
- Singh B, Panesar PS, Nanda V, Kennedy JF. Optimization of osmotic dehydration process of carrot cubes in mixtures of sucrose and sodium chloride solutions. Food Chem. 2010;123:590–600. doi: 10.1016/j.foodchem.2010.04.075. [DOI] [Google Scholar]
- Takenaka T, Echigo T. Changes in enzyme activity during the storage of honey. Bull Fac Agric Tamagawa Univ. 1974;14:19–25. [Google Scholar]
- Tornuk F, Karaman S, Ozturk I, Toker OS, Tastemur B, Sagdic O, Dogan M, Kayacier A. Quality characterization of artisanal and retail Turkish blossom honeys: determination of physicochemical, microbiological, bioactive properties and aroma profile. Ind Crop Prod. 2013;46:124–131. doi: 10.1016/j.indcrop.2012.12.042. [DOI] [Google Scholar]
- Tosi E, Ciappini M, Re E, Lucero H. Honey thermal treatment effects on hydroxymethylfurfural (HMF) content. Food Chem. 2002;77:71–74. doi: 10.1016/S0308-8146(01)00325-9. [DOI] [Google Scholar]
- Visquert M, Escriche I, Perez-Campos A, Fito P. Effects of heat treatment on quality parameters of various honeys. Alimentaria. 2004;352:65–72. [Google Scholar]
- Von der Ohe W, Persano Oddo L, Piana ML, Morlot M, Martin P. Harmonized methods of melissopalynology. Apidologie. 2004;35:S18–S25. doi: 10.1051/apido:2004050. [DOI] [Google Scholar]
- White JW, Kushnir I, Subers MH. Effect of storage and processing temperature on honey quality. Food Technol. 1964;18:153–156. [Google Scholar]
- Yilmaz H, Kufrevioglu I. Composition of honeys collected from Eastern and South-Eastern Anatolia and effect of storage on hydroxymethylfurfural content and diastase activity. Turk J Agric For. 2001;25:347–349. [Google Scholar]