Abstract
Background
Indirect vibration stimulation, i.e., whole body vibration or upper limb vibration, has been investigated increasingly as an exercise intervention for rehabilitation applications. However, there is a lack of evidence regarding the effects of graded isometric contractions superimposed on whole body vibration stimulation. Hence, the objective of this study was to quantify and analyse the effects of variations in the vibration parameters and contraction levels on the neuromuscular responses to isometric exercise superimposed on whole body vibration stimulation.
Methods
In this study, we assessed the ‘neuromuscular effects’ of graded isometric contractions, of 20%, 40%, 60%, 80% and 100% of maximum voluntary contraction, superimposed on whole body vibration stimulation (V) and control (C), i.e., no-vibration in 12 healthy volunteers. Vibration stimuli tested were 30 Hz and 50 Hz frequencies and 0.5 mm and 1.5 mm amplitude. Surface electromyographic activity of the vastus lateralis, vastus medialis and biceps femoris were measured during V and C conditions with electromyographic root mean square and electromyographic mean frequency values used to quantify muscle activity and their fatigue levels, respectively.
Results
Both the prime mover (vastus lateralis) and the antagonist (biceps femoris) displayed significantly higher (P < 0.05) electromyographic activity with the V than the C condition with varying percentage increases in EMG root-mean-square (EMGrms) values ranging from 20% to 200%. For both the vastus lateralis and biceps femoris, the increase in mean EMGrms values depended on the frequency, amplitude and muscle contraction level with 50 Hz–0.5 mm stimulation inducing the largest neuromuscular activity.
Conclusions
These results show that the isometric contraction superimposed on vibration stimulation leads to higher neuromuscular activity compared to isometric contraction alone in the lower limbs. The combination of the vibration frequency with the amplitude and the muscle tension together grades the final neuromuscular output.
Keywords: Vibration stimulation, electromyography, neuromuscular response, isometric contraction, co-contraction
Introduction
Vibration stimulation has been used as a diagnostic tool in neurological studies since the 70 s.1 Vibration has also been studied extensively for its negative effects, especially for the conditions arising from occupational hazards after prolonged exposure.2–4 However, in recent years, vibration has been increasingly investigated for its positive effects. Researchers have studied the use of vibration stimulation for increasing muscle strength, muscle power, body balance and bone remodelling.5–10 Consequently, given the potential benefits of vibration stimulation, it has been suggested for specific applications ranging from sports to therapeutics to rehabilitation.10,11
Two main types of vibration exercise modalities have been identified: whole body vibration (WBV) and upper limb vibration (ULV). WBV is delivered generally through the lower limbs with the user typically standing in a half squat position on a vibrating platform. ULV vibration devices deliver vibration stimulation to the hand and arm and can consist of vibrating dumbbells which the user grasps tightly to receive the stimulations. Both of these vibration modalities deliver stimulation indirectly, through the limbs, whereas most of our understanding about the body’s neurophysiological responses to vibration stimulation is based on earlier diagnostic studies which delivered the vibration directly to specific muscles and tendons.12,13
While the potential beneficial effects on muscle and bone form and functions are recognized now in various populations,14–16 a lack of consensus exists on the biological mechanisms responsible for such adaptations. One suggestion is that the enhanced neuromuscular activation found during WBV16,17 can be one of the main mechanisms inducing improvements in skeletal muscle function. For this reason, it has been suggested that WBV can induce adaptations similar to resistance training.16–19
Direct vibration stimulation has been shown to enhance muscle spindle activity resulting in excitatory response of the primary and secondary endings,1,12 the excitatory response being known as tonic vibration reflex (TVR).13,20 It has also been observed that the TVR response is influenced by the vibration location, the initial length of muscle, i.e., pre-stretch and the vibration frequency and amplitude.21,22
Another theory proposed to explain the increased neuromuscular response under indirect vibration is muscle tuning.23 Muscle tuning theory suggests that increased muscle contraction during vibration could lead to higher neuromuscular response.24 Recent work has suggested some degree of a temporary sustained enhancement of corticospinal excitability concomitant with spinal inhibition acutely after WBV,25 suggesting that central aspects should not be discounted.
Considering the effect of muscle length, contraction and vibration frequency as well as amplitude in grading the neuromuscular responses to vibration stimulation, one way to further improve the effectiveness of the vibration exercise could be represented by the superimposition of isometric exercises on vibration stimulation. Recently authors have investigated neuromuscular activation in the upper limbs under vibration stimulation with graded isometric contractions superimposed.26,27 In the lower limbs, limited studies exist, but it has been shown that additional load determines an increase in electromyographic (EMG) activity in the target muscles.28
To the best of the authors’ knowledge, this is the first study to investigate the effects of graded isometric contractions superimposed on WBV exercise. This is also the first attempt to understand collectively the effects of different frequencies and amplitudes of vibration stimulation when graded levels of contraction are superimposed on WBV. Another unique aspect of this study is the investigation of agonist–antagonist co-activation in the lower limbs under graded isometric exercise superimposed on WBV.
The purpose of this study was to quantify and analyse the effects of variations in the vibration parameters and contraction levels on the neuromuscular responses to isometric exercise superimposed on WBV stimulation.
To investigate the above-mentioned novel aspects, we hypothesized that compared to the control (C) condition (i.e., no vibration):
The vibration intervention, i.e., vibration (V) condition would significantly enhance neuromuscular activation EMG root-mean-sqaure (EMGrms) in the vastus lateralis (VL), vastus medialis (VM) and biceps femoris (BF) muscles.
This neuromuscular activation (EMGrms) would vary significantly between and would depend upon the vibration frequency, amplitude and isometric contraction level.
The V condition would also significantly increase the agonist–antagonist co-activation.
The V condition would significantly increase the peripheral fatigue indices (EMG – mean frequency (MEF) and Median Frequency (MDF)) in the VL, VM and BF muscles.
These peripheral fatigue indices (EMG – MEF and MDF) would vary significantly and depend upon the vibration frequency, amplitude and isometric contraction level.
Methods
Participants
A total of 12 healthy volunteer participants (six females and six males; age 28 ± 7.24 years; height 173 ± 13.04 cm; weight 73.16 ± 11.19 kg) were recruited through the University of Aberdeen, Biomedical Engineering Laboratory. The level of physical training of the participants varied from sedentary to amateur athlete. Written and informed consent was signed by each volunteer. Exclusion criteria included a history of back pain, acute inflammations in the pelvis and/or lower extremity, acute thrombosis, bone tumours, fresh fracture, fresh implants, gallstones, kidney or bladder stones, any disease of the spine, peripheral vascular disease, or pregnancy.
Experimental setup
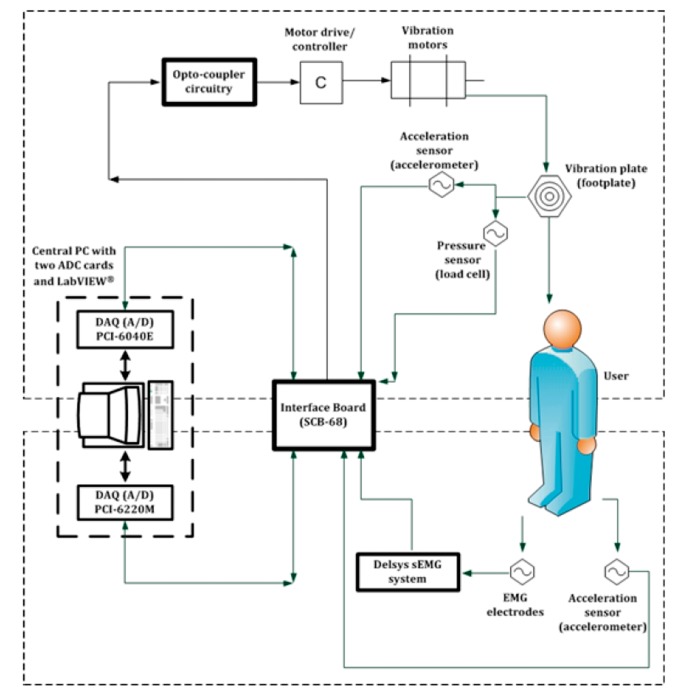
Trials were performed with the setup reported previously.29,30 A leg press machine was converted into a WBV device which allowed the user to apply varying levels of isometric contractions while receiving vibration stimulation in a seated position (refer to Figures 1 and 2 for a photograph of the device and a schematic of the experimental setup and instrumentation31). The leg press machine was fitted with two contra-rotating motors (Vibratechniques Ltd., UK; model: MVSI-S90) attached to a spring mounted vibration plate. The vibration plate was attached directly to the foot plate, against which user pushed to receive the vibrations. This led to the sinusoidal motion of the foot plate in the sagittal direction, towards and away from the user.
Figure 1.
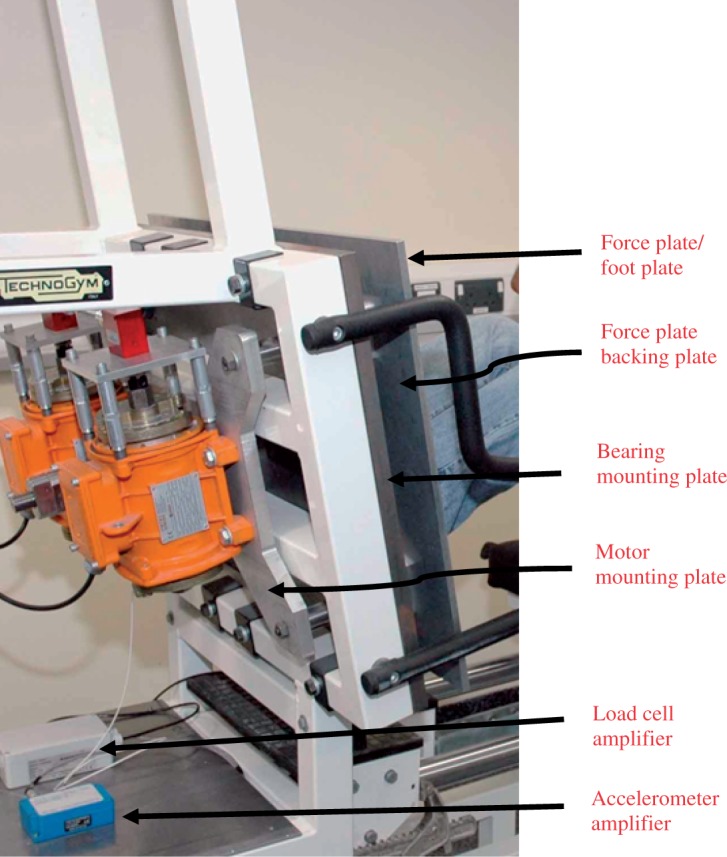
Photograph showing the arrangement of various plates delivering vibration of the motors to the user via footplate.
Figure 2.
Schematic diagram showing operation of the complete WBV system; the direction of the arrow represents the flow of the signal. The top part depicts interfacing of the controlling PC with the vibration device, through opto-coupler circuitry, motor drive and vibrating motors. This top part also depicts how sensors attached to the vibration device (i.e., load cell and accelerometer) were interfaced with the controlling PC. The bottom part of the figure depicts how sensors attached to the vibration device user (i.e., EMG and accelerometer sensor) were connected to the controlling PC. sEMG: surface electromyography.
An accelerometer (Kistler Instrument Corp.; model: KShear-8704B25) attached to the vibration plate sensed the real-time acceleration of the vibrating plate. A pancake type load cell (Procter & Chester Measurements Ltd., UK; model: BD-PLC-C) sandwiched between vibration plate and the foot plate measured the real-time force applied by the user, i.e., maximal voluntary contraction (MVC).
The user sat on the device seat with a backrest, with his/her legs half flexed (90° knee angles) and pushed against the vibrating foot plate. This posture arrangement differs from current WBV devices where the user stands on a vibrating platform. While exercising, the knee angle was kept at 90° and was continuously monitored with a goniometer. The position of the seat and backrest could be adjusted manually with respect to the foot plate, to accommodate users of different height. This also helped to keep the knee angle of 90°. Appropriate toe and heel positions were marked on the foot plate to ensure consistency inter and intra participants. To avoid vibration damping and any variability among participants, exercises were performed barefoot. The foot plate had a rubber platform to provide traction while exercising.
The WBV device was set up to generate sinusoidal vibrations of 30 Hz or 50 Hz frequencies with peak-to-peak amplitudes of 0.5 mm or 1.5 mm.
Vibration device – Performance evaluation
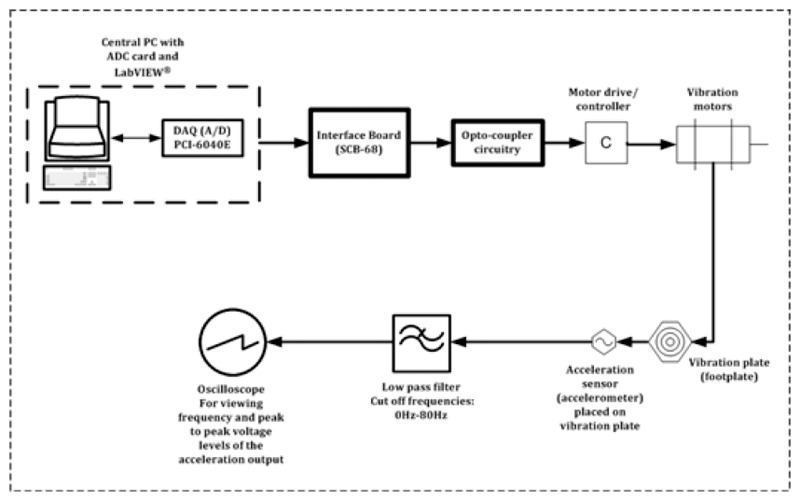
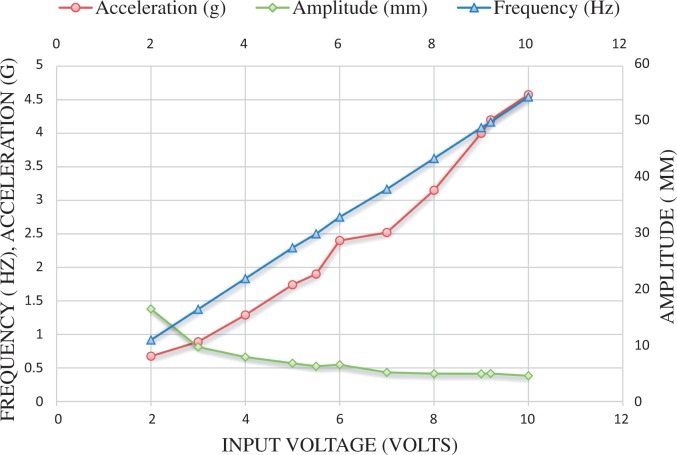
To verify whether the WBV device generates specific and repeatable vibrations (i.e., 30 Hz and 50 Hz frequencies with peak-to-peak amplitudes of 0.5 mm and 1.5 mm), a simple procedure was followed. An input voltage was delivered to the vibration device from the central PC and the corresponding vibration characteristics generated were recorded. This procedure was repeated multiple times to make sure those vibration characteristics values were consistent and hence reliably repeatable. The experimental setup to generate the vibrations is described in schematic in Figure 3. The vibration characteristics were recorded by the accelerometer situated on the vibration plate. These signals were recorded, observed and analysed on an oscilloscope. The signal to the oscilloscope from the accelerometer was low-pass filtered with a cut-off frequency 80 Hz. This low-pass filtering made sure that the frequency range of interest (30 Hz and 50 Hz) was recorded and analysed.
Figure 3.
Schematic showing experimental setup used for recording vibration characteristics to verify and evaluate the performance of the WBV system. Vibration motors were interfaced with the central controlling PC via an interface board, an opto-coupler circuitry and a motor drive. Oscillations of the vibration plate were measured through an acceleration sensor connected to the oscilloscope via a low-pass filter.
One set of representative data recording values are presented in Figure 4.
Figure 4.
Data showing one representative set of frequency, acceleration and amplitude levels obtained from the WBV (plate) actuator against corresponding input voltages.
Study design
A randomized crossover design was used to carry out the exercise interventions. As a crossover experiment, each participant was randomly allocated one of the several possible sequences of interventions. 25 integers were assigned to the 25 different interventions to be performed. A ‘random sequence’, i.e., a sequence consisting of 25 integers ≅25 interventions was assigned to each participant to provide the interventions in a random order. The MATLAB function ‘randperm’ was used to generate these random sequences.
The 25 interventions consisted of the exercise conditions shown in Table 1.
Table 1.
Characteristics of the 25 interventions and the integers assigned to them.
| Integer assigned | Characteristics of the corresponding intervention/treatment performed |
|---|---|
| 1 | Control – 20% of MVC (C) |
| 2 | Control – 40% of MVC (C) |
| 3 | Control – 60% of MVC (C) |
| 4 | Control – 80% of MVC (C) |
| 5 | Control – 100% of MVC (C) |
| 6 | 30 Hz+0.5 mm+20% of MVC (V) |
| 7 | 30 Hz+0.5 mm+40% of MVC (V) |
| 8 | 30 Hz+0.5 mm+60% of MVC (V) |
| 9 | 30 Hz+0.5 mm+80% of MVC (V) |
| 10 | 30 Hz+0.5 mm+100% of MVC (V) |
| 11 | 30 Hz+1.5 mm+20% of MVC (V) |
| 12 | 30 Hz+1.5 mm+40% of MVC (V) |
| 13 | 30 Hz+1.5 mm+60% of MVC (V) |
| 14 | 30 Hz+1.5 mm+80% of MVC (V) |
| 15 | 30 Hz+1.5 mm+100% of MVC (V) |
| 16 | 50 Hz+0.5 mm+20% of MVC (V) |
| 17 | 50 Hz+0.5 mm+40% of MVC (V) |
| 18 | 50 Hz+0.5 mm+60% of MVC (V) |
| 19 | 50 Hz+0.5 mm+80% of MVC (V) |
| 20 | 50 Hz+0.5 mm+100% of MVC (V) |
| 21 | 50 Hz+1.5 mm+20% of MVC (V) |
| 22 | 50 Hz+1.5 mm+40% of MVC (V) |
| 23 | 50 Hz+1.5 mm+60% of MVC (V) |
| 24 | 50 Hz+1.5 mm+80% of MVC (V) |
| 25 | 50 Hz+1.5 mm+100% of MVC (V) |
Control (C) refers to ‘no vibration’.
MVC: maximum voluntary contraction; C: control conditions; V: vibration conditions.
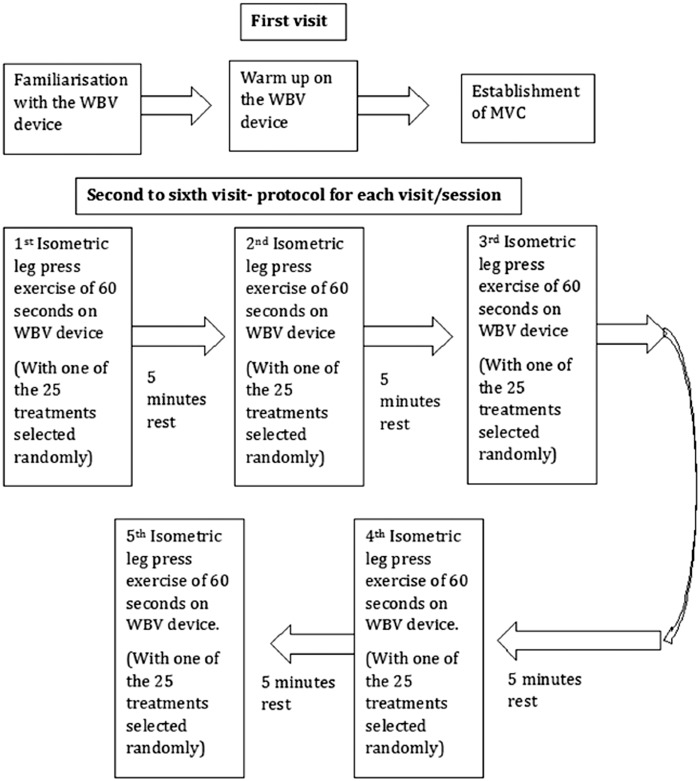
The protocol is outlined in Figure 5. In the first visit, each participant was familiarized with the WBV device. Then the participant performed an isometric leg press exercise of various intensities against the WBV device foot plate with the knees flexed at 90° as a warm up. After this initial warm-up and familiarization, the MVC was established for each participant. For this, the participant performed maximal efforts for 40 s. This procedure was undertaken three times with each effort separated by a 5-min period of rest. The average of the three efforts was used as the baseline MVC value for that participant.
Figure 5.
Schematic describing the arrangements/research protocol of the experiment. WBV: whole body vibration; MVC: maximal voluntary contraction.
In the second to sixth visits, the participants went through the vibration exercise intervention outlined in Table 1 with the randomized crossover design. The vibration interventions consisted of an isometric leg press exercise pushing against the WBV device foot plate with the knees flexed at 90° at the target force, for 60 s. Five minutes of rest was allowed between any two consecutive interventions/measurements. Five interventions were carried out per session with the total of 25 measurements taken in the five sessions.
During each measurement, the neuromuscular activation of the designated muscles was recorded in the form of surface electromyographic (sEMG) response and stored for analysis along with the vibration characteristics and the force production details. The vibration being delivered was continuously monitored and recorded. Vibrations transmitted to the participant were recorded and stored by a tri-axial accelerometer (Analog Devices Inc.; model: ADXL-330) attached to the lower limb of the participant. Real-time graphical and numerical representations of the vibration characteristics as well as the force levels produced by the participant were available on the main computer.
All the procedures were non-invasive. Participant wore shorts to facilitate sensor placement on the lower limbs.
Instructions to the participants
Participants were asked to maintain consistency in their foot positions and knee angles. Both of these variables were measured continuously throughout the tests. Participants received both verbal and visual (real-time graphical values on the PC) feedback to assist them in maintaining a constant force level.
Isometric contraction with the required postural conditions was practiced with and without vibrations before the actual trials until the participants became familiar with the test conditions. Trials were repeated if postural conditions changed from the required position.
Fatigue and safety
A minimum of 72 h of recovery time was allowed between any two testing sessions to avoid any residue of fatigue and/or delayed onset of muscle soreness. Also, a general log of each participant’s daily physical activity excluding the trials was kept, e.g., any form of regular/irregular physical exercise like running, strength or resistance training. This was done to ensure that the participant did not undergo the WBV stimulation trials immediately after finishing their regular exercise. At least 72 h of time gap was allowed between the regular physical exercise and WBV trials, to avoid any effect of muscle fatigue.
Participants were encouraged to report any pain and/or discomfort, during or after the trials, to the test operator. Apart from the feeling of exertion during the exercises performed at an individual’s peak capacity, no adverse effects were reported by the participants during or after the trials.
An emergency stop button to halt the vibration delivery was located near the WBV device seat. Participants were advised to make use of the button in case they felt unsafe or were in pain. None of the participants used the emergency stop button during the trials.
EMG measurements and processing
sEMG was recorded from the VL, VM and BF during all exercise conditions according to recommendations reported in the literature.32 Active bipolar electrodes (DelSys, Inc.; model: DE 2.1) were aligned with the muscle fibre direction and placed between the tendon and the muscle belly. To minimize the impedance and to ensure a proper contact, the skin was shaved as necessary, lightly abraded and cleaned with 70% isopropyl alcohol. The reference electrode was placed on an electrically inactive area of the lumbar spine (the anterior superior iliac spine). To ensure consistency in the placement of the sEMG electrodes between the sessions, electrode locations were marked with a skin marker and kept throughout the entire duration of tests, i.e., from the first MVC measurement visit to the last visit. The sEMG electrodes and cables were secured to subject’s skin with medical tape. Active grounding and shielding of the cables was carried out to minimize electromagnetic inference.33 The sEMG signals were sampled at 1000 Hz, amplified with a gain of 1000 and analogue filtered for a 20–450 Hz band pass with DelSys hardware (DelSys, Inc.; model: Bagnoli-4). Data acquisition was performed through a 16-bit data acquisition card (National Instruments Corp.; model: PCI-6220 M) and EMGWorks (DelSys, Inc.) software.
Subsequent data processing and analysis was performed with custom written MATLAB code (The Mathworks, Inc.; version 8) routine. Any baseline offset of the sEMG data was removed by subtracting the mean.
The root mean square (RMS, i.e., EMGrms) was used to estimate the neuromuscular activation. The RMS was calculated using the moving window technique. Initially, the RMS was calculated for each window, and then, the RMS for the entire data length was obtained by averaging the individual RMS values of each window. Exactly same RMS windowing characteristics were employed to obtain the MVC EMGrms values as well as EMGrms for the C and V conditions.
The MEF and power spectral density (PSD) of the sEMG data were also obtained. The MEF was used as an indicator of muscle fatigue. These spectral estimators were also derived by moving window technique.
For both amplitude and spectral estimation, the hamming window with a length of 1 s and no overlap was used. It has been shown that the choice of the window does not have a critical bearing on the spectral estimators like MEF and PSD.34 Further, for isometric, constant force and fatiguing contractions, the signal is regarded as stationary for epoch/window duration of 1 to 2 s. Previous studies suggest that epoch durations between 500 ms to 1 s provide better spectral estimation.34–36 Also, it has been shown that window overlapping does not provide any significant benefits.34 Based on these recommendations, the window length was kept to 1 s without any overlap.
Line artefact removal
The power spectral analysis of the sEMG revealed peaks coinciding with 50 Hz and to a lesser degree with 30 Hz. Peaks at the integer harmonics of 50 Hz and 30 Hz were also observed however their power was almost negligible (Figure 6).
Figure 6.
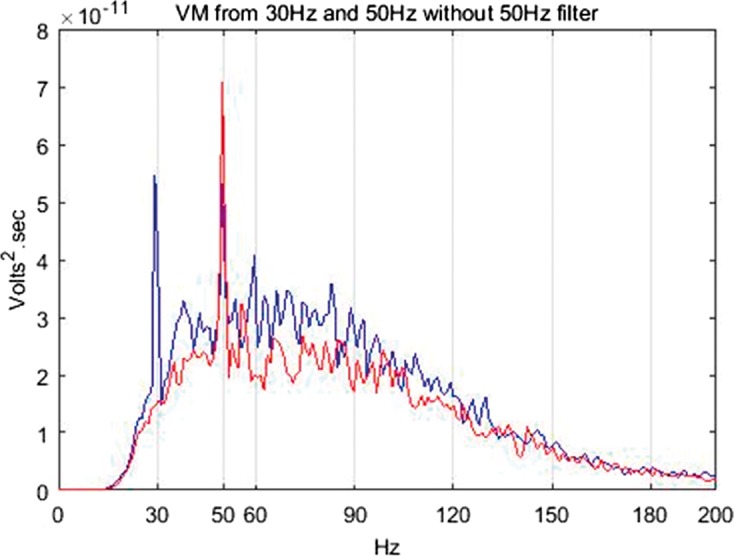
EMG frequency spectra from the VM under 30 Hz, 1.5 mm, 60% MVC (blue) and 50 Hz, 1.5 mm, 60% MVC (red) stimulation frequencies without 50 Hz notch filter application. VM: vastus medialis.
Some authors have filtered the peaks in sEMG spectra coinciding with the vibration stimulation frequencies assuming them to be motion artefacts.37 However, it is still unclear whether the spectral peaks correlating with the stimulation frequencies are in fact motion artefacts36 or stretch reflexes.18 Recent evidence suggests that these peaks can indeed be stretch reflexes.38 Considering the present ambiguity about the existence of motion artefacts and increasing evidence towards the presence of stretch reflex,18,38 only the spectra exhibiting the largest power and hence potential to skew the results were removed. The largest spectra were found to be at 50 Hz irrespective of the stimulation frequency of 30 Hz or 50 Hz. Hence, a Butterworth notch filter (10th order, cut-off frequencies 49.5–50.5 Hz) was employed to remove the components at this frequency. Figure 7 shows the effect of the filtering.
Figure 7.
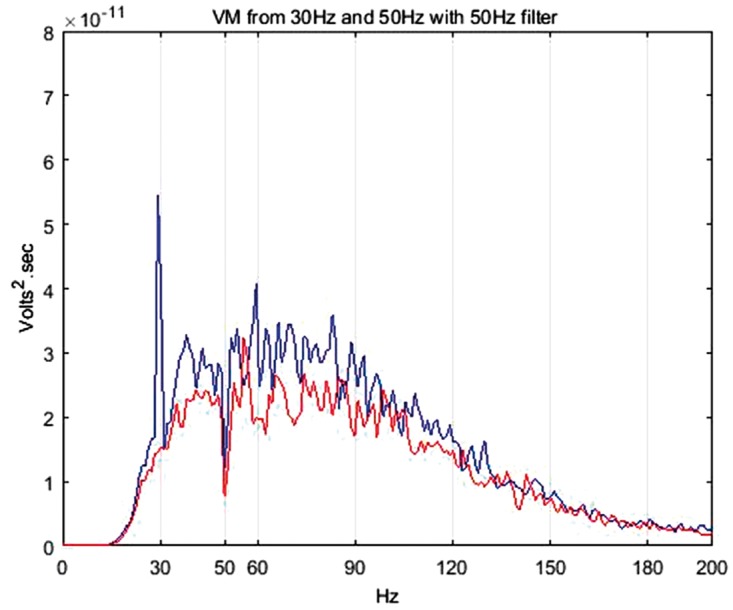
EMG frequency spectra from the VM under 30 Hz, 1.5 mm, 60% MVC (blue) and 50 Hz, 1.5 mm, 60% MVC (red) stimulation frequencies with 50 Hz notch filter application. VM: vastus medialis.
Statistical analysis
Normalization was performed by dividing the EMGrms of the entire section of the data value to be normalized by the maximum value obtained from the MVC effort of each participant. To identify whether the EMGrms values differ significantly between the effort levels and between the control and vibration conditions, a two-way ANOVA test was employed. The two interventions (control and vibration) and five intensities of contractions (effort levels) were used to compare between the EMGrms of different effort levels as well as between the control and each vibration condition one at a time. Alpha was set at 0.05. In each case, a significant difference was defined for a computed P-value ≤ 0.05. Paired student t-tests (one tail, different variance) were employed at each effort level to compare the sEMG responses between the C and V conditions and to establish the significance level (P value) of the deviations from the means. The distribution of grouped data was assessed for normality using the Lilliefors test with a significance detection level of ≤ 0.05. Statistical analysis was carried out using the SigmaPlot statistical software package (Systat Software Inc.; Version SigmaPlot 12).
Results
Overall effects of vibration on EMG amplitude
For the VL and BF muscles, at all contraction levels, isometric contraction superimposed on vibration stimulation produced higher mean EMGrms activity than isometric contraction (control) alone. However, the VM did not show any increases in neuromuscular activity under vibration conditions, instead its mean EMGrms values were similar to the control condition and in some cases lower.
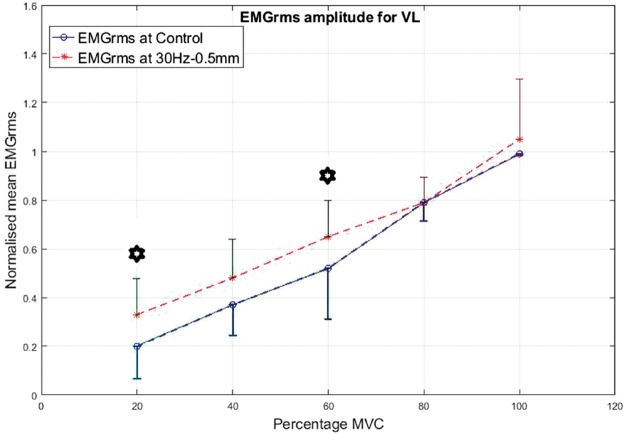
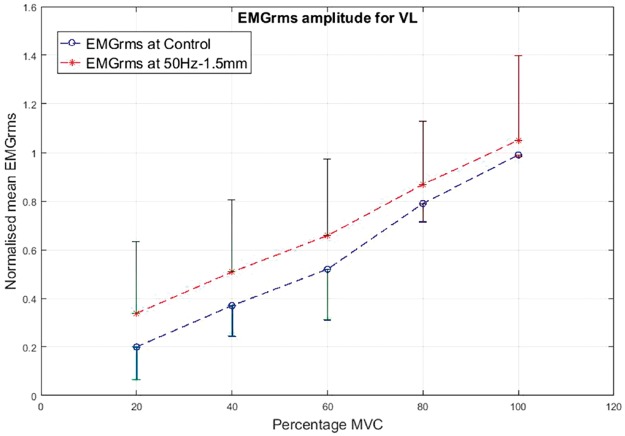
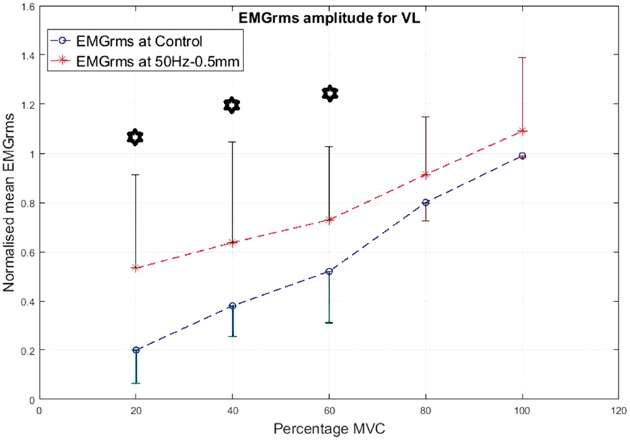
As a prime mover/agonist in the leg press exercise, the VL displayed higher EMG activity than the control condition. The percentage increase in mean EMGrms values with vibration was highly variable depending on the frequency, amplitude and contraction level and ranged from 5% to 165%. The EMGrms data for the various cases are shown in Figures 8 to 11.
Figure 8.
Normalized mean EMGrms values for VL at 20%, 40%, 60%, 80% and 100% MVC under 30 Hz–0.5 mm V against C (no vibration) condition. MVC: maximal voluntary contraction; VL: vastus lateralis; EMGrms: EMG root-mean-square.
Figure 11.
Normalized mean EMGrms values for VL at 20%, 40%, 60%, 80% and 100% MVC under 50 Hz–1.5 mm V against C. MVC: maximal voluntary contraction; VL: vastus lateralis; EMGrms: EMG root-mean-square.
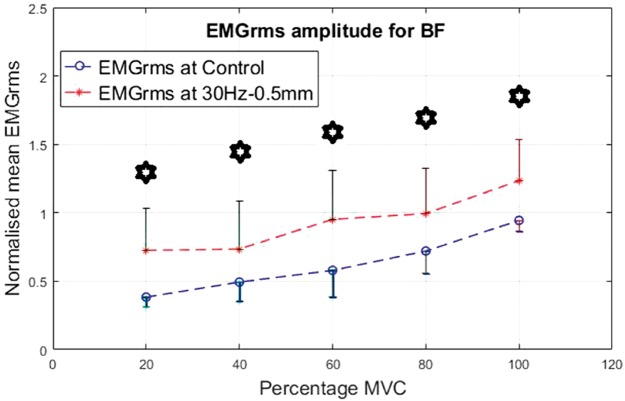
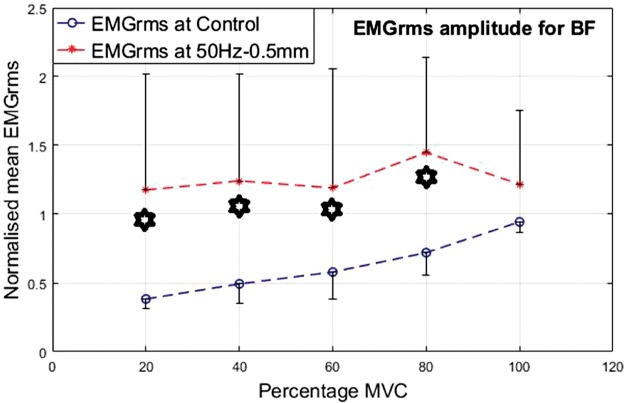
As an antagonist, the BF seemed highly active and showed higher levels of EMG activity under vibration compared to the control condition. Similar to the VL, the percentage increase in mean EMGrms values of BF was highly variable and depended on the frequency, amplitude and muscle contraction level. Compared to the control, the BF’s mean EMGrms increase ranged from 28% to 206%. The EMGrms data for the various cases are shown in Figures 12 to 15.
Figure 10.
Normalized mean EMGrms values for VL at 20%, 40%, 60%, 80% and 100% MVC under 50 Hz–0.5 mm V against C. MVC: maximal voluntary contraction; VL: vastus lateralis; EMGrms: EMG root-mean-square.
Figure 12.
Normalized mean EMGrms values for BF at 20%, 40%, 60, 80% and 100% MVC under 30 Hz–0.5 mm V against C. MVC: maximal voluntary contraction; BF: biceps femoris; EMGrms: EMG root-mean-square.
Figure 15.
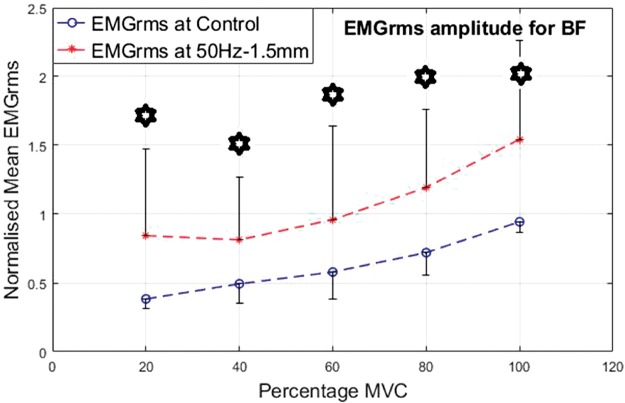
Normalized mean EMGrms values for BF at 20%, 40, 60%, 80% and 100% MVC under 50 Hz–1.5 mm V against C. MVC: maximal voluntary contraction; BF: biceps femoris; EMGrms: EMG root-mean-square.
The effects of frequencies 30 Hz and 50 Hz and amplitudes 0.5 mm and 1.5 mm
Among the four combinations of the vibration variables investigated, 50 Hz–0.5 mm stimulation induced the largest neuromuscular activity in the VL and BF muscles with the highest increases of 165% and 206% in mean EMGrms values, respectively (Table 2 and Figures 8 to 15).
Table 2.
Percentage increase or variation in mean EMGrms values in comparison with respective controls.
| Vibration treatment condition (frequency = 30/50 Hz, amplitude = 0.5/1.5 mm, force level = 20%/40%/60%/80%/100% of MVC) | Vibration treatment effect in a muscle group
(% increase over respective control condition) |
||
|---|---|---|---|
| VL | VM | BF | |
| 30Hz–0.5 mm_20 | 66.85* | 25.72 | 89.22* |
| 30Hz–0.5 mm_40 | 28.81 | −5.17 | 48.98* |
| 30Hz–0.5 mm_60 | 26.43* | 10.67 | 64.33* |
| 30Hz–0.5 mm_80 | −0.14 | −10.69 | 37.99* |
| 30Hz–0.5 mm_100 | 5.96 | 0.50 | 30.81* |
| 30Hz–1.5 mm_20 | 98.43* | 23.56 | 85.45* |
| 30Hz–1.5 mm_40 | 10.11 | −13.70 | 24.87* |
| 30Hz–1.5 mm_60 | 31.92* | 23.09 | 84.15* |
| 30Hz–1.5 mm_80 | 2.01 | −4.377 | 64.55* |
| 30Hz–1.5 mm_100 | 14.75 | 11.010 | 65.12* |
| 50Hz–0.5 mm_20 | 165.44* | 15.24 | 206.50* |
| 50Hz–0.5 mm_40 | 68.97* | −9.44 | 151.68* |
| 50Hz–0.5 mm_60 | 40.07* | 6.62 | 105.56* |
| 50Hz–0.5 mm_80 | 14.82 | −8.65 | 101.05* |
| 50Hz–0.5 mm_100 | 9.86 | −1.56 | 28.86 |
| 50Hz–1.5 mm_20 | 68.51 | 34.35 | 120.04* |
| 50Hz–1.5 mm_40 | 34.83 | −9.02 | 64.74* |
| 50Hz–1.5 mm_60 | 26.36 | 9.68 | 65.70* |
| 50Hz–1.5 mm_80 | 9.18 | −2.73 | 65.64* |
| 50Hz–1.5 mm_100 | 5.83 | −1.13 | 63.54* |
Values in asterisk represent statistically significant increase compared to C with P value ≤ 0.05. MVC: maximal voluntary contraction; VL: vastus lateralis; VM: vastus medialis; BF: biceps femoris.
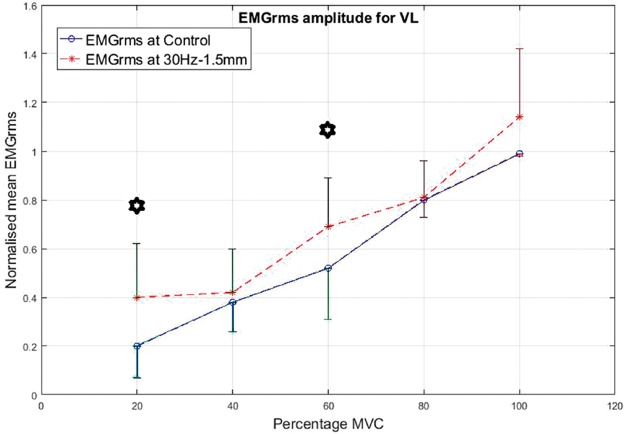
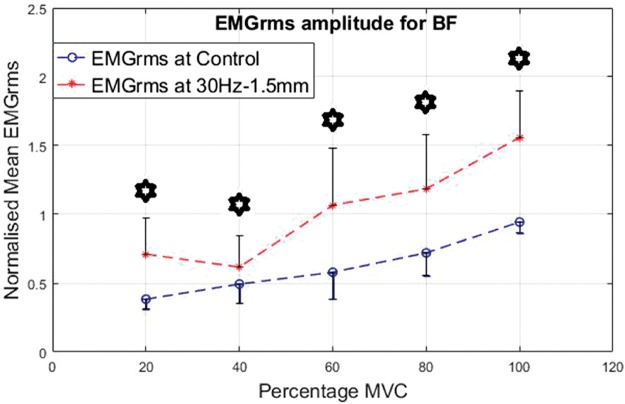
Interestingly, the VL did not display significantly higher EMG amplitude values under the higher level stimulation of 50 Hz–1.5 mm (Figure 11), whereas it recorded significantly higher (P < 0.05) EMG activity under 30 Hz–1.5 mm at both 20% and 60% of MVC effort (Figure 9). However, for the same vibration input, i.e., 30 Hz–1.5 mm, the BF did not respond well compared to 50 Hz–1.5 mm, for which the BF generated significantly higher (P < 0.05) EMG activity at all effort levels with 63% to 120% increases in mean EMGrms values (Figures 13 and 15). Thus, apart from the 50 Hz–0.5 mm stimulation there was no clear combination of vibration variables which was able to generate consistently significant levels of neuromuscular response in both agonist and antagonist muscles simultaneously.
Figure 14.
Normalized mean EMGrms values for BF at 20%, 40%, 60%, 80% and 100% MVC under 50 Hz–0.5 mm V against C. MVC: maximal voluntary contraction; BF: biceps femoris; EMGrms: EMG root-mean-square.
Figure 9.
Normalized mean EMGrms values for VL at 20%, 40%, 60%, 80% and 100% MVC under 30 Hz–1.5 mm V against C. MVC: maximal voluntary contraction; VL: vastus lateralis; EMGrms: EMG root-mean-square.
Figure 13.
Normalized mean EMGrms values for BF at 20%, 40%, 60%, 80% and 100% MVC under 30 Hz–1.5 mm V against C. MVC: maximal voluntary contraction; BF: biceps femoris; EMGrms: EMG root-mean-square.
Broadly speaking, based on the percentage increases in mean EMGrms activities of the VL and BF muscles, the 50 Hz–0.5 mm stimulation induced the largest neuromuscular response followed by 50 Hz–1.5 mm and 30 Hz–1.5 mm (refer Table 2). However, the EMG amplitudes under 50 Hz–1.5 mm and 30 Hz–1.5 mm stimulations were not significantly different to each other.
EMGrms amplitude differences between the effort levels and between the control and vibration
Table 3 shows the comparison between the EMGrms of different effort levels (i.e., between 20%, 40%, 60%, 80% and 100% of MVC) and between vibration and control condition. The values are presented for all the three muscle groups studied, i.e., VL, VM and BF.
Table 3.
Two-way ANOVA results comparing EMGrms means between effort levels and between control and vibration.
| Intervention and muscle group | Effect of treatment – effort levels (significant difference between effort levels, P value) | Effect of treatment – V or C condition (significant difference between V and C condition, P value) |
|---|---|---|
| 30 Hz–0.5 mm – VL | Yes, P ≤ 0.001 | Yes, P = 0.029 |
| 30 Hz–1.5 mm – VL | Yes, P ≤ 0.001 | Yes, P = 0.035 |
| 50 Hz–0.5 mm – VL | Yes, P = 0.003 | Yes, P = 0.010 |
| 50 Hz–1.5 mm – VL | Yes, P ≤ 0.001 | Yes, P = 0.003 |
| 30 Hz–0.5 mm – VM | Yes, P ≤ 0.001 | No, P = 0.966 |
| 30 Hz–1.5 mm – VM | Yes, P ≤ 0.001 | No, P = 0.376 |
| 50 Hz–0.5 mm – VM | Yes, P ≤ 0.001 | No, P = 0.542 |
| 50 Hz–1.5 mm – VM | Yes, P ≤ 0.001 | No, P = 0.712 |
| 30 Hz–0.5 mm – BF | Yes, P ≤ 0.001 | Yes, P ≤ 0.001 |
| 30 Hz–1.5 mm – BF | Yes, P = 0.024 | Yes, P = 0.009 |
| 50 Hz–0.5 mm – BF | Yes, P = 0.314 | Yes, P = 0.003 |
| 50 Hz–1.5 mm – BF | Yes, P = 0.005 | Yes, P ≤ 0.001 |
MVC: maximal voluntary contraction; VL: vastus lateralis; VM: vastus medialis; BF: biceps femoris.
The effects of contraction levels 20% to 100% MVC
Overall, statistically significant (P < 0.05) differences were observed between the effort levels’ mean EMGrms values. That is, as the force level increased, the EMGrms values also increased significantly (Table 3). ANOVA showed significant differences between the mean EMGrms values of the effort levels in all the muscle groups. Significant differences also existed between the mean EMGrms values of all the control and vibration conditions of VL and BF muscles (Table 3).
For the VL, based on the percentage increases in mean EMGrms values, force levels of 20% to 60% of MVC seemed to induce higher neuromuscular responses than 80% and 100% of MVC efforts (Table 2). At 80% to 100% of MVC, the mean EMGrms values were similar to the control condition.
For increasing contraction levels, the VM did not display any significantly higher EMG activity for vibration compared to the control.
Agonist–antagonist co-activation
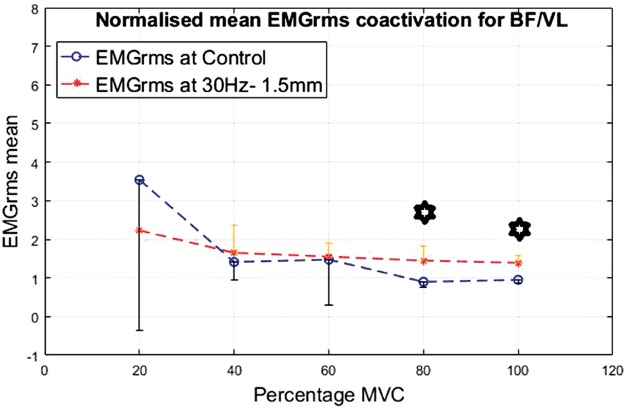
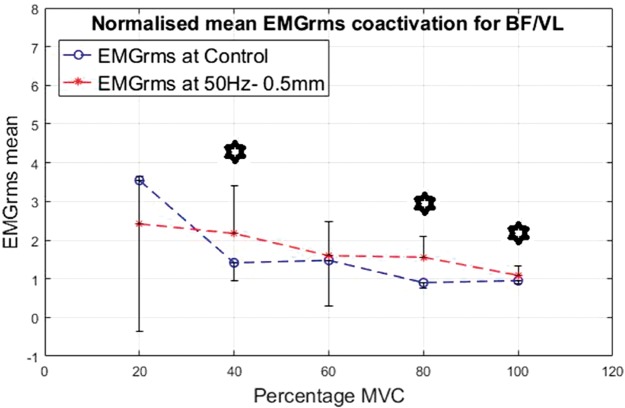
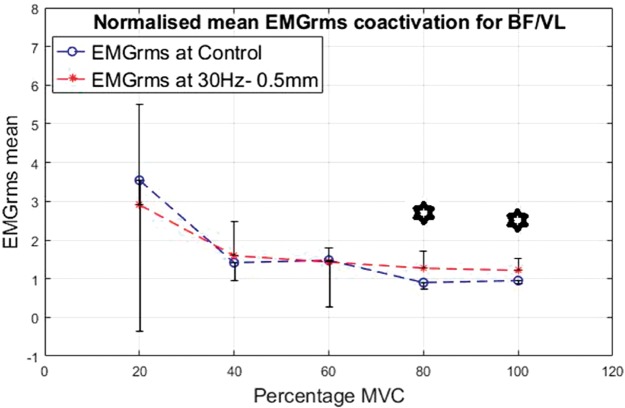
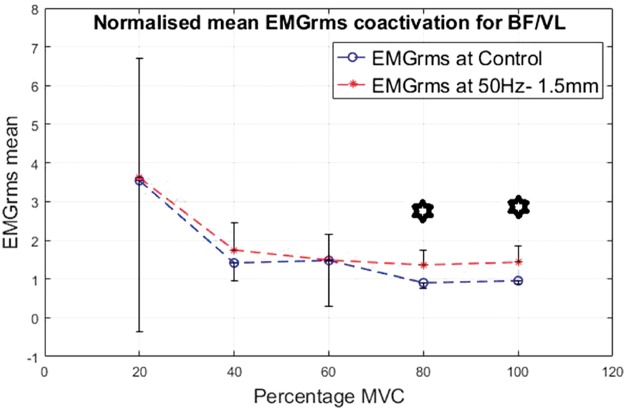
Co-activation was calculated for the ratio of the EMG of the BF divided by the VL. The results are shown in Figures 16 to 19 for the different interventions. The EMGrms ratio of BF/VL showed higher co-activation values with the vibration condition than the control condition except at 20% of the MVC.
Figure 17.
Normalized mean EMGrms co-activation values for BF over VL at 20%, 40%, 60%, 80% and 100% MVC under 30 Hz–1.5 mm V against C. MVC: maximal voluntary contraction; BF: biceps femoris; EMGrms: EMG root-mean-square.
Figure 18.
Normalized mean EMGrms co-activation values for BF over VL at 20%, 40%, 60%, 80% and 100% MVC under 50 Hz–0.5 mm V against C. MVC: maximal voluntary contraction; BF: biceps femoris; EMGrms: EMG root-mean-square.
Figure 16.
Normalized mean EMGrms co-activation values for BF over VL at 20%, 40%, 60%, 80% and 100% MVC under 30 Hz–0.5 mm V against C. MVC: maximal voluntary contraction; BF: biceps femoris; EMGrms: EMG root-mean-square.
Figure 19.
Normalized mean EMGrms co-activation values for BF over VL at 20%, 40%, 60%, 80% and 100% MVC under 50 Hz–1.5 mm V against C. MVC: maximal voluntary contraction; BF: biceps femoris; EMGrms: EMG root-mean-square.
As the contraction level increased, overall co-activation EMG amplitude decreased both under vibration and control conditions, with the highest co-activation amplitude being produced at 20% of MVC and the lowest at 100% of MVC. Despite an overall decrease in the co-activation amplitude with the increasing contraction, effort levels of 80% and 100% of MVC led to the most significantly (P < 0.05) higher co-activation ratios compared to the control, irrespective of the vibration condition (Figures 16 to 19).
50 Hz–0.5 mm vibration condition led to the strongest co-activation response with co-activation ratios significantly (P < 0.05) higher at 40%, 80% and 100% of MVC than the control. This suggests that the higher the vibration stimulus is (i.e., 50 Hz–0.5 mm), the higher the co-activation required to stabilize the joint rotation during vibration. This implies 50 Hz–0.5 mm to be the most efficacious stimulus among the variables tested for this study.
For all the effort levels and vibration conditions, BF/VM co-activation was higher under the vibration condition than the control condition.
Overall effects of vibration on EMG MEF behaviour
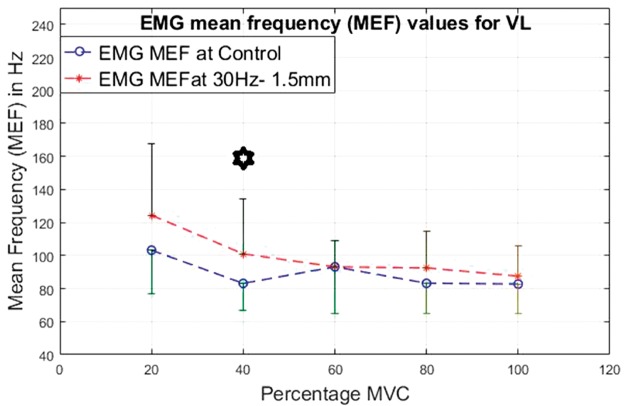
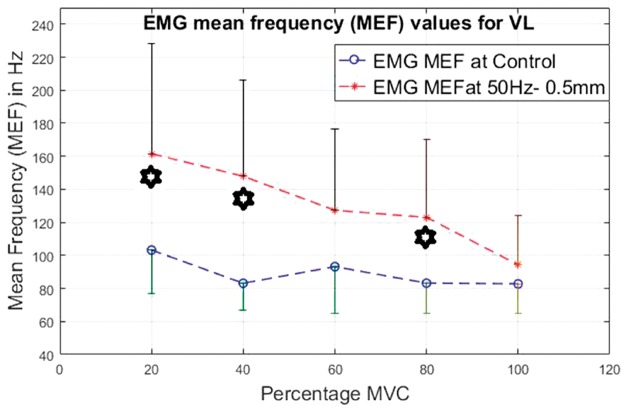
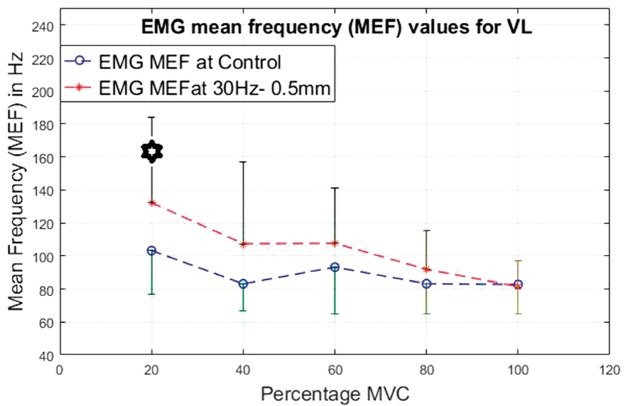
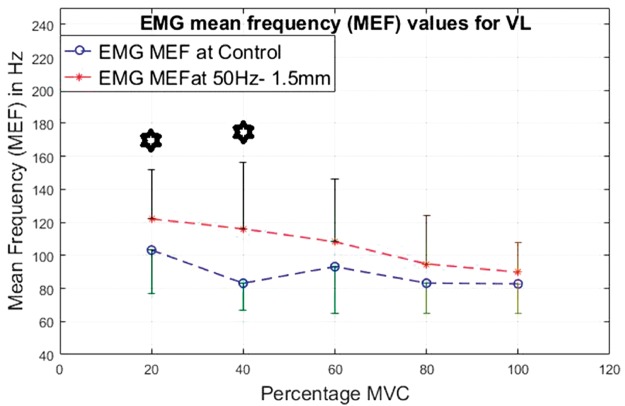
The VL and BF show higher MEF values under all vibration conditions compared to the control. The results are shown in Figures 20 to 23 for the different interventions. The VM MEF values under vibration conditions did not differ much compared to the control condition’s mean frequencies.
Figure 21.
EMG mean frequency values for VL at 20%, 40%, 60%, 80% and 100% MVC under 30 Hz–1.5 mm V against C. VL: vastus lateralis, MEF: mean frequency; MVC: maximal voluntary contraction EMG: electromyographic.
Figure 22.
EMG mean frequency values for VL at 20%, 40%, 60%, 80% and 100% MVC under 50 Hz–0.5 mm V against C. VL: vastus lateralis, MEF: mean frequency; MVC: maximal voluntary contraction; EMG: electromyographic.
Figure 20.
EMG mean frequency values for VL at 20%, 40%, 60%, 80% and 100% MVC under 30 Hz–0.5 mm V against C. VL: vastus lateralis; MEF: mean frequency; MVC: maximal voluntary contraction; EMG: electromyographic.
Figure 23.
EMG mean frequency values for VL at 20%, 40%, 60%, 80% and 100% MVC under 30 Hz–1.5 mm V against C. VL: vastus lateralis, MEF: mean frequency; MVC: maximal voluntary contraction; EMG: electromyographic.
For the VL (Figures 20 to 23), the lower contraction levels of 20% and 40% of MVC produce consistently the most significantly higher (P < 0.05) MEF values with vibration compared to control conditions.
For the BF, all contraction levels, i.e., 20% to 100% of MVC produce significantly higher (P < 0.05) MEF values under specific vibration conditions compared to the control conditions. The BF display significantly higher (P < 0.05) EMG MEF values under 50 Hz–0.5 mm and 50 Hz–1.5 mm, under all contraction levels with the exception of 40% of MVC.
Although the VM MEF values were closer to the control MEF, the VM did display higher MEF under certain vibration conditions (30 Hz–1.5 mm and 50 Hz–0.5 mm) compared to the control. However, under certain conditions, its values were lower than the values of the control (30 Hz–0.5 mm and 50 Hz–1.5 mm).
For both the VL and BF, the difference between the vibration and control condition MEF is larger at lower contraction levels and this difference reduces with increase in the contraction level.
Discussion
Effects of vibration frequency, vibration amplitude and contraction levels
These results (i.e., EMGrms, co-activation and EMG MEF) confirm that in comparison with isometric contraction alone, isometric contraction with superimposed vibration stimulation induces higher neuromuscular activity in the lower limb muscles. Further, the results also imply strongly and confirm that frequency or amplitude alone does not decide the level of induced neuromuscular activity, and instead the combination of frequency and amplitude along with the level of muscle contraction/tension should be used to identify the ‘optimal’ response to vibratory stimulation.
Both the 30 and 50 Hz frequencies were found to elicit significantly higher neuromuscular activity compared to the control in the VL and BF muscles. However, among the vibration variables tested, based on the percentage increases in mean EMGrms activities of the VL and BF muscles, increases in the co-activation (BF/VL and BF/VM) ratios and increases in the MEF values, the 50 Hz–0.5 mm frequency-amplitude combination was found to be the most effective in generating the highest neuromuscular activity in leg extensors muscles, which is similar to previous work on vibrating platforms.39 This is of particular importance considering that, although previous studies have suggested both 30 Hz and 50 Hz as suitable stimuli, 50 Hz frequency has been shown to be more effective stimulus in lower limbs compared to 30 Hz.40 Also, with regards to the muscle tuning theory discussed earlier, in lower limbs, the highest levels of muscle activity have been observed to coincide with the highest vibration damping which occurred at the resonant frequencies (10–50 Hz) of the lower limb tissues.41
Further, it has also been suggested that the higher frequencies and amplitudes of vibration would be more effective in inducing higher neuromuscular stimulation.42 However, the results of this study do not indicate that simply delivering a combination of higher frequency and amplitude necessarily induces higher neuromuscular response. The combination of the highest frequency and amplitude stimulation tested during this study (i.e., 50 Hz–1.5 mm) did not lead to the highest neuromuscular activity compared to other combinations.
A limited number of studies on indirect (WBV, ULV) vibration have compared different combinations of frequency-amplitude stimulation simultaneously for their effectiveness in generating higher neuromuscular activity or muscle strength.42,43 To the best of the authors’ knowledge, no study has investigated the effect of graded isometric contractions superimposed on vibration in the lower limbs. However, in direct vibration studies, strong evidence specifying the factors that influence neuromuscular response does exist. Increase in muscle length has been linked to increase in TVR.20 Also, vibration frequency, amplitude and muscle pre-stretch have been specified to influence the TVR.21 Higher amplitude vibration has led to higher TVR response in animals44,45; potentially due to increased number of muscle-spindle endings being activated leading to increased number of motor neurons being employed.46 Importantly, previous work has suggested that the higher amplitudes may only be effective in sub-maximal contractions.47 However, from the results of this study, no clear trends indicating higher amplitudes (i.e., 1.5 mm compared to 0.5 mm) leading to higher neuromuscular responses only under sub-maximal contractions (i.e., 20% to 40% of MVC compared to 80% to 100% of MVC) were found. Sub-maximal contractions did, however, lead to the higher neuromuscular responses with both the lower (0.5 mm) and higher (1.5 mm) amplitudes in the (VL) muscle. The antagonist muscle (BF) displayed a different response to the VL with a higher neuromuscular activity for MVCs irrespective of the amplitude levels. Without further evidence, it is difficult to infer whether the almost contrasting response of agonist and antagonist is a part of a wider neuromuscular strategy to counteract the vibration perturbation depending on the force level superimposed.
It is also worth noting that the magnitude of acceleration produced by the 50 Hz–0.5 mm stimulation is equivalent to 30 Hz-1.5 mm stimulation. Despite having the same acceleration magnitude, the results indicated significant differences between the neuromuscular responses to these vibration stimulations. Further, neuromuscular responses to the same vibration frequency (e.g., 30 Hz) differed significantly with the change in the amplitude from 0.5 mm to 1.5 mm. Overall, the observed differences in neuromuscular responses in this study can be attributed to the combinations of vibration frequencies (30 Hz vs. 50 Hz), amplitudes (0.5 mm vs. 1.5 mm) and contraction levels (20% to 100% of MVC). This further affirms the role of the vibration frequency-amplitude combination in grading the neuromuscular response as opposed to the level of acceleration or frequency alone. Nevertheless, from previous evidence and the results of this study, it is clear that the role and the effect of vibration amplitude in grading neuromuscular response should not be ignored.
The VM EMGrms response under all the vibration conditions was similar to its control conditions response. This is likely due to the lesser engagement of this muscle in the task used in this study. The VM is likely to be more engaged as an agonist when the knee angle is greater, i.e., the knee is more extended. As the length of the muscle and pre-stretch during vibration appear to have direct influence on the neuromuscular response, the 90° knee angle posture employed in this study potentially restricted the involvement of the VM as an agonist, limiting the effect of vibration exercise on the VM’s neuromuscular activity. It is important to note that in the knee extension, the VM acts as a synergist with the VL. In this regard, a recent study suggests that quadriceps muscle activity during leg press exercise depends upon and strongly varies with the knee angle, foot placement and effort level.48 The VM has been shown also to display a non-linear EMG/force relationship during isometric leg press exercise.49 Further, recent investigation which looked at the ratio of VL/VM contraction during knee extension concluded that the neural drive may be biased towards the VL compared to the VM and seems to be dependent on the force level.50 The authors suggested that the higher the force generation capacity of an individual’s VL, the higher the bias of neural drive towards VL over the VM. The study also found that this bias increased with increase in the force level during isometric knee extension contraction. The above reasons might explain why, compared to the VL and BF, the VM did not show an increase in neuromuscular activity when stimulated by vibration superimposed on varying levels of contractions.
Contrary to the previous evidence for the upper limb,26 vibration stimulation superimposed on lower contraction levels of 20% to 60% of MVC in this study was found to be equally or more effective in inducing higher neuromuscular activity compared to near maximal/maximal effort levels of 80% and 100% of MVC. In the upper limb study,26 irrespective of muscle group (i.e., agonist or antagonist), higher force levels of 80% and 100% of MVC were able to induce significantly higher EMGrms amplitudes compared to control conditions. In Mischi and Cardinale,26 the maximum increase in average EMGrms value was found to be of 77.2%, whereas in the current study, the maximum increase in average EMGrms value was found to be of 118% when compared to the control. Based on the average increases in EMGrms values, vibration superimposed on isometric contraction seems to induce higher neuromuscular activity in the lower limbs compared to that which was reported previously for the upper limbs.26 This implies upper and lower limb muscles may respond differently to counteract the vibration, possibly with different neural strategies, thus leading to different neuromuscular responses even when stimulated by the same vibration parameters and level of muscle tension.
Although higher neuromuscular response was observed at lower contraction levels for the VL, similar conclusions cannot be drawn about the BF. In fact, the BF showed more significant activity at the higher contraction levels of 80% and 100% of MVC. Compared to the control and with increase in the force level, the VL and BF showed contrasting responses (i.e., the VL converging with the control and the BF diverging with the control). These contrasting responses of the VL and BF could be a neuromuscular strategy to counteract increasing muscle tension when superimposed on vibration. Reasons behind these seemingly contrasting differences in the neuromuscular activity of the upper and lower limb need to be investigated further.
Co-activation of agonist and antagonist
Co-activation of agonist and antagonist muscles at the joint is employed for stabilizing the joint.51 Indirect vibration stimulation (WBV and ULV) induces a perturbation at the joint.26,52 Therefore, when vibration stimulation is delivered, it would be reasonable to expect higher co-activation of the agonist–antagonist pair in order to stabilize the joint. This was indeed the case when co-activation of VL and BF under the vibration condition was compared to the control. In-fact with vibration stimulation, VL-BF showed higher co-activation at almost all the vibration conditions and effort levels.
Under both control and vibration conditions, co-activation levels were higher at lower effort levels and were lowest at the MVC. Interestingly, similar results have been reported in a study conducted on ULV.26 The authors of this study26 argued that when the agonist is involved in lower force production, the joint rotation is primarily controlled by the antagonist hence leading to higher co-activation. The results of our study also indicate that co-activation of the antagonist may be primarily used as a joint stabilization mechanism rather than to modulate agonist force output. In this regard, significantly higher co-activation levels (than control) under vibration conditions, at higher force levels may seem contradictory. However, it can be argued that when vibration is superimposed with graded force levels, the higher the force level, the higher the perturbation induced at the joints. Therefore, although overall co-activation levels dip at higher force levels, co-activation levels under vibration conditions (at higher force levels of 80% to 100% of MVC) were significantly higher than the respective control conditions.
Under direct vibration stimulation, higher co-activation levels compared to control have been reported.51 However, extrapolation of the results obtained from direct vibration stimulations to the indirect vibration stimulations should be approached with a caution. Notwithstanding these differences, however, co-activation results obtained in this study corroborate earlier findings.51 In that, vibration stimulation does induce higher co-activation in agonist–antagonist pair.
Potential mechanisms leading to increased neuromuscular activity
The observed increases in neuromuscular activity under vibration conditions superimposed with graded contraction levels can be ascribed to a range of mechanisms from the local (muscular) to the central (CNS) level.
On the local level, it has been reported that muscles actually damp externally applied vibrations and that activated muscles are capable of absorbing more vibration energy than the muscles in rigor.53,54 As a consequence, it has been suggested that muscles are activated to attenuate the vibrations.23 The higher neuromuscular activation levels observed in this study imply that the soft tissue activations to damp the oscillation could have contributed to the observed increases in neuromuscular activity.
The increase in the EMG amplitude also signifies modulation in the motor unit recruitment and/or motor unit discharge frequency. An increase in MEF can signify the additional recruitment of superficially located high threshold motor units, as these motor units typically contribute large and sharp spikes which influence high frequency bands of sEMG.35,55 The enhancement of the contribution to stretch reflexes with indirect vibration stimulation has been attributed to the possible recruitment of high threshold units and muscle fibres.56 This suggests that vibration could potentially modify motor unit recruitment patterns and rate coding behaviour, possibly recruiting high threshold motor units leading to enhancement in neuromuscular responses.
In addition, it is known that direct vibration stimulation induces TVR by stimulating primary and secondary afferents.1,44 Discharge of these afferents have been reported to be dependent on muscle pre-stretch, and the discharge increases with increase in muscle stretch length.1 However, voluntary isometric contraction also increases this discharge.1 Vibration also stimulates, Ib afferents from Golgi Tendon Organ1,57 and Ib afferents are stimulated more when muscle contracts.44 Thus, vibration has the ability to alter significantly the sensitivity of primary, secondary afferents and Ib afferents leading to an increase in neuromuscular response. Muscle length and isometric contraction seem to have direct effect on the spindle sensitivity altering the neuromuscular response further. Considering our observations, it could be that the increased neuromuscular activity observed with the superimposition of vibration may have been results of alterations in afferent responses due to vibration.
Limitations of the study
As discussed earlier, it is still not clear whether the electromyography amplitude response found to be synchronous with vibration stimulation frequency is due to motion artefacts or is the result of stretch reflex response.18,36 Due to this uncertainty, no artefact removal processing (except at 50 Hz) was performed on the EMG data obtained in this study. This might be considered a limitation. However, 50 Hz line interference was observed in all of the WBV EMG data and a notch filter cantered at 50 Hz frequency was used to attenuate the line interference during both 30 Hz and 50 Hz stimuli EMG data. It is important to note that of all the frequency amplitude stimuli combinations tested for this study, 50 Hz stimulation with (0.5 mm amplitude) induced the largest neuromuscular activity. And overall, 50 Hz stimulations induced equal or higher neuromuscular activity compared to 30 Hz stimulations.
If it is assumed that vibration stimulation leads to motion artefacts in the sEMG data at the frequency of vibration stimulation and harmonics thereof, the largest energy of the so-called ‘motion artefact’ is concentrated at the stimulus frequency.36 For the EMG data collected for this study, the spikes at 50 Hz were among the largest (although it did not necessarily contain high energy). Despite removing the most significant proportion of the possible ‘motion artefact’ (with the largest spike) around 50 Hz, from the EMG data, the 50 Hz stimulus led to equal or higher neuromuscular activity compared to the 30 Hz in this study. Further, despite the fact that the signal at 30 Hz frequency was not removed from the 30 Hz stimulation sEMG data, the general trends of 30 Hz and 50 Hz neuromuscular responses (i.e., EMGrms, MEF) were quite alike. This gives further confidence in the results of this study, in that, the possibility of motion artefact skewing the EMG data and the results is quite limited.
It is important to note that in the vibration exercise superimposed with graded isometric contraction, transmission of the vibration through the limbs would be dependent on muscle contraction.16,58 Thus, the degree of muscle contraction and body posture (e.g., knee angle) would in effect dictate the level of vibration transmission and this could have implications on EMG artefacts. Thus, motion artefact/stretch reflex responses might be different when WBV is combined with graded isometric contractions. Hence, to analyse the motion artefact or stretch reflex’s presence, dedicated and specific signal processing methods may need to be devised59 and adapted according to the variables (e.g., force/contraction level and stimuli characteristics, etc.) specific to the study.
Conclusions
Isometric contraction superimposed on vibration stimulation leads to higher neuromuscular activity compared to isometric contraction alone in the lower limbs.
In the agonist muscles during a leg press task, vibration exercise with lower contraction levels of 20% to 60% of MVC force seem to generate higher neuromuscular activation compared to the higher levels of 80% to 100% of MVC.
In the antagonist, higher contraction levels of 80% to 100% seem to induce equal or more neuromuscular activity compared to the lower contraction levels. Whether this apparently contrasting difference between the agonist and the antagonist responses at higher contraction levels of 80% to 100% of MVC is a part of wider neuromuscular response strategy is unclear.
Among the vibration variables tested, the 50 Hz–0.5 mm stimulus generated the highest neuromuscular response compared to the control irrespective of the muscle group and/or contraction level.
Both 50 Hz and 30 Hz frequencies led to higher neuromuscular activity compared to the control; however, the combination of the frequency with the amplitude and the muscle tension together seem to grade the final neuromuscular output instead of frequency alone.
Compared to the control, vibration stimulus led to higher agonist–antagonist co-activation in all conditions and effort levels except 20% of MVC.
Sub-maximal and maximal levels of 80% and 100% MVC contraction force led to the most significant co-activation difference between the control and the vibration.
Acknowledgements
The authors would like to thank Scottish Funding Council (SFC) for funding to support the study. The authors thank the volunteers for their participation. ANP would also like to thank Royal Society of Edinburgh for the J M Lessells Travelling Fellowship and to Prof. Kevin Englehart of University of New Brunswick, Canada for his expert advice during the fellowship in relation to this work.
Declaration of conflicting interests
The author(s) declared no potential conflicts of interest with respect to the research, authorship, and/or publication of this article.
Funding
The author(s) disclosed receipt of the following financial support for the research, authorship, and/or publication of this article: This work was supported by the Scottish Funding Council’s North of Scotland Technology (NESTech) Seed Fund. ANP was also supported by a Royal Society of Edinburgh’s J M Lessells Travelling Fellowship in relation to this work.
Guarantor
ANP
Contributorship
MC, RDN and ANP conceptualised and designed the study. RDN developed the initial design of the device. ANP and RDN further developed the device. ANP completed the hardware, instrumentation and computer interfacing with the software programming required for the device operation. ANP acquired the data and processed and analysed the data from the study. ANP interpreted results from the data and RDN and MC provided critical input to the results. ANP drafted the original manuscript. ANP finalized the manuscript. All authors read and revised the manuscript critically for important intellectual content, and approved the final manuscript for publication. All authors agree to be accountable for all aspects of the work.
Availability of data and materials
Data and materials can be made available upon request to the authors.
Ethics approval and consent to participate
Experiments were approved by the North of Scotland Research Ethics Committee (NOSREC) of the National Health Service (NHS) Grampian, Aberdeen, UK. Ethics reference: REC: 09/S0802/2.
References
- 1.Burke D, Hagbarth KE, Löfstedt L, et al. The responses of human muscle spindle endings to vibration during isometric contraction. J Physiol 1976; 261: 695–711. [DOI] [PMC free article] [PubMed] [Google Scholar]
- 2.Bovenzi M. Health effects of mechanical vibration. G Ital Med Lav Ergon 2005; 27: 58–64. [PubMed] [Google Scholar]
- 3.Bovenzi M, Betta A. Low-back disorders in agricultural tractor drivers exposed to whole-body vibration and postural stress. Appl Ergon 1994; 25: 231–241. [DOI] [PubMed] [Google Scholar]
- 4.Griffin MJ, Bovenzi M. The diagnosis of disorders caused by hand-transmitted vibration: Southampton Workshop 2000. Int Arch Occup Environ Health 2002; 75: 1–5. [DOI] [PubMed] [Google Scholar]
- 5.Issurin VB, Tenenbaum G. Acute and residual effects of vibratory stimulation on explosive strength in elite and amateur athletes. J Sports Sci 1999; 17: 177–182. [DOI] [PubMed] [Google Scholar]
- 6.Delecluse C, Rolents M, Verschueren SM. Strength increase after whole-body vibration compared with resistance training. Med Sci Sport Exerc 2003; 35: 1033–1041. [DOI] [PubMed] [Google Scholar]
- 7.Cormie P, Deane RS, Triplett NT, et al. Acute effects of whole-body vibration on muscle activity, strength, and power. J Strength Cond Res 2006; 20: 257–261. [DOI] [PubMed] [Google Scholar]
- 8.Torvinen S, Kannus P, Sievänen H, et al. Effect of four-month vertical whole body vibration on performance and balance. Med Sci Sports Exerc 2002; 34: 1523–1528. [DOI] [PubMed] [Google Scholar]
- 9.Verschueren SM, Roelants M, Delecluse C, et al. Effect of 6-month whole body vibration training on hip density, muscle strength, and postural control in postmenopausal women: a randomized controlled pilot study. J Bone Miner Res 2003; 19: 352–359. [DOI] [PubMed] [Google Scholar]
- 10.Bautmans I, Van Hees E, Lemper J-C, et al. The feasibility of whole body vibration in institutionalised elderly persons and its influence on muscle performance, balance and mobility: a randomised controlled trial [ISRCTN62535013]. BMC Geriatr 2005; 5: 17. [DOI] [PMC free article] [PubMed] [Google Scholar]
- 11.Rubin C, Judex S, Qin YX. Low-level mechanical signals and their potential as a non-pharmacological intervention for osteoporosis. Age Ageing 2006; 35: 32–36. [DOI] [PubMed] [Google Scholar]
- 12.Lance JW, De Gail P, Neilson PD. Tonic and phasic spinal cord mechanisms in man. J Neurol Neurosurg Psychiatry 1966; 29: 535–544. [DOI] [PMC free article] [PubMed] [Google Scholar]
- 13.Hagbarth K, Eklund G. Tonic vibration reflexes (TVR) in spasticity. Brain Res 1966; 2: 201–203. [DOI] [PubMed] [Google Scholar]
- 14.Ma C, Liu A, Sun M, et al. Effect of whole-body vibration on reduction of bone loss and fall prevention in postmenopausal women: a meta-analysis and systematic review. J Orthop Surg Res 2016; 11: 24. [DOI] [PMC free article] [PubMed] [Google Scholar]
- 15.Park S-Y, Son W-M, Kwon O-S. Effects of whole body vibration training on body composition, skeletal muscle strength, and cardiovascular health. J Exerc Rehabil 2015; 11: 289–295. [DOI] [PMC free article] [PubMed] [Google Scholar]
- 16.Rittweger J. Vibration as an exercise modality: how it may work, and what its potential might be. Eur J Appl Physiol 2010; 108: 877–904. [DOI] [PubMed] [Google Scholar]
- 17.Cardinale M, Bosco C. The use of vibration as an exercise intervention. Exerc Sport Sci Rev 2003; 31: 3–7. [DOI] [PubMed] [Google Scholar]
- 18.Ritzmann R, Kramer A, Gruber M, et al. EMG activity during whole body vibration: motion artifacts or stretch reflexes?. Eur J Appl Physiol 2010; 110: 143–151. [DOI] [PubMed] [Google Scholar]
- 19.Ritzmann R, Kramer A, Bernhardt S, et al. Whole body vibration training – improving balance control and muscle endurance. PLoS One 2014; 9: e89905. [DOI] [PMC free article] [PubMed] [Google Scholar]
- 20.Eklund G, Hagbarth KE. Normal variability of tonic vibration reflexes in man. Exp Neurol 1966; 16: 80–92. [DOI] [PubMed] [Google Scholar]
- 21.Bishop B. Vibratory stimulation – neurophysiology of motor responses evoked by vibratory stimulation. Phys Ther 1974; 54: 1273–1282. [Google Scholar]
- 22.Cochrane DJ. The potential neural mechanisms of acute indirect vibration. J Sport Sci Med 2011; 10: 19–30. [PMC free article] [PubMed] [Google Scholar]
- 23.Wakeling JM, Nigg BM, Rozitis AI. Muscle activity damps the soft tissue resonance that occurs in response to pulsed and continuous vibrations. J Appl Physiol 2002; 93: 1093–1103. [DOI] [PubMed] [Google Scholar]
- 24.Wakeling JM, Nigg BM. Modification of soft tissue vibrations in the leg by muscular activity. J Appl Physiol 2001; 90: 412–420. [DOI] [PubMed] [Google Scholar]
- 25.Krause A, Gollhofer A, Krause A, et al. Acute corticospinal and spinal modulation after whole body vibration: acute corticospinal and spinal modulation after whole body vibration. J Musculoskelet Neuronal Interact 2016; 16: 327–338. [PMC free article] [PubMed] [Google Scholar]
- 26.Mischi M, Cardinale M. The effects of a 28-Hz vibration on arm muscle activity during isometric exercise. Med Sci Sports Exerc 2009; 41: 645–652. [DOI] [PubMed] [Google Scholar]
- 27.Pujari AN, Neilson R, Aphale S, et al. Novel upper limb vibration prototype with sports and rehabilitation applications: development, evaluation and preliminary study. Healthc Technol Lett 2017; 4: 44–49. [DOI] [PMC free article] [PubMed] [Google Scholar]
- 28.Ritzmann R, Gollhofer A, Kramer A. The influence of vibration type, frequency, body position and additional load on the neuromuscular activity during whole body vibration. Eur J Appl Physiol 2013; 113: 1–11. [DOI] [PubMed] [Google Scholar]
- 29.Pujari AN, Neilson RD, Cardinale M. A novel vibration device for neuromuscular stimulation for sports and rehabilitation applications. Annu Int Conf IEEE Eng Med Biol Soc 2009; 2009: 839–844. [DOI] [PubMed] [Google Scholar]
- 30.Pujari Amit N. Development and evaluation of vibration apparatus and method for neuromuscular stimulation. PhD Thesis, University of Aberdeen, UK, 2016.
- 31.Cardinale M. Apparatus and method for muscular stimulation. WO2004009173 A2, 2004.
- 32.Hermens HJ, Freriks B, Disselhorst-Klug C, et al. Development of recommendations for SEMG sensors and sensor placement procedures. J Electromyogr Kinesiol 2000; 10: 361–374. [DOI] [PubMed] [Google Scholar]
- 33.van Rijn AC, Peper A, Grimbergen CA. High-quality recording of bioelectric events. Med Biol Eng Comput 1990; 28: 389–397. [DOI] [PubMed] [Google Scholar]
- 34.Farina D, Merletti R. Comparison of algorithms for estimation of EMG variables during voluntary isometric contractions. J Electromyogr Kinesiol 2000; 10: 337–349. [DOI] [PubMed] [Google Scholar]
- 35.Merletti R and Parker PA. Electromyography: physiology, engineering, and non-invasive applications. New Jersey: John Wiley.
- 36.Fratini A, Cesarelli M, Bifulco P, et al. Relevance of motion artifact in electromyography recordings during vibration treatment. J Electromyogr Kinesiol 2009; 19: 710–718. [DOI] [PubMed] [Google Scholar]
- 37.Abercromby AFJ, Amonette WE, Layne CS, et al. Variation in neuromuscular responses during acute whole-body vibration exercise. Med Sci Sport Exerc 2007; 39: 1642–1650. [DOI] [PubMed] [Google Scholar]
- 38.Xu L, Rabotti C, Mischi M. On the nature of the electromyographic signals recorded during vibration exercise. Eur J Appl Physiol 2015; 115: 1095–1106. [DOI] [PubMed] [Google Scholar]
- 39.Di Giminiani R, Masedu F, Tihanyi J, et al. The interaction between body position and vibration frequency on acute response to whole body vibration. J Electromyogr Kinesiol 2013; 23: 245–251. [DOI] [PubMed] [Google Scholar]
- 40.Petit P-D, Pensini M, Tessaro J, et al. Optimal whole-body vibration settings for muscle strength and power enhancement in human knee extensors. J Electromyogr Kinesiol 2010; 20: 1186–1195. [DOI] [PubMed] [Google Scholar]
- 41.Wakeling JM, Nigg BM. Soft-tissue vibrations in the quadriceps measured with skin mounted transducers. J Biomech 2001; 34: 539–543. [DOI] [PubMed] [Google Scholar]
- 42.Marín PJ, Rhea MR. Effects of vibration training on muscle power: a meta-analysis. J Strength Cond Res 2010; 24: 871–878. [DOI] [PubMed] [Google Scholar]
- 43.Tihanyi TK, Horváth M, Fazekas G, et al. One session of whole body vibration increases voluntary muscle strength transiently in patients with stroke. Clin Rehabil 2007; 21: 782–793. [DOI] [PubMed] [Google Scholar]
- 44.Brown MC, Engberg I, Matthews PB. The relative sensitivity to vibration of muscle receptors of the cat. J Physiol 1967; 192: 773–800. [DOI] [PMC free article] [PubMed] [Google Scholar]
- 45.Matthews PB. The reflex excitation of the soleus muscle of the decerebrate cat caused by vibbration applied to its tendon. J Physiol 1966; 184: 450–472. [DOI] [PMC free article] [PubMed] [Google Scholar]
- 46.Luo J, McNamara B, Moran K. The use of vibration training to enhance muscle strength and power. Sport Med 2005; 35: 23–41. [DOI] [PubMed] [Google Scholar]
- 47.Moran K, McNamara B, Luo J. Effect of vibration training in maximal effort (70% 1RM) dynamic bicep curls. Med Sci Sports Exerc 2007; 39: 526–533. [DOI] [PubMed] [Google Scholar]
- 48.Da Silva EM, Brentano MA, Cadore EL, et al. Analysis of muscle activation during different leg press exercises at submaximum effort levels. J Strength Cond Res 2008; 22: 1059–1065. [DOI] [PubMed] [Google Scholar]
- 49.Alkner BA, Tesch PA, Berg HE. Quadriceps EMG/force relationship in knee extension and leg press. Med Sci Sport Exerc 2000; 32: 459–463. [DOI] [PubMed] [Google Scholar]
- 50.Hug F, Goupille C, Baum D, et al. Nature of the coupling between neural drive and force-generating capacity in the human quadriceps muscle. Proc R Soc B Biol Sci 2015; 282: 20151908. [DOI] [PMC free article] [PubMed] [Google Scholar]
- 51.Rothmuller C, Cafarelli E. Effect of vibration on antagonist muscle coactivation during progressive fatigue in humans. J Physiol 1995; 485: 857–864. [DOI] [PMC free article] [PubMed] [Google Scholar]
- 52.Nordlund MM, Thorstensson A. Strength training effects of whole-body vibration?. Scand J Med Sci Sport 2007; 17: 12–17. [DOI] [PubMed] [Google Scholar]
- 53.Ettema GJ, Huijing PA. Frequency response to rat gastrocnemius medialis in small amplitude vibrations. J Biomech 1994; 27: 1015–1022. [DOI] [PubMed] [Google Scholar]
- 54.Kawai M, Brandt PW. Sinusoidal analysis: a high resolution method for correlating biochemical reactions with physiological processes in activated skeletal muscles of rabbit, frog and crayfish. J Muscle Res Cell Motil 1980; 1: 279–303. [DOI] [PubMed] [Google Scholar]
- 55.Heckman CJ, Binder MD. Computer simulations of the effects of different synaptic input systems on motor unit recruitment. J Neurophysiol 1993; 70: 1827–1840. [DOI] [PubMed] [Google Scholar]
- 56.Rittweger J, Mutschelknauss M, Felsenberg D. Acute changes in neuromuscular excitability after exhaustive whole body vibration exercise as compared to exhaustion by squatting exercise. Clin Physiol Funct Imaging 2003; 23: 81–86. [DOI] [PubMed] [Google Scholar]
- 57.Hayward LF, Nielsen RP, Heckman CJ, et al. Tendon vibration-induced inhibition of human and cat triceps surae group I reflexes: evidence of selective Ib afferent fiber activation. Exp Neurol 1986; 94: 333–47. [DOI] [PubMed] [Google Scholar]
- 58.Yue Z, Mester J. A model analysis of internal loads, energetics, and effects of wobbling mass during the whole-body vibration. J Biomech 2002; 35: 639–47. [DOI] [PubMed] [Google Scholar]
- 59.Xu L, Rabotti C, Mischi M. Novel vibration-exercise instrument with dedicated adaptive filtering for electromyographic investigation of neuromuscular activation. IEEE Trans Neural Syst Rehabil Eng 2013; 21: 275–282. [DOI] [PubMed] [Google Scholar]
Associated Data
This section collects any data citations, data availability statements, or supplementary materials included in this article.
Data Availability Statement
Data and materials can be made available upon request to the authors.


