

Abstract
Background:
Previous studies suggest that cumulative lead exposure is associated with cognitive decline, but its relation with Alzheimer’s disease (AD) remains unclear. Therefore, this study investigated the longitudinal association between blood lead level (BLL) and AD mortality.
Methods:
This study included 8,080 elders (60 years or older) with BLL data from the 1999 to 2008 US National Health and Nutrition Examination Survey. Mortality was determined from linked 1999–2014 National Death Index data. A causal diagram presented causal assumptions and identified a sufficient set of confounders: age, sex, poverty, race/ethnicity, and smoking. Cox proportional hazard models were used to determine the association between BLL and subsequent AD mortality. Impacts of competing risks and design effect were also assessed. Adjusted hazard rate ratio (HRR) and 95% confidence interval (CI) were reported.
Results:
Follow-up ranged from <1 to 152 months (median, 74). Eighty-one participants died from AD over 632,075 total person-months at risk. An increase in BLL was associated with an increase in AD mortality after adjusting for identified confounders. We estimated that those with BLL of 1.5 and 5 μg/dl had 1.2 (95% CI = 0.70, 2.1) and 1.4 (95% CI = 0.54, 3.8) times the rate of AD mortality compared to those with BLL of 0.3 μg/dl, respectively, after accounting for competing risks. Adjusted HRRs were 1.5 (95% CI = 0.81, 2.9) and 2.1 (95% CI = 0.70, 6.3), respectively, after considering design effect.
Conclusions:
This longitudinal study demonstrated a positive, albeit not statistically significant, association between BLL and AD mortality after adjustment for competing risks or design effect.
Keywords: Alzheimer's disease, Competing risk, Lead, Mortality, National Health and Nutrition Examination Survey
What this study adds
Alzheimer’s disease (AD) is a leading cause of mortality, yet very little is known about environmental risk factors for AD. Previous research has demonstrated that chronic lead exposure is related to cognitive decline, but studies examining the association of lead specifically with AD are currently limited. To address this knowledge gap, this study used a large, representative sample of the US population to determine the longitudinal association between blood lead level and subsequent AD mortality. This novel study generated high-quality evidence to add to our understanding of the effect of lead exposure on AD.
Introduction
Alzheimer’s disease (AD) is a neurodegenerative disorder characterized by accumulation of β-amyloid plaques and neurofibrillary tangles in brain tissue. These result in symptoms of progressive memory loss and cognitive dysfunction. AD is the sixth leading cause of mortality in the United States, and its prevalence is rapidly increasing.1 In 2010, >35 million people worldwide were estimated to live with dementia; this estimate is expected to quadruple by 2050.2 Increased efforts to prevent AD are therefore warranted; however, knowledge regarding modifiable AD risk factors remains limited.
The etiology of AD is complex, chronic, and multifactorial, involving a combination of genetic and environmental factors. Brain changes such as amyloid beta (Aβ) deposition may begin ≥20 years before AD symptoms appear.3 Well-established, nonmodifiable risk factors for AD include older age,4 apolipoprotein E genotype e4 allele,5 and family history of dementia.6 Modifiable risk factors that have been well studied in recent years include cognitive reserve, i.e., education attainment,7 physical activity,8 and cardiovascular risk factors (hypertension, obesity, diabetes, and smoking).9 Proposed environmental risk factors for AD include particulate matter,10 lead,11,12 and other metals and trace elements13,14; but to date, these have not been as well studied.
Lead is a heavy metal used extensively as an additive in gasoline and paint, leading to historic and current environmental contamination and exposure worldwide.15 For diseases with a long latency period, including AD,3 the exposures leading to these conditions would have occurred decades before the onset of clinical disease. Therefore, although lead exposure has decreased in recent decades, it is likely that new AD cases would have been affected by exposures which occurred decades earlier, at a time when lead exposures were much higher.12 Meanwhile, even low lead exposure is of public health concern: evidence suggests that blood lead levels below the US Centers for Disease Control and Prevention action level of 5 µg/dl may still contribute to detrimental health impacts.16,17 Lead exposure is associated with cardiovascular disease18 and cardiovascular risk factors such as smoking,19 hypertension,20 elevated cholesterol,21 and diabetes.22 Lead exposure also adversely affects renal and reproductive functions and has been associated with cancer.16 However, lead is particularly noted for its impact as a neurotoxin.23
Toxicology research has provided consistent evidence that lead exposure is associated with the development of AD pathology. Studies on both primates and rats exposed to lead have subsequent deposition of β-amyloid24–27 or phosphorylated tau protein28 in brain tissue. Notably, early-life exposure to lead has been shown to increase the presence of AD-related proteins later in life.24,29,30
Substantial epidemiology evidence consistently reports an association of lead with reduced cognition. Several large longitudinal studies in the elderly found an association between bone lead, a biomarker of cumulative lead exposure, with reduced cognition.31–35 Other longitudinal studies report that lead poisoning during childhood decreased cognition in later life.36,37 Cross-sectional studies using bone lead report that lead was significantly associated with impaired cognition38,39; however, other cross-sectional studies using blood lead did not observe this association,39,40 possibly due to the fact that blood lead typically reflects recent, not chronic, lead exposure.
As described above, the majority of previous toxicology and epidemiology and research suggests that lead exposure, particularly cumulative or early-life exposure, is associated with cognitive decline, but its relation with AD mortality remains unclear. Thus, the main objective of this research was to investigate the association between blood lead level (BLL) with subsequent AD mortality using a large sample that is representative of the US population. We hypothesized that increased BLL was associated with an increased risk of AD mortality. This research adds to previous work through use of a large representative sample, using a causal diagram to determine a set of confounders, and creation of models that account for competing risks.
Methods
Study population
This longitudinal study of the US population used data from the 1999 to 2008 National Health and Nutrition Examination Survey (NHANES) data linked to National Center for Health Statistics (NCHS) mortality files derived from 1999 to 2014 National Death Index. NHANES is a continuous, cross-sectional study developed and implemented by the US Centers for Disease Control and Prevention (CDC). NHANES surveys are conducted in 2-year cycles: each cycle uses a stratified multistage probability sampling design to recruit a representative sample of the US population. All NHANES participants were asked to complete an in-home interview; a subset of participants also completed a physical examination and had samples collected for laboratory analysis, including BLL, during a visit at the Mobile Examination Center (MEC). More details about NHANES methods and design can be found at https://www.cdc.gov/nchs/nhanes/. The NCHS Research Ethics Review Board approved the NHANES surveys and linked data. Study participants completed written informed consent forms before data collection.
Figure 1 depicts the selection of study participants. Data from five survey cycles (1999–2000, 2001–2002, 2003–2004, 2005–2006, and 2007–2008) were combined for this analysis. Inclusion criteria were as follows: (1) participation in the NHANES 1999–2008; (2) 60 years or older; and (3) had BLL measurement at the time of MEC. NHANES 1999–2008 included 51,623 participants, of whom 9,331 were 60 years or older. Additional exclusions were as follows: n = 814 for not completing the MEC examination, n = 433 participants for not having BLL data, and n = 4 for missing information on length of follow-up. This resulted in a total of 8,080 eligible participants for this analysis.
Figure 1.
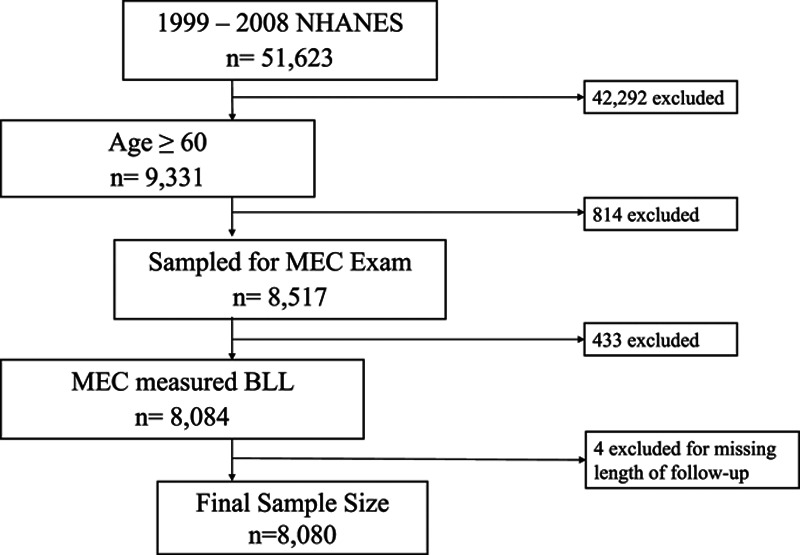
Study sample flowchart.
Study variables
Time to AD mortality was the outcome of interest. The length of follow-up was provided in the NHANES linked mortality file and was calculated from the examination date through the date of death, or through the end of the mortality follow-up period (31 December 2014) for those assumed alive. NHANES linked mortality files reported that mortality was matched using multiple sources of information such as National Death Index (NDI) record, Death Master File or Numident File from the Social Security Administration (SSA), Centers for Medicare and Medicaid Services (CMSA), and death certificate. US death certificates report an immediate cause of death and several underlying causes of death. The public-use NCHS linked mortality files contained only the immediate cause of death to protect the confidentiality of participant. Therefore, the identification of AD mortality in this study was based on the immediate cause of death. Survey participants were considered deceased based on any combination of the mortality sources. Participants who were not matched in the linked mortality file during the follow-up period were considered to be still alive on 31 December 2014. Cause of death was coded according to the International Classification of Disease, revision 10 (ICD-10) system: G30 was used to indicate AD. Mortality due to cancer (C00-C97), cardiovascular disease (CVD) (I00-I78), cerebrovascular disease (CVA) (I60-I69), nephritis (N00-N07, N17-N19, N25-N27), and respiratory disease (J40-J47) were abstracted as the competing risks of AD mortality in this study. These diseases were selected as competing risks for AD mortality because they have been known to be associated with AD.41–44
BLL, reported in μg/dl, was the exposure of interest. Blood samples were collected during the NHANES MEC visit. To minimize the chance for metal contamination, sample collection devices and containers were prescreened before use and blood was drawn through stainless steel needles. Blood samples were transported at cold temperatures (2°C–8°C) and stored at ≤−20°C. Metal assays were performed by the Inorganic Radionuclides and Toxicology Division of Laboratory Sciences National Center for Environmental Health (Atlanta, GA) using inductively coupled plasma-dynamic reaction cell-mass spectrometry (ICP-DRC-MS). The lower limit of detection (LLOD) for BLL was 0.3 μg/dl. Lead concentrations below the LLOD were replaced with  for analyses. Out of 8,080 participants, only six (0.1%; 95% confidence interval [CI] = 0.02, 0.21) had BLL < LLOD. All other participants (n = 8,074, 99.9%; 95% CI = 99.8, 100.0) had BLL > LLOD. The reference for whole blood, in a venous blood sample of BLL for adults, is designated as BLL 5 µg/dl by the National Institute for Occupational Safety and Health (NIOSH).17
Confounding variables were identified based on a priori causal assumptions of their associations with BLL and AD mortality and each other; these assumptions were based on previously published literature.45 A causal diagram (Figure 2), in the form of directed acyclic graph (DAG), was constructed to present these causal assumptions, using methods described by Hernán et al.46 Using the DAG, we identified all backdoor paths connecting between BLL and AD mortality, and a set of covariates blocking all identified backdoor paths. An example of two backdoor paths according to our causal assumptions is (1) BLL→age→cognition and brain reserve→AD mortality; and (2) BLL→age→osteoporosis→AD mortality. In this example, statistically controlling for age is sufficient to block both backdoor paths. The minimally sufficient set of confounders needed to be adjusted for in regression models identified using the DAG contained age, sex, poverty status, race/ethnicity, and smoking status.
Figure 2.

Causal diagram presenting the causal assumptions among study variables in assessing the association between blood lead and Alzheimer’s disease mortality. Dashed line indicates proposed association between BLL and AD mortality. BMI indicates body mass index.
Data on confounders were obtained during the in-home interview, except for serum cotinine, which was obtained at the MEC visit. Serum cotinine was determined using an isotope dilution high-performance liquid chromatography/atmospheric pressure chemical ionization tandem mass spectrometry/mass spectrometry (ID HPLC-APCI MS/MS). The limit of detection (LOD) for cotinine was 0.05 ng/ml for 1999–2000 and 0.015 ng/ml for 2001–2008. Serum cotinine concentration was used to assign smoking status (smoker: cotinine ≥10 ng/ml; nonsmoker: cotinine <10 ng/ml) of participants47; participants with cotinine values <LOD were classified as nonsmokers. For participants who had missing cotinine data (n = 166, 2.1%), smoking status was determined using self-reported current smoking status. Participants who reported smoking ≥100 cigarettes, pipes, or cigars in their lifetime or smoked ≥20 times in lifetime were classified as smokers; otherwise, participants were classified as nonsmokers.
Race/ethnicity was classified as non-Hispanic (NH) white, NH black, Hispanic, and other/multiracial. Socioeconomic status of participants was measured using poverty-to-income ratio (PIR). PIR was defined as the ratio of self-reported household income to the US federal poverty level. Participants were classified into low socioeconomic status (PIR <2) or high socioeconomic status (PIR ≥2) categories. Participants who did not report PIR (n = 773, 9.6%) were grouped as the third category of poverty status for inclusion in regression analyses.
Statistical analysis
Statistical analyses were performed using SAS 9.4 for Windows (SAS Institute, Cary, NC), which allowed appropriate adjustment for the multistage probability sampling design employed by NHANES. Analyses, with the exception of frequency counts and models accounting for competing risk, incorporated MEC survey weights and used commands specific to analyzing survey datasets; thus, they accounted for survey design, nonresponse, poststratification, and oversampling. Competing risk models did not account for survey design because methods for assessing both survey design and competing risk from survey data are not currently available.
Descriptive statistics were used to describe distribution of the variables within the study population. Summary statistics were expressed as frequency counts and percentages (95% CI) for categorical variables and mean (standard deviation) for continuous variables; with the exception of BLL, which had a right-skewed distribution, and thus geometric mean and 95% CI were reported.
Cox proportional hazards regression models were used to model the association between BLL and AD mortality while adjusting for confounders. We evaluated the linearity of the association between the continuous BLL and log hazard rate ratio (HRR) of AD mortality (i.e., log-linearity assumption) by modeling categorized (by quintiles) BLL against time to AD mortality. The result suggested a nonlinear positive association between BLL and log HHR of AD mortality; thus, BLL was natural log transformed for regression analyses. The proportionality assumption for Cox regression was investigated by adding a time-dependent covariate to the regression models. The result showed that the proportionality assumption was not violated. Cox proportional hazards regression models without a time-dependent covariate were used.
We created three regression models to present our results. The first, the “design effect model,” accounted for the complex survey design utilized by NHANES though incorporating survey weights as described above. The second, the “competing risk model,” is a semiparametric model that assesses the hazard rate of the outcome of interest (AD mortality) occurring in the presence of other mortality, i.e., competing risks. A third model, the “base model,” did not include adjustment for either design effect or competing risk. The base model provided baseline estimates for us to assess the impacts of design effect and competing risks on HRR and CI estimates.
Results
There were a total of 8,080 participants included in the study: 1,516 from 1999 to 2000; 1,550 from 2001 to 2002; 1,669 from 2003 to 2004; 1,419 from 2005 to 2006; and 1,926 from 2007 to 2008. Table 1 summarizes the demographic characteristics of participants. Mean age was 71 years (SD, 7.8 years). The study population was mainly female, NH white, nonsmokers, and had income greater than two times above the poverty level.
Table 1.
Demographic characteristics of study population, n = 8,080

Mortality data are presented in Table 2. Over 632,075 total person-months at risk, N = 2,308 (25%; 95% CI = 23.5, 26.8) participants died, including N = 81 (4%; 95% CI = 3.0, 5.0) participants who died from AD. The follow-up period ranged from <1 to 152 months (median, 74). BLLs stratified by mortality status are also presented in Table 2. Geometric mean for BLL was 2.1 μg/dl (95% CI = 2.0, 2.1). The vast majority of participants (N = 7,449, 94.4%; 95% CI = 93.7, 94.9) had BLL <5 μg/dl. There were 631 participants (5.6%; 95% CI = 5.1, 6.3) who had BLL ≥5 μg/dl.
Table 2.
Baseline geometric mean BLL stratified by subsequent mortality

Figure 3 presents adjusted HRR and lower 95% CI over the range of BLL in the study for both models. This indicates a positive, but not statistically significant, dose–response association between BLL and AD mortality regardless of whether the model was accounting for competing risks or design effect. HRR estimates derived from the design effect model were greater than those derived from the competing risk model, whereas the widths of the 95% CI were similar between the two models.
Figure 3.
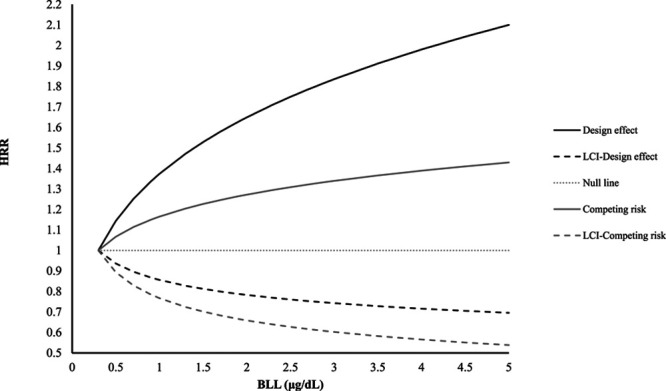
HRR for Alzheimer’s disease mortality by BLL, including lower 95% confidence interval. Estimates are derived from different Cox regression models incorporating either design effect or competing risks. Null line represents HRR = 1. LCI indicates lower 95% confidence interval.
Table 3 presents adjusted HRR for selected BLL values. Participants with BLL of 1.5 or 5 μg/dl had 1.5 (95% CI = 0.81, 2.9) and 2.1 (95% CI = 0.70, 6.3) times the rate of AD mortality compared to those with BLL of 0.3 μg/dl, respectively, after accounting for design effect. Equivalent-adjusted HRRs for the competing risks model were 1.2 (95% CI = 0.70, 2.1) and 1.4 (95% CI = 0.54, 3.8), respectively. Point estimates for the base model trended toward being lower than those for the design effect model, but higher than those for the competing risk model.
Table 3.
Adjusteda HRRs (95% CI) for selected BLLs predicting AD mortality

Discussion
In this cross-sectional study, we examined the association between BLL with subsequent AD mortality in a large and representative cohort of older adults from the United States using three Cox regression models. We found that an increase in BLL was associated with a nonstatistically significant increase in AD mortality, after adjusting for identified confounders, in all three model. To the best of our knowledge, this study is the first to investigate the association between BLL and AD mortality. However, there is an extensive literature evaluating the relation of environmental lead exposure with cognition, a key symptom of AD, discussed more below.
Results from cross-sectional analyses of lead and cognition are not consistent. Some studies report significant cross-sectional associations of blood lead with Mini-Mental Status Examination scores,48 or word recall and perception comparison tests,49 whereas other cross-sectional analyses using blood lead did not show an association of blood lead with cognitive function tests.31,39 In another analysis of NHANES data, van Wijngaarden et al40 found that blood lead was positively associated with a lower score on the Digit Symbol Substitution Test, but that association was not statistically significant. Among cross-sectional analyses using bone lead as a measure of exposure, some,38,39,49 but not all,32 report an association with lower neurobehavioral outcomes (e.g., cognitive impairment) that are associated with AD.
Longitudinal studies of lead with cognitive function provide stronger evidence toward an association because these evaluate changes of cognition within the same individual over time. Most longitudinal studies consistently showed an association of bone lead with declining cognitive and/or motor function.32,34,35,50 A longitudinal analysis of the Nurses’ Health Study cohort reported an association of reduced cognitive function with tibia lead, but this did not reach statistical significance (change in z-score, −0.024; 95% CI = −0.053, 0.004); however, this study only reported results from a 1-year follow-up.33 In contrast, longitudinal analyses using blood lead did not observe an association of lead with changes in cognitive function.31,51
Overall, the majority of this work suggests an association between lead and lower cognitive function, especially among studies using a longitudinal design or bone lead measures. Our results are consistent with the previous literature in that they suggest a detrimental effect of lead exposure on neurocognitive health outcomes. Even with the investigation of AD mortality instead of cognitive or motor function, our results suggest a moderate effect size with an increase in HRR by 14%–30% with each unit increase in BLL. However, the small number of AD mortalities in the study population did affect the precision of the HRR estimate, which was reflected in the wide 95% CIs.
This study relied on the use of the immediate cause of death as reported on death certificates to identify AD mortality. We did not utilize underlying cause of death as reported on the death certificate because it is classified as sensitive non–public-access data. Additionally, death certificate data are not as reliable as other methods of mortality assessment such as underlying cause of death52 because they tend to underreport persons dying of dementia.53 Among patients with multiple chronic conditions, it is possible for these conditions to result in mortality instead of AD, i.e., the effect of competing risks. This is of particular concern with AD because it may result in factors, such as dementia, that contribute to death from other causes.1 Thus, analyses relying of the leading cause of death to assess mortality may underestimate the overall impact of AD on mortality. Although we incorporated a competing risk model to account for this effect, it is possible that we were not able to account for the entirety of this effect.
Another limitation of this study design is that participants had blood drawn only once; thus, we could not capture change in BLL over time. It is possible that BLL may change over time because mobilization of lead from bones especially during turnover and osteoporosis influences the concentration of lead in blood, for years.54–56 Another limitation of BLL is that BLL generally reflects current lead exposure, not necessarily cumulative lead exposure.57,58 Cumulative exposure may be of importance to the relation of lead with AD, given that numerous toxicology studies identified early life as a key period of exposure30,59–62 and epidemiology studies using bone lead are more consistently associated with cognitive decline than studies using blood lead.33,48 However, Korrick et al63 and Hernández-Avila et al64 have demonstrated that bone lead and blood lead are significantly correlated; thus, although not ideal, use of blood lead, particularly in a longitudinal design as we do here, provides useful information. Another limitation is that with the small number of AD deaths in the study, we quantified only the overall effect of BLL on AD mortality and did not examine effect modification.
A strength of this study is its longitudinal design, with an average follow-up time of 79 months (95% CI = 76.9, 81.6 months). Additionally, this analysis included a large, representative population of US elders. Numerous checks for data quality and control are incorporated into the development of these datasets. Although the proportion of AD as a leading cause of death is relatively small, we were able to combine multiple years of NHANES data to increase the number of AD mortality cases.
Our analytical methods added additional strength to this study. We constructed a causal diagram to explicitly present our causal assumptions and to identify confounders according to these assumptions. We also evaluated model assumptions (e.g., log-linearity and proportionality assumptions) and derived effect estimates using different models accounting for competing risks or design effect. We present results derived from both models and a null model (i.e., without adjusting for competing risks or design effect) to assess the impacts of competing risks and design effect on HRR estimates. All models consistently showed a positive association between BLL and AD mortality. This allowed for the observation that HRR estimates adjusted for competing risks were closer to the null than those adjusted for design effect and the null model, suggesting that competing risks biased the HRR estimates away from the null. Compared with other results, we did not expect that competing risk to bias the estimates toward the null, which could mean that models should also control for competing risk confounders.65
Conclusions
We used high-quality data from a large, representative sample of US adults to evaluate the association between blood lead and subsequent AD mortality, including adjustment for competing risks of mortality. Our study revealed a positive, but not statistically significant, association between BLL and AD mortality.
Conflicts of interest statement
The authors declare that they have no conflicts of interest with regard to the content of this report.
Footnotes
Published online 9 April 2019
Sponsorships or competing interests that may be relevant to content are disclosed at the end of the article.
Data used in this study are available for download at the National Health and Nutrition Examination Survey Web site, https://wwwn.cdc.gov/nchs/nhanes/Default.aspx; https://www.cdc.gov/nchs/data-linkage/mortality.htm; computer code will be made available upon request.
References
- 1.James BD, Leurgans SE, Hebert LE, Scherr PA, Yaffe K, Bennett DA. Contribution of Alzheimer disease to mortality in the United States. Neurology 2014821045–1050 [DOI] [PMC free article] [PubMed] [Google Scholar]
- 2.Holtzman DM, John CM, Goate A. Alzheimer’s disease: the challenge of the second century. Sci Transl Med 2011377sr1. [DOI] [PMC free article] [PubMed] [Google Scholar]
- 3.Villemagne VL, Burnham S, Bourgeat P, et al. ; Australian Imaging Biomarkers and Lifestyle (AIBL) Research Group Amyloid β deposition, neurodegeneration, and cognitive decline in sporadic Alzheimer’s disease: a prospective cohort study. Lancet Neurol 201312357–367 [DOI] [PubMed] [Google Scholar]
- 4.Hebert LE, Weuve J, Scherr PA, Evans DA. Alzheimer disease in the United States (2010–2050) estimated using the 2010 census. Neurology 2013801778–1783 [DOI] [PMC free article] [PubMed] [Google Scholar]
- 5.Liu CC, Liu CC, Kanekiyo T, Xu H, Bu G. Apolipoprotein E and Alzheimer disease: risk, mechanisms and therapy. Nat Rev Neurol 20139106–118 [DOI] [PMC free article] [PubMed] [Google Scholar]
- 6.Scarabino D, Gambina G, Broggio E, Pelliccia F, Corbo RM. Influence of family history of dementia in the development and progression of late-onset Alzheimer’s disease. Am J Med Genet B Neuropsychiatr Genet 2016171B250–256 [DOI] [PubMed] [Google Scholar]
- 7.Beydoun MA, Beydoun HA, Gamaldo AA, Teel A, Zonderman AB, Wang Y. Epidemiologic studies of modifiable factors associated with cognition and dementia: systematic review and meta-analysis. BMC Public Health 201414643. [DOI] [PMC free article] [PubMed] [Google Scholar]
- 8.Flicker L. Modifiable lifestyle risk factors for Alzheimer’s disease. J Alzheimers Dis 201020803–811 [DOI] [PubMed] [Google Scholar]
- 9.Baumgart M, Snyder HM, Carrillo MC, Fazio S, Kim H, Johns H. Summary of the evidence on modifiable risk factors for cognitive decline and dementia: a population-based perspective. Alzheimers Dement 201511718–726 [DOI] [PubMed] [Google Scholar]
- 10.Power MC, Adar SD, Yanosky JD, Weuve J. Exposure to air pollution as a potential contributor to cognitive function, cognitive decline, brain imaging, and dementia: a systematic review of epidemiologic research. Neurotoxicology 201656235–253 [DOI] [PMC free article] [PubMed] [Google Scholar]
- 11.Bakulski KM, Rozek LS, Dolinoy DC, Paulson HL, Hu H. Alzheimer’s disease and environmental exposure to lead: the epidemiologic evidence and potential role of epigenetics. Curr Alzheimer Res 20129563–573 [DOI] [PMC free article] [PubMed] [Google Scholar]
- 12.Laidlaw MA, Rowe DB, Ball AS, Mielke HW. A temporal association between accumulated petrol (gasoline) lead emissions and motor neuron disease in Australia. Int J Environ Res Public Health 20151216124–16135 [DOI] [PMC free article] [PubMed] [Google Scholar]
- 13.Veronese N, Zurlo A, Solmi M, et al. Magnesium status in Alzheimer’s disease: a systematic review. Am J Alzheimers Dis Other Demen 201631208–213 [DOI] [PMC free article] [PubMed] [Google Scholar]
- 14.Greenough MA, Camakaris J, Bush AI. Metal dyshomeostasis and oxidative stress in Alzheimer’s disease. Neurochem Int 201362540–555 [DOI] [PubMed] [Google Scholar]
- 15.Commentary: ISEE call for action for global control of lead exposure to eliminate lead poisoning. Epidemiol Camb Mass 201526774–777Available at: https://www.ncbi.nlm.nih.gov/pubmed/26230725 [DOI] [PubMed] [Google Scholar]
- 16.NTP monograph on health effects of low-level lead. NTP Monogr 2012xiii, xv–148Available at: https://www.ncbi.nlm.nih.gov/pubmed/23964424 [PubMed] [Google Scholar]
- 17.CDC. Adult Blood Lead Epidemiology and Surveillance (ABLES): Program Description: NIOSH Workplace Safety and Health Topic. Available at: https://www.cdc.gov/niosh/topics/ables/description.html. Published August 10, 2017. Accessed March 16, 2018.
- 18.Chen C, Li Q, Nie X, et al. Association of lead exposure with cardiovascular risk factors and diseases in Chinese adults. Environ Sci Pollut Res Int 20172422275–22283 [DOI] [PubMed] [Google Scholar]
- 19.Al-Delaimy WK, Manson JE, Solomon CG, et al. Smoking and risk of coronary heart disease among women with type 2 diabetes mellitus. Arch Intern Med 2002162273–279 [DOI] [PubMed] [Google Scholar]
- 20.Navas-Acien A, Guallar E, Silbergeld EK, Rothenberg SJ. Lead exposure and cardiovascular disease: a systematic review. Environ Health Perspect 2007115472–482 [DOI] [PMC free article] [PubMed] [Google Scholar]
- 21.Kotseva K, De Bacquer D, De Backer G, et al. Lifestyle and risk factor management in people at high risk of cardiovascular disease. A report from the European Society of Cardiology European Action on Secondary and Primary Prevention by Intervention to Reduce Events (EUROASPIRE) IV cross-sectional survey in 14 European regions. Eur J Prev Cardiol 2016232007–2018 [DOI] [PubMed] [Google Scholar]
- 22.Lavie CJ, Milani RV, Ventura HO. Obesity and cardiovascular disease: risk factor, paradox, and impact of weight loss. J Am Coll Cardiol 2009531925–1932 [DOI] [PubMed] [Google Scholar]
- 23.Council on Environmental Health. Prevention of childhood lead toxicity. Pediatrics. 2016;138:e20161493. doi: 10.1542/peds.2016-1493. [DOI] [PubMed] [Google Scholar]
- 24.Bihaqi SW, Bahmani A, Subaiea GM, Zawia NH. Infantile exposure to lead and late-age cognitive decline: relevance to AD. Alzheimers Dement 201410187–195 [DOI] [PMC free article] [PubMed] [Google Scholar]
- 25.Zawia NH, Basha MR. Environmental risk factors and the developmental basis for Alzheimer’s disease. Rev Neurosci 200516325–337 [DOI] [PubMed] [Google Scholar]
- 26.Behl M, Zhang Y, Zheng W. Involvement of insulin-degrading enzyme in the clearance of beta-amyloid at the blood-CSF barrier: consequences of lead exposure. Cerebrospinal Fluid Res 2009611. [DOI] [PMC free article] [PubMed] [Google Scholar]
- 27.Behl M, Zhang Y, Monnot AD, Jiang W, Zheng W. Increased beta-amyloid levels in the choroid plexus following lead exposure and the involvement of low-density lipoprotein receptor protein-1. Toxicol Appl Pharmacol 2009240245–254 [DOI] [PMC free article] [PubMed] [Google Scholar]
- 28.Gąssowska M, Baranowska-Bosiacka I, Moczydłowska J, et al. Perinatal exposure to lead (Pb) promotes Tau phosphorylation in the rat brain in a GSK-3β and CDK5 dependent manner: relevance to neurological disorders. Toxicology 2016347–34917–28 [DOI] [PubMed] [Google Scholar]
- 29.Eid A, Bihaqi SW, Renehan WE, Zawia NH. Developmental lead exposure and lifespan alterations in epigenetic regulators and their correspondence to biomarkers of Alzheimer’s disease. Alzheimers Dement (Amst) 20162123–131 [DOI] [PMC free article] [PubMed] [Google Scholar]
- 30.Masoud AM, Bihaqi SW, Machan JT, Zawia NH, Renehan WE. Early-life exposure to lead (Pb) alters the expression of microRNA that target proteins associated with Alzheimer’s disease. J Alzheimers Dis 2016511257–1264 [DOI] [PubMed] [Google Scholar]
- 31.Weisskopf MG, Wright RO, Schwartz J, et al. Cumulative lead exposure and prospective change in cognition among elderly men: the VA Normative Aging Study. Am J Epidemiol 20041601184–1193 [DOI] [PubMed] [Google Scholar]
- 32.Weisskopf MG, Proctor SP, Wright RO, et al. Cumulative lead exposure and cognitive performance among elderly men. Epidemiology 20071859–66 [DOI] [PubMed] [Google Scholar]
- 33.Power MC, Korrick S, Tchetgen Tchetgen EJ, et al. Lead exposure and rate of change in cognitive function in older women. Environ Res 201412969–75 [DOI] [PMC free article] [PubMed] [Google Scholar]
- 34.Weuve J, Korrick SA, Weisskopf MG, et al. Cumulative exposure to lead in relation to cognitive function in older women. Environ Health Perspect 2009117574–580 [DOI] [PMC free article] [PubMed] [Google Scholar]
- 35.Bandeen-Roche K, Glass TA, Bolla KI, Todd AC, Schwartz BS. Cumulative lead dose and cognitive function in older adults. Epidemiology 200920831–839 [DOI] [PMC free article] [PubMed] [Google Scholar]
- 36.White RF, Diamond R, Proctor S, Morey C, Hu H. Residual cognitive deficits 50 years after lead poisoning during childhood. Br J Ind Med 199350613–622 [DOI] [PMC free article] [PubMed] [Google Scholar]
- 37.Searle AK, Baghurst PA, van Hooff M, et al. Tracing the long-term legacy of childhood lead exposure: a review of three decades of the port Pirie cohort study. Neurotoxicology 20144346–56 [DOI] [PubMed] [Google Scholar]
- 38.van Wijngaarden E, Campbell JR, Cory-Slechta DA. Bone lead levels are associated with measures of memory impairment in older adults. Neurotoxicology 200930572–580 [DOI] [PMC free article] [PubMed] [Google Scholar]
- 39.Shih RA, Glass TA, Bandeen-Roche K, et al. Environmental lead exposure and cognitive function in community-dwelling older adults. Neurology 2006671556–1562 [DOI] [PubMed] [Google Scholar]
- 40.van Wijngaarden E, Winters PC, Cory-Slechta DA. Blood lead levels in relation to cognitive function in older U.S. adults. Neurotoxicology 201132110–115 [DOI] [PubMed] [Google Scholar]
- 41.Kukull WA, Brenner DE, Speck CE, et al. Causes of death associated with Alzheimer disease: variation by level of cognitive impairment before death. J Am Geriatr Soc 199442723–726 [DOI] [PubMed] [Google Scholar]
- 42.Gambassi G, Landi F, Lapane KL, Sgadari A, Mor V, Bernabei R. Predictors of mortality in patients with Alzheimer’s disease living in nursing homes. J Neurol Neurosurg Psychiatry 19996759–65 [DOI] [PMC free article] [PubMed] [Google Scholar]
- 43.Todd S, Barr S, Passmore AP. Cause of death in Alzheimer’s disease: a cohort study. QJM 2013106747–753 [DOI] [PubMed] [Google Scholar]
- 44.Schoepf D, Heun R. Co-morbidity and mortality in Alzheimer’s disease. Eur Psychiatry 20153024 [Google Scholar]
- 45.Lustberg M, Silbergeld E. Blood lead levels and mortality. Arch Intern Med 20021622443–2449 [DOI] [PubMed] [Google Scholar]
- 46.Hernán MA, Hernández-Díaz S, Werler MM, Mitchell AA. Causal knowledge as a prerequisite for confounding evaluation: an application to birth defects epidemiology. Am J Epidemiol 2002155176–184 [DOI] [PubMed] [Google Scholar]
- 47.Clair C, Bitton A, Meigs JB, Rigotti NA. Relationships of cotinine and self-reported cigarette smoking with hemoglobin A1c in the U.S.: results from the National Health and Nutrition Examination Survey, 1999-2008. Diabetes Care 2011342250–2255 [DOI] [PMC free article] [PubMed] [Google Scholar]
- 48.Wright RO, Tsaih SW, Schwartz J, et al. Lead exposure biomarkers and mini-mental status exam scores in older men. Epidemiology 200314713–718 [DOI] [PubMed] [Google Scholar]
- 49.Payton M, Riggs KM, Spiro A, III, Weiss ST, Hu H. Relations of bone and blood lead to cognitive function: the VA Normative Aging Study. Neurotoxicol Teratol 19982019–27 [DOI] [PubMed] [Google Scholar]
- 50.Grashow R, Spiro A, Taylor KM, et al. Cumulative lead exposure in community-dwelling adults and fine motor function: comparing standard and novel tasks in the VA normative aging study. Neurotoxicology 201335154–161 [DOI] [PMC free article] [PubMed] [Google Scholar]
- 51.Nordberg M, Winblad B, Fratiglioni L, Basun H. Lead concentrations in elderly urban people related to blood pressure and mental performance: results from a population-based study. Am J Ind Med 200038290–294 [DOI] [PubMed] [Google Scholar]
- 52.Mieno MN, Tanaka N, Arai T, et al. Accuracy of death certificates and assessment of factors for misclassification of underlying cause of death. J Epidemiol 201626191–198 [DOI] [PMC free article] [PubMed] [Google Scholar]
- 53.Ganguli M, Dodge HH, Shen C, Pandav RS, DeKosky ST. Alzheimer disease and mortality: a 15-year epidemiological study. Arch Neurol 200562779–784 [DOI] [PubMed] [Google Scholar]
- 54.Menke A, Muntner P, Batuman V, Silbergeld EK, Guallar E. Blood lead below 0.48 micromol/L (10 microg/dL) and mortality among US adults. Circulation 20061141388–1394 [DOI] [PubMed] [Google Scholar]
- 55.Hu H, Payton M, Korrick S, et al. Determinants of bone and blood lead levels among community-exposed middle-aged to elderly men. The normative aging study. Am J Epidemiol 1996144749–759 [DOI] [PubMed] [Google Scholar]
- 56.Rabinowitz MB. Toxicokinetics of bone lead. Environ Health Perspect 19919133–37 [DOI] [PMC free article] [PubMed] [Google Scholar]
- 57.Schober SE, Mirel LB, Graubard BI, Brody DJ, Flegal KM. Blood lead levels and death from all causes, cardiovascular disease, and cancer: results from the NHANES III mortality study. Environ Health Perspect 20061141538–1541 [DOI] [PMC free article] [PubMed] [Google Scholar]
- 58.Tanner CM, Goldman SM, Ross GW, Grate SJ. The disease intersection of susceptibility and exposure: chemical exposures and neurodegenerative disease risk. Alzheimers Dement 2014103 supplS213–S225 [DOI] [PubMed] [Google Scholar]
- 59.Wu J, Basha MR, Brock B, et al. Alzheimer’s disease (AD)-like pathology in aged monkeys after infantile exposure to environmental metal lead (Pb): evidence for a developmental origin and environmental link for AD. J Neurosci 2008283–9 [DOI] [PMC free article] [PubMed] [Google Scholar]
- 60.Bihaqi SW, Huang H, Wu J, Zawia NH. Infant exposure to lead (Pb) and epigenetic modifications in the aging primate brain: implications for Alzheimer’s disease. J Alzheimers Dis 201127819–833 [DOI] [PubMed] [Google Scholar]
- 61.Bihaqi SW, Zawia NH. Alzheimer’s disease biomarkers and epigenetic intermediates following exposure to Pb in vitro. Curr Alzheimer Res 20129555–562 [DOI] [PubMed] [Google Scholar]
- 62.Bihaqi SW, Zawia NH. Enhanced taupathy and AD-like pathology in aged primate brains decades after infantile exposure to lead (Pb). Neurotoxicology 20133995–101 [DOI] [PMC free article] [PubMed] [Google Scholar]
- 63.Korrick SA, Schwartz J, Tsaih SW, et al. Correlates of bone and blood lead levels among middle-aged and elderly women. Am J Epidemiol 2002156335–343 [DOI] [PubMed] [Google Scholar]
- 64.Hernández-Avila M, Smith D, Meneses F, Sanin LH, Hu H. The influence of bone and blood lead on plasma lead levels in environmentally exposed adults. Environ Health Perspect 1998106473–477 [DOI] [PMC free article] [PubMed] [Google Scholar]
- 65.Lesko CR, Lau B. Bias due to confounders for the exposure-competing risk relationship. Epidemiology 20172820–27 [DOI] [PMC free article] [PubMed] [Google Scholar]