

Abstract
Background:
Though many patients with chronic rhinosinusitis (CRS) describe disturbances in smell and taste, there have been no studies specifically assessing taste impairment in CRS. This study sought to objectively assess taste dysfunction in CRS patients and determine whether taste impairment correlates with olfactory dysfunction. Additionally, this investigation sought to determine the impact of taste dysfunction on quality of life (QOL) in CRS and identify the clinical factors that influence taste.
Methods:
Sixty-eight CRS patients were prospectively enrolled and completed several quality of life (QOL) surveys in relation to taste, smell, overall sinus-specific QOL and depression. Validated taste strips were used to determine gustatory dysfunction pertaining to sweet, sour, salty and bitter. Olfactory testing was assessed using the Sniffin’ Sticks Test while both Lund-Kennedy and Olfactory Cleft Endoscopy Scoring (OCES) systems were used for endoscopic evaluation.
Results:
The overall prevalence of dysguesia was 28%, with scores significantly lower for sour compared to other subgroups. No correlation was observed between taste scores and objective olfactory metrics including olfaction tests and OCES. Taste scores were better in younger patients (r=0.28, p=0.02), female patients (p=0.004) and never smokers compared to former smokers (p=0.01). Taste scores did not correlate with patient reported outcome measures or CRS disease severity metrics.
Conclusions:
Taste dysfunction is a common complaint in CRS. This cohort shows prevalence of gustatory loss to be about 28 percent using ideal normative values. This dysfunction correlated with male gender, smoking history and older age. Taste dysfunction did not correlate with measured olfactory outcomes.
Keywords: chronic rhinosinusitis, taste, quality of life, olfaction disorders, taste perception
Introduction:
Many patients with chronic rhinosinusitis (CRS) describe problems tasting food and drink resulting in a significant impact upon quality of life (QOL), however the precise contribution of olfaction, taste and trigeminal dysfunction in CRS have not been clearly delineated. While olfactory dysfunction (OD) is a cardinal symptom of CRS and is known to affect up to 83% of patients1, its relationship to taste dysfunction has not been studied thoroughly. In a recent study, the Questionnaire of Olfactory Disorders (QOD-NS) questions were divided into four distinct domains: social, eating, anxiety and annoyance. The eating domain of the QOD-NS was particularly impacted in CRS.2 In addition to their role in eating, the senses of smell and taste are also critical in everyday life as they warn of hazardous substances and act as a gatekeeper to guide ingestion of foods.
Olfaction and taste are separate chemosenses with different anatomic localization, receptors and innervation; however, most people have difficulty differentiating the two in everyday life. While the olfactory system identifies odorants, the gustatory system recognizes the five basic modalities: sweet, sour, salty, bitter and umami. The olfactory pathway originates in the olfactory mucosa where electrical impulses generated by binding of odorant molecules to olfactory receptor proteins are transmitted via the olfactory nerve to the olfactory bulb and then ultimately the olfactory cortex and orbitofrontal cortex. The gustatory pathway begins with detection of taste by taste buds located on the tongue. Generated electrical signals are then transmitted by the chorda tympani, glossopharyngeal and vagus nerves to the nucleus solitarius, thalamus and finally the gustatory cortex in the frontal lobe.3 The confusion between the two senses is partly due to their intimate interaction. The term “taste” is often used in reference to flavor, which arises from the integration of gustatory, somatosensory and olfactory fibers.4
To our knowledge, there have been no specific studies assessing taste impairment in CRS, and we therefore sought to perform a prospective, cross-sectional study exploring taste dysfunction in CRS. The goals of this study are to: 1) assess objective taste function in a cohort of patients with CRS; 2) determine whether taste dysfunction correlates with olfactory testing; 3) investigate the influence of demographics and comorbidities on taste dysfunction in CRS; and 4) determine the impact of taste dysfunction upon QOL in CRS.
Methods:
Recruitment and study population:
Adults 18 years of age or older with CRS were enrolled from the Rhinology clinics of the Medical University of South Carolina (MUSC) in a prospective, cross-sectional fashion. All patients fulfilled diagnostic criteria for CRS according to the Clinical Practice Guideline of the American Academy of Otolaryngology–Head and Neck Surgery and the European Position Paper on Rhinosinusitis and Nasal Polyps (EPOS2012).5,6 Exclusion criteria included pregnancy, sinus surgery within the last 3 months, and neurologic conditions e.g. Parkinson’s disease, Multiple Sclerosis and Alzheimer’s disease. The study was approved by the MUSC institutional review board, and a written informed consent was obtained from all participants.
CRS disease severity:
Nasal endoscopy and patient-reported outcome measures were used to classify sinus disease severity. Sino-nasal endoscopy was performed and scored using the Lund-Kennedy and Olfactory Cleft Endoscopy Scoring (OCES)7 systems by treating physicians who were blinded to the patient’s data. The degree of discharge, edema, polyps and crusting scored from 0–2 for each olfactory cleft on the OCES. Results from each cleft were added to give a total score between 0 −20. Patients were also classified as having CRS with nasal polyps (CRSwNP) or CRS without nasal polyps (CRSsNP) based on nasal endoscopy. Participants rated their sinus-specific QOL using the 22-item Sino-Nasal Outcome Test (SNOT-22).8 The SNOT-22 contains 22 questions each scored 0–5 (total score range 0–110), with higher scores representing worse QOL. Patients also completed a patient health questionnaire-2(PHQ-2), which is a brief validated tool to screen for depression.9
Taste measures:
Taste testing was performed using validated taste strips as described by Mueller and colleagues (“Taste Strips”, Burghart, Wedel, Germany).10 Sixteen strips impregnated with four different concentrations of four tastants: sweet, sour, salty and bitter were assessed. Two blank strips were used to serve as controls. The following concentrations were used: sweet: 0.4, 0.2, 0.1, 0.05 g/ml sucrose; sour: 0.3, 0.165, 0.09, 0.05 g/ml citric acid; salty: 0.25, 0.1, 0.04, 0.016 g/ml sodium chloride; bitter: 0.006, 0.0024, 0.0009, 0.0004 g/ml quinine hydrochloride. Testing was performed from the lowest to highest concentrations in a pseudorandom fashion. The taste strips were placed in the anterior mid-tongue, and patients were allowed to close their mouth and move the strip around. Patients identified the tastes in a forced choice paradigm. Scores for each subgroup ranged from 0–4 with lower scores indicating worse performance, and these were added to give the total taste score. Gustatory dysfunction was determined using ideal cut-offs previously reported by Mueller et al. based on a <= 10th percentile each of the four taste groups.10 A score of less than or equal to 2 was considered hypogeusia for the sweet, sour and salty taste subgroups and less than or equal to 1 for the bitter subgroup. An overall score of less than or equal to 9 was considered hypogeusia.10
Perceived chemosensory dysfunction was assessed using the Chemosensory Complaint Score questionnaire (CCS).11 This survey consists of questions pertaining to taste and smell. The taste section consists of 8 questions addressing change in sense of taste, change in the way food tastes, presence and quality of a bad taste in mouth, effect of medications upon sense of taste and changes in quality of each taste subgroup (salt, sweet, sour, bitter). Any abnormality in those 8 questions is given one point. A ninth question asks for a rating of overall severity of taste abnormalities with one point given for mild or moderate dysfunction and two points for severe or incapacitating dysfunction. This results in a total taste score ranging from 0 (no taste complaints) to 10 (many/severe taste complaints). The smell section consists of four questions addressing change in sense of smell, change in the way food smells, effect of medication upon sense of smell and change in strength of odors. Each abnormality is given one point. A fifth question asks for an overall rating of severity of smell abnormality and is given one point for mild or moderate dysfunction and two points for severe dysfunction. This results in a total smell score ranging from 0 (no complaints) to 6 (many complaints). Both taste and smell scores were added to give the total chemosensory complaint score ranging from 0 to 16.
Olfactory measures:
Olfactory testing was performed using the Sniffin’ Sticks test (Burghart Instruments, Wedel, Germany). The test battery included odor threshold, odor discrimination, and odor identification. The threshold test was performed using dilution of n-butanol in a single-staircase, triple-forced choice procedure and scored from 1–16. In the discrimination test, subjects were asked to identify the different odor after randomly being presented with 16 sets of triplet pens with two containing the same odorant. This was scored from 0 to 16. The identification test used a multiple-choice procedure where sixteen odorants were presented at supra-threshold intensity. A “composite threshold-discrimination” (TDI) score, which ranged from 1 to 48, was then obtained by summing up all three scores. Olfactory specific quality of life was assessed using the previously validated, short, modified version of the Questionnaire of olfactory disorders (QOD-NS).12 This instrument consists of 17 negative statements graded from 0 to 3 for maximum score of 51 (higher scores reflected worse QOL).
Statistical Analysis
Data analysis was performed using SPSS 23.0 (IBM Corporation, Armonk, NY, USA). Descriptive statistics (means, standard deviations, percentages) were used to assess demographic information, comorbidities, and chemosensory metrics. Independent t-tests were used to assess differences in taste function across demographic and comorbidity groups. Chi square and Fisher’s exact tests were used to compare categorical data. Multi-variable regression was performed utilizing the forward selection stepwise procedure to assess the combined effects of age, gender, and smoking status on taste. The Pearson correlation was used to characterize the associations between taste and continuous variables. For all assessments, p values of ≤0.05 were considered statistically significant. Given the relatively small dataset and exploratory nature of this study, multiple comparison corrections were not pursued in this analysis.
Results:
Study cohort and demographics
The study cohort consisted of 68 patients with an average age of 52.0 years. The majority were male (55.9%) and white (75.0%). Patients with CRSsNP accounted for 42.6% and CRSwNP 57.4%. Asthma and allergic rhinitis were present in 42.7% and 60.3% of the cohort respectively. Only 3 participants (4.4%) were current smokers; 22.1% were former smokers and 73.5% were never smokers. Baseline characteristics are listed in Table 1.
Table 1.
Baseline characteristics (N = 68)
| Mean ± SD (range) | N (%) | ||
|---|---|---|---|
| Demographics | |||
| Age, mean ± SD (years) | 52.0 ± 16.7 (20 – 77) | ||
| Gender | Male | 38 (55.9) | |
| Female | 30 (44.1) | ||
| Race | African American | 17 (25.0) | |
| White | 51 (75.0) | ||
| Ethnicity | Hispanic | 4 (5.9) | |
| Non-Hispanic | 64 (94.1) | ||
| Comorbid conditions | |||
| Diagnosis | CRSsNP | 29 (42.6) | |
| CRSwNP | 39 (57.4) | ||
| Asthma | 29 (42.7) | ||
| Allergies (Testing confirmed) | 41 (60.3) | ||
| AERD | 7 (10.3) | ||
| COPD | 1 (1.5) | ||
| GERD | 24 (35.3) | ||
| Diabetes | 6 (8.8) | ||
| Depression | 19 (27.9) | ||
| OSA | 16 (23.5) | ||
| Smoking history | Never Smoker | 50 (73.5) | |
| Former Smoker | 15 (22.1) | ||
| Current Smoker | 3 (4.4) | ||
| CRS Disease Severity | |||
| Lund Kennedy Endoscopy Score | 5.3 ± 3.8 | ||
| Olfactory Cleft Endoscopy Score | 3.9 ± 4.0 | ||
| SNOT-22 Score | 39.5 ± 24.8 | ||
AERD = aspirin exacerbated respiratory disease; CRSsNP = chronic rhinosinusitis without sinusitis; CRSwNP = chronic rhinosinusitis with sinusitis; GERD = gastroesophageal reflux disease; OSA = Obstructive Sleep Apnea; SD = standard deviation; SNOT-22 = 22-item Sino-Nasal Outcome Test.
Prevalence of Taste Dysfunction:
Taste scores ranged from 2 to 16 with a mean score of 10.4 (SD=2.7). Using previously published cut-offs for taste strips, the overall prevalence of dysgeusia in our cohort was 27.9%. When examining mean taste scores within each taste subgroup, scores were significantly lower for the sour taste compared to the sweet, salty and bitter subgroups (p= <0.001, 0.001, and 0.02 respectively; Table 2).
Table 2.
Taste strip results (N=68)
| Overall prevalence of dysgeusia | ||||
|---|---|---|---|---|
| N | Percent | |||
| Cohort | Normogeusia | 49 | 72.1 | |
| Dysgeusia | 19 | 27.9 | ||
| Prevalence of taste dysfunction in each taste subgroup | ||||
| Taste Subgroup | Mean (SD) | Percent Dysgeusia** | ||
| Sweet | 2.9 ± 0.9 | 8.8 | ||
| Sour | 2.1 ± 0.8* | 16.2 | ||
| Salty | 2.7 ± 1.1 | 11.8 | ||
| Bitter | 2.7 ± 1.3 | 11.8 | ||
CRSsNP = chronic rhinosinusitis without sinusitis; CRSwNP = chronic rhinosinusitis with sinusitis; SD = standard deviation
Sour subgroup mean statistically different than sweet, salty, and bitter
Proportions of dysguesia not statistically different
Taste function and objective olfactory metrics:
No correlation was found between taste strip scores and total TDI scores (r=0.150, p=0.22; Figure 1). Similarly, no correlation was found between taste and individual threshold, discrimination or identification scores (Figures 2a–c). There was also no association between TDI and any of the taste subgroups (sweet: r=−0.07, p=0.56; sour: r=0.17, p=0.16; salty: r=0.10, p=0.41; bitter: r=0.17, p=0.16). Taste did not correlate with the total Olfactory Cleft Endoscopy Score (r=0.07, p=0.60).
Figure 1.

Total TDI scores versus total taste scores
Figure 2a–c.
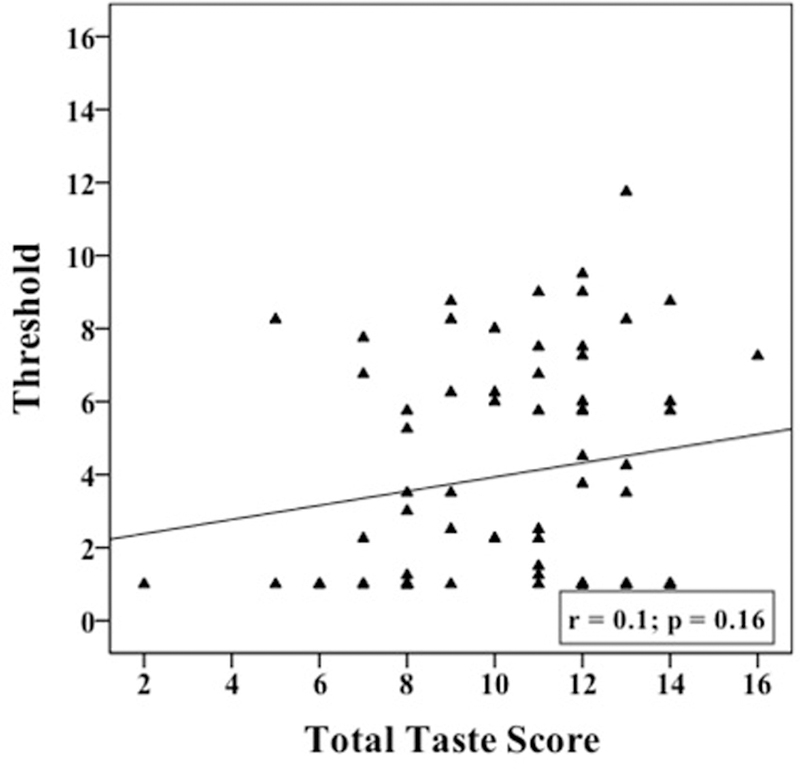

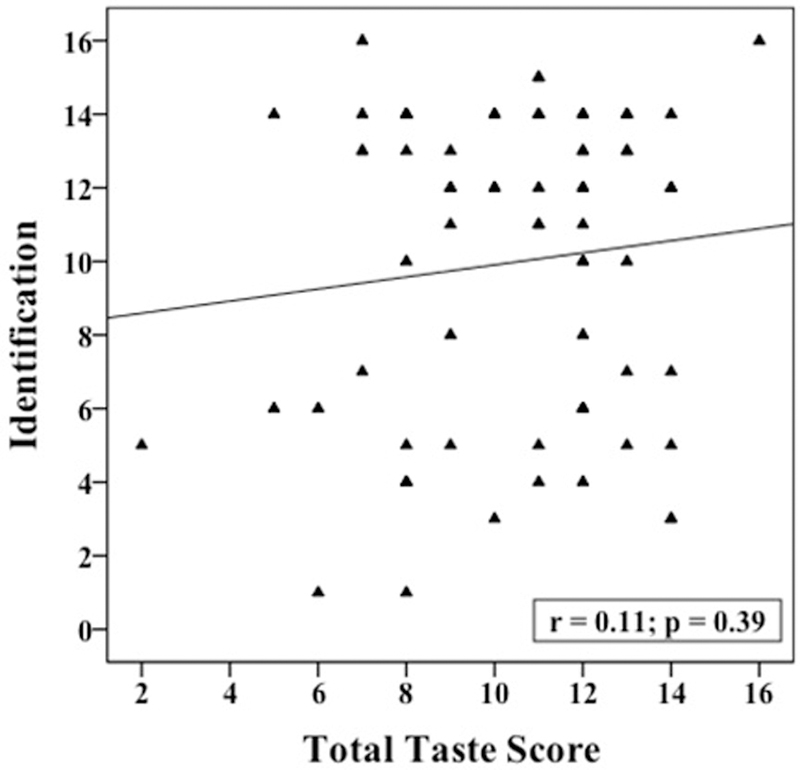
Individual Threshold, Discrimination, and Identification scores verusus Total Taste Scores
Taste and demographics, comorbidities and disease severity metrics
Bivariate analysis was used to explore the relationship between taste and demographic, comorbidity, and disease severity factors (Table 3). Taste scores were better in younger patients (r=−0.28; p=0.02) and in female patients (9.8 ± 2.8 vs 11.2 ± 2.5; p=0.04). There was no association between taste scores and most demographic/comorbidity factors, including race, allergic rhinitis, asthma, diabetes or depression. The exception was an association between taste and smoking history, with never smokers having a better taste score than former smokers (p=0.01). Taste did not correlate with pack-year smoking history (r = −0.14; p = 0.27). Taste was not associated with any of the CRS disease severity metrics, including polyp status, previous sinus surgery, Lund-Kennedy score, or the total OCES.
Table 3.
Comparison of total taste scores across demographics, comorbidity, and disease characteristics (N=68)
| Present (Mean ± SD) | Absent (Mean ± SD) | P | |
|---|---|---|---|
| Demographics | |||
| Male | 9.8 ± 2.8 | 11.2 ± 2.5 | 0.04 |
| White | 10.5 ± 2.6 | 10.1 ± 3.1 | 0.63 |
| Comorbid Conditions | |||
| Asthma | 10.3 ± 2.5 | 10.5 ± 2.9 | 0.82 |
| Allergies (Testing confirmed) | 10.2 ± 2.6 | 10.6 ± 3.0 | 0.57 |
| AERD | 11.6 ± 2.3 | 10.3 ± 2.8 | 0.23 |
| GERD | 10.5 ± 2.8 | 10.3 ± 2.7 | 0.82 |
| Diabetes | 11.0 ± 2.4 | 10.3 ± 2.8 | 0.57 |
| Depression | 10.1 ± 2.5 | 10.5 ± 2.8 | 0.52 |
| OSA | 9.7 ± 2.7 | 10.6 ± 2.7 | 0.24 |
| Former Smoker | 8.9 ± 3.2 | 10.8 ± 2.5 | 0.01 |
| Disease Characteristics | |||
| Nasal Polyposis | 10.4 ± 2.9 | 10.3 ± 2.6 | 0.89 |
| Prior Sinus Surgery | 10.5 ± 2.7 | 10.0 ± 3.0 | 0.64 |
| Age and CRS Severity Measures | |||
| r(p) | |||
| Age | −0.28 | (0.02) | |
| Lund-Kennedy Endoscopy Score | 0.09 | (0.45) | |
| Olfactory Cleft Endoscopy Score | 0.07 | (0.60) | |
Bold values are significant.
AERD = aspirin exacerbated respiratory disease; CRSsNP = chronic rhinosinusitis without sinusitis; CRSwNP = chronic rhinosinusitis with sinusitis; GERD = gastroesophageal reflux disease; OSA = Obstructive Sleep Apnea; SD = standard deviation; SNOT-22 = 22-item Sino-Nasal Outcome Test.
Given that overall taste scores correlated with age, gender and smoking status, we then examined the impact of those factors upon individual taste subgroups. While the correlation with age was driven primarily by the sour taste and to a lesser extent, the salty taste, gender specific variations in taste scores were driven by improved sweet scores in females (Table 4). Smoking status appeared to impact the bitter taste subgroup, as never smokers had higher scores than former smokers in all taste subgroups; however, this achieved significance only in the bitter tastes (Table 4).
Table 4.
Relationship of taste subgroup scores to gender (N=68), smoking history (N=65) and age (N =68)
| Gender | Mean ± SD | P | Smoking history | Mean ± SD | P | Correlation with Age r(p) | |
|---|---|---|---|---|---|---|---|
| Sweet | Male | 2.7 ± 1.0 | 0.02 | Never Smoker | 3.0 ± 0.7 | 0.41 | −0.06 (0.58) |
| Female | 3.2 ± 0.6 | Former Smoker | 2.7 ± 1.3 | ||||
| Sour | Male | 2.1 ± 0.8 | 0.87 | Never Smoker | 2.2 ± 0.7 | 0.15 | −0.24 (0.05) |
| Female | 2.1 ± 0.7 | Former Smoker | 1.9 ± 0.9 | ||||
| Salty | Male | 2.5 ± 1.1 | 0.10 | Never Smoker | 2.8 ± 1.1 | 0.15 | −0.23 (0.06) |
| Female | 3.0 ± 1.0 | Former Smoker | 2.3 ±1.1 | ||||
| Bitter | Male | 2.4 ± 1.4 | 0.14 | Never | 2.9 ±1.3 | 0.04 | −0.20 (0.10) |
| Female | 2.9 ± 1.2 | Former Smoker | 2.1 ±1.3 | ||||
| Total Taste Score | Male | 9.8 ± 2.8 | 0.04 | Never Smoker | 10.8 ± 2.5 | 0.02 | −0.28 (0.02) |
| Female | 11.2 ± 2.5 | Former Smoker | 8.9 ± 3.7 |
Bold values are significant.
SD = standard deviation
Multivariate regression was performed to separate the impact of age, gender and smoking history. Only gender and smoking history were found to be independent predictors. After adjusting for gender, never smokers had an average of 1.9-point higher taste score than former smokers. Females had an average of 1.4-point higher taste score than males after adjusting for smoking history.
Taste scores and patient reported outcome measures:
Taste scores did not correlate with the QOD-NS total, QOD-NS Eating domain, total CCS score, CCS taste score, total SNOT-22 score, smell/taste question on the SNOT-22 or PHQ-9 (Table 5). Patient-reported dysfunction for specific tastes was associated with objective taste subgroup scores only in the bitter category (p=0.04; Table 5).
Table 5.
Taste scores and patient reported outcome measures
| Correlation coefficients of taste scores and patient outcomes | ||||
|---|---|---|---|---|
| r(p) | ||||
| QOD NS Total | −0.03 (p=0.81) | |||
| QOD Eating Domain | 0.02 (p =0.88) | |||
| SNOT-22 Total | 0.12 (p=.33) | |||
| SNOT-22 Smell/Taste Question | 0.001 (0.99) | |||
| PHQ-9 Total | 0.04 (p =0.73) | |||
| CCS Taste Score | −0.08(p = 0.49) | |||
| CCS Smell Score | −0.03 (p =0.81) | |||
| Total CCS Score | −0.07(p = 0.58) | |||
| Objective Taste Scores and their corresponding CCS statements | ||||
| Abnormal Sensitivity to Corresponding Taste Question on CCS | Mean ± SD | P | ||
| Bitter | No | 2.8 ± 1.2 | 0.04 | |
| Yes | 2.1 ± 1.6 | |||
| Salty | No | 2.7 ±1.2 | 0.75 | |
| Yes | 2.8 ± 0.9 | |||
| Sour | No | 2.2 ± 0.7 | 0.16 | |
| Yes | 1.8 ± 0.8 | |||
| Sweet | No | 2.8 ± 0.9 | 0.24 | |
| Yes | 3.1 ± 0.8 | |||
| CCS Overall Taste Score | No | 10.3 ± 2.9 | 0.74 | |
| Yes | 10.5 ± 2.6 | |||
Bold values are significant.
QOD = Questionnaire for Olfactory Disorders; NS = negative statements; QOD Eating Domain == Questionnaire for Olfactory Disorders Eating Domain; CCS = Chemosensory Complaint Score; PHQ-9 = Patient Health Questionnaire-9; SD = standard deviation
Discussion:
Many patients with CRS will report trouble with both smell and taste. However, in many instances it is unclear whether this subjective complaint is entirely related to abnormal olfaction or whether gustatory function is also impaired. In this study, taste function was specifically tested and 28% of CRS patients had dysgeusia based on previously published cutoffs.10 Previous studies have shown the prevalence of objective taste loss in the general population ranges from 5 to 20%, depending upon the population being studied and the method of testing utilized.13,14 Our data suggest that taste loss may be higher in CRS; however, to definitively answer the question, a larger epidemiologic study with a matched control group would be required.
Though prior studies have demonstrated an association between decreased smell and taste function, these studies were not completed in exclusively CRS patients.15,16 Furthermore, an experiment embedded within these reports, that may serve as a surrogate for CRS, revealed that while olfactory function could be substantially reduced by olfactory cleft obstruction, there was no influence on taste function in the setting of olfactory cleft blockage.16 Given the distinctly different taste and smell pathways, the lack of correlation between taste scores and objective olfaction as measured by total TDI and individual threshold, discrimination and identification scores was not completely surprising. In fact, one might expect the prevalence of gustatory dysfunction in CRS to be similar to that of the general population, considering the disease is typically localized to the sinonasal cavity. In this study, there was no association between gustatory loss and any CRS disease severity metric, including SNOT-22 score, number of prior surgeries or endoscopy score. The lack of correlation between olfactory loss and gustatory loss further argues that taste loss may not be directly related to CRS pathophysiology. However, this study is not designed to mechanistically study why patients had taste loss and thus the question of causality remains speculative.
We examined a number of demographic and comorbidity factors that might potentially impact gustatory function in CRS patients. We found that increasing age, male gender and former smoking status are associated with taste dysfunction. Other studies with lower rates of taste loss examined younger patient populations or higher proportions of females14, thus it is difficult to make direct comparisons to published normative studies without controlling for these factors. Similar to other studies, we found the lowest scores in the sour taste subgroup with a 16.2% rate of dysfunction compared to the best scores in the sweet group where only 8.8% of patients had dysfunction.14,17,18 Another factor that makes it difficult to compare with published norms is differences in methodology utilized across studies, with variation in use of taste sprays and taste strips. In Vennemann’s study, only taste strips with the highest concentration for each subgroup were tested.13 The prevalence of taste impairment in their study was 20%; however, they defined dysgeusia as failure to identify one strip, i.e. score of ≤ 3. Given these issues, it remains unclear whether the underlying cause for gustatory dysfunction is related to CRS, variations in testing methods, or simply related to demographics and comorbidities reflected in our CRS population.
Contrary to findings in Vennemann et al.’s study13, former smoking history correlated with taste dysfunction in our CRS cohort. There was no correlation between taste and pack-year smoking history. In multivariate modeling, age dropped out, but this may be attributed to lack of power. Gender and smoking history remained predictive. The average taste score was 1.9 points higher in the never smokers after adjusting for gender, and 1.4 points higher in females after adjusting for smoking history. When comparing smoking history (never smokers vs. former smokers), a significant difference in the mean taste scores was observed only in the bitter subgroup.
This study showed no correlation between taste loss and any of the patient-reported outcomes measured, including the SNOT-22, QOD-NS, or the QOD-NS eating domain. However, most of the questions on the patient outcome questionnaires used, including the QOD-NS eating domain, assess impacts of smell loss on QOL, and not taste loss specifically. None of the available QOL surveys actually assessed the impact of taste loss in a discrete fashion. We utilized CCS as the best available approximation of a patient-reported taste metric. The bitter subgroup did correlate with perceived taste impairment in the CCS questionnaire; as such, bitter taste-specific questions could be a better gauge for a true gustatory dysfunction. However, the overall taste score correlation with CCS taste impairment was poor. This may be a reflection of the weaknesses of this instrument in regard to the questions not covering the full scope of taste dysfunction as well as the scoring not taking into account the varying degrees of disability (e.g. a rating of “mild” was given the same score as “moderate”). Taste loss could have specific, perhaps subtle, impacts not assessed in this study, such as food preferences, decreased nutrition, and decrease in energy with aging.19 A taste-specific survey should be designed to assess the full spectrum of potential effects of taste dysfunction.
The strengths of this study include a prospective cross-sectional design where collection and recording of all subjective and objective data was performed simultaneously, allowing comprehensive evaluation of the gustatory and olfactory function in the study cohort. Limitations included the sample size, which may have impacted our ability to detect small differences in the subgroups such as comparing prevalence of loss in CRSsNP to CRSwNP, and enrollment from a tertiary center with greater disease burden. While this study serves as a starting point for evaluating gustatory dysfunction in CRS patients, future studies should aim to investigate beyond CRS phenotypes and instead asses the influence of CRS endotypes to better understand the pathophysiologic mechanisms of gustatory dysfunction at a molecular level. Future enrollment of a control population matched for age, gender, and smoking status may also help determine if prevalence of gustatory loss is truly higher than the general population. Lastly, this study incompletely evaluates the potential impact of gustatory loss above and beyond olfactory loss. In order to fully understand potential impacts, one would need to utilize taste-specific QOL questionnaires, as well as explore impacts on food choices, overall diet, and weight. This would require development of taste-specific assessments which do not currently exist for this patient population.
Conclusion:
Taste dysfunction is a common complaint in CRS. Our data shows prevalence of gustatory loss to be about 28 percent using ideal normative values. This dysfunction correlated with male gender, smoking history and to a lesser extent older age. Taste dysfunction did not correlate with any of the olfactory outcomes measured. The bitter subgroup was significantly impacted by smoking, and was the only subgroup where objective score significantly correlated with perceived dysfunction.
Acknowledgments
Funding: This work was supported by a grant from the National Institute on Deafness and Other Communication Disorders (NIDCD), one of the National Institutes of Health, Bethesda, MD (3R01 DC005805). Public clinical trial registration (www.clinicaltrials.gov) ID# NCT02720653.
Footnotes
Conflict of Interest: ZMS is a consultant for Olympus and 480 Biomedical as well as on the advisory board for Regeneron. RJS is consultant for Olympus and Arrinex and has received grant support from Entellus and Intersect.
References:
- 1.Litvack JR, Mace JC, Smith TL. Olfactory function and disease severity in chronic rhinosinusitis. Am J Rhinol Allergy 2009; 23:139–144. [DOI] [PMC free article] [PubMed] [Google Scholar]
- 2.Mattos JL, Schlosser RJ, DeConde AS. Factor Analysis of the Questionnaire of Olfactory Disorders in Patients with Chronic Rhinosinusitis In press. [DOI] [PMC free article] [PubMed]
- 3.Small DM, Green BG. A Proposed Model of a Flavor Modality. In: Murray MM, Wallace MT, eds. The Neural Bases of Multisensory Processes Boca Raton (FL), 2012. [PubMed] [Google Scholar]
- 4.Small DM, Prescott J. Odor/taste integration and the perception of flavor. Exp Brain Res 2005; 166:345–357. [DOI] [PubMed] [Google Scholar]
- 5.Fokkens WJ, Lund VJ, Mullol Jet al. EPOS 2012: European position paper on rhinosinusitis and nasal polyps 2012. A summary for otorhinolaryngologists. Rhinology 2012; 50:1–12. [DOI] [PubMed] [Google Scholar]
- 6.Rosenfeld RM, Piccirillo JF, Chandrasekhar SSet al. Clinical practice guideline (update): adult sinusitis. Otolaryngology--head and neck surgery : official journal of American Academy of Otolaryngology-Head and Neck Surgery 2015; 152:S1–S39. [DOI] [PubMed] [Google Scholar]
- 7.Soler ZM, Hyer JM, Karnezis TT, Schlosser RJ. The Olfactory Cleft Endoscopy Scale correlates with olfactory metrics in patients with chronic rhinosinusitis. International forum of allergy & rhinology 2016; 6:293–298. [DOI] [PMC free article] [PubMed] [Google Scholar]
- 8.Morley AD, Sharp HR. A review of sinonasal outcome scoring systems - which is best? Clinical otolaryngology : official journal of ENT-UK ; official journal of Netherlands Society for Oto-Rhino-Laryngology & Cervico-Facial Surgery 2006; 31:103–109. [DOI] [PubMed] [Google Scholar]
- 9.Kroenke K, Spitzer RL, Williams JB. The Patient Health Questionnaire-2: validity of a two-item depression screener. Med Care 2003; 41:1284–1292. [DOI] [PubMed] [Google Scholar]
- 10.Mueller C, Kallert S, Renner Bet al. Quantitative assessment of gustatory function in a clinical context using impregnated “taste strips”. Rhinology 2003; 41:2–6. [PubMed] [Google Scholar]
- 11.Heald AE, Pieper CF, Schiffman SS. Taste and smell complaints in HIV-infected patients. AIDS (London, England) 1998; 12:1667–1674. [DOI] [PubMed] [Google Scholar]
- 12.Simopoulos E, Katotomichelakis M, Gouveris H, Tripsianis G, Livaditis M, Danielides V. Olfaction-associated quality of life in chronic rhinosinusitis: adaptation and validation of an olfaction-specific questionnaire. The Laryngoscope 2012; 122:1450–1454. [DOI] [PubMed] [Google Scholar]
- 13.Vennemann MM, Hummel T, Berger K. The association between smoking and smell and taste impairment in the general population. J Neurol 2008; 255:1121–1126. [DOI] [PubMed] [Google Scholar]
- 14.Welge-Lussen A, Dorig P, Wolfensberger M, Krone F, Hummel T. A study about the frequency of taste disorders. J Neurol 2011; 258:386–392. [DOI] [PubMed] [Google Scholar]
- 15.Gudziol H, Rahneberg K, Burkert S. [Anosmics are more poorly able to taste than normal persons]. Laryngo- rhino- otologie 2007; 86:640–643. [DOI] [PubMed] [Google Scholar]
- 16.Landis BN, Scheibe M, Weber Cet al. Chemosensory interaction: acquired olfactory impairment is associated with decreased taste function. Journal of neurology 2010; 257:1303–1308. [DOI] [PubMed] [Google Scholar]
- 17.Cruickshanks KJ, Schubert CR, Snyder DJet al. Measuring taste impairment in epidemiologic studies: the Beaver Dam Offspring Study. Ann N Y Acad Sci 2009; 1170:543–552. [DOI] [PMC free article] [PubMed] [Google Scholar]
- 18.Schumm LP, McClintock M, Williams Set al. Assessment of sensory function in the National Social Life, Health, and Aging Project. J Gerontol B Psychol Sci Soc Sci 2009; 64 Suppl 1:i76–85. [DOI] [PMC free article] [PubMed] [Google Scholar]
- 19.Drewnowski A, Shultz JM. Impact of aging on eating behaviors, food choices, nutrition, and health status. J Nutr Health Aging 2001; 5:75–79. [PubMed] [Google Scholar]