

SUMMARY
A complete view of eukaryotic gene regulation requires that we accurately delineate how transcription factors (TFs) and nucleosomes are arranged along linear DNA in a sensitive, unbiased manner. Here we introduce MNase-SSP, a single-stranded sequencing library preparation method for nuclease-digested chromatin that enables simultaneous mapping of TF and nucleosome positions. As a proof of concept, we apply MNase-SSP toward the genome-wide, high-resolution mapping of nucleosome and TF occupancy in murine embryonic stem cells (mESCs). Compared with existing MNase-seq protocols, MNase-SSP markedly enriches for short DNA fragments, enabling detection of binding by subnucleosomal particles and TFs, in addition to nucleosomes. From these same data, we identify multiple, sequence-dependent binding modes of the architectural TF Ctcf and extend this analysis to the TF Nrsf/ Rest. Looking forward, we anticipate that single stranded protocol (SSP) adaptations of any protein-DNA interaction mapping technique (e.g., ChIP-exo and CUT&RUN) will enhance the information content of the resulting data.
Graphical Abstract

In Brief
Ramani et al. describe MNase-SSP, a single-stranded DNA sequencing library preparation method for profiling chromatin structure. MNase-SSP libraries harbor diminished sequence bias and capture shorter DNA fragments compared to traditional MNase-seq libraries. Applying MNase-SSP to murine embryonic stem cells enables simultaneous analysis of nucleosomal, subnucleosomal, and transcription factor-DNA interactions genome-wide.
INTRODUCTION
Gene regulatory programs are defined by the genome-wide distribution of DNA binding proteins and the higher-order complexes they form. Decades of biochemical experiments have proven the utility of cleavage mapping methods for resolving the locations of these protein-DNA interactions. The earliest observations that digestion of chromatin by nucleolytic enzymes releases a pattern of DNA fragments corresponding to chromatin’s subunits (Williamson, 1970; Hewish and Burgoyne, 1973) have culminated in the widespread use of massively parallel sequencing to map protein-DNA contacts genome-wide and at high resolution.
Contemporary methods for mapping protein-DNA interactions vary considerably in their details but follow the same basic paradigm: native or chemically fixed nuclei are permeabilized and exposed to a predefined amount of cleavage agent, after which liberated fragments are purified and used to generate libraries compatible with massively parallel DNA sequencing. Specific methods differ subtly in their execution: DNase sequencing (DNase-seq) (Hesselberth et al., 2009) employs light digestion with DNase I to selectively liberate DNA fragments from open chromatin. Hydroxyl radical-mediated approaches (Tullius, 1988), which include radiation-induced correlated cleavage sequencing (RICC-seq) (Risca et al., 2017), methidiumpropyl-EDTA sequencing (MPE-seq) (Ishii et al., 2015), and chemical cleavage mapping (Brogaard et al., 2012; Voong et al., 2016), employ small molecules or genetic tagging to bombard chromatin with hydroxyl radicals, leading to scission of the phosphate backbone immediately proximal to sites of protein-DNA contact.
Micrococcal nuclease (MNase) sequencing (MNase-seq) assays share many of the characteristics of the preceding assays, but use the endonuclease-exonuclease (endo-exo) MNase. Like DNase, MNase acts first as an endonuclease, nicking DNA preferentially at adenine/thymine (A/T) bases; coordinated nicking of DNA by MNase leads to processive exonucleolytic activity, which continues until the enzyme is blocked by a protein complex bound to DNA (Sulkowski and Laskowski, 1962). Because of the exonucleolytic activity of MNase, both fragment-end positions and the minimally protected fragment are informative. Traditionally, MNase-seq has been used to generate genome-wide maps of the locations of nucleosomes—the basic repeating unit of the chromatin fiber (Gaffney et al., 2012; Valouev et al., 2011; Teif et al., 2012). Subsequent studies have demonstrated the utility of MNase as a reagent for mapping subnucleosomesized protein-DNA interactions, including in vivo interactions between transcription factors (TFs) and DNA (Carone et al., 2014; Henikoff et al., 2011; Ramachandran et al., 2017). MNase has also been used to map the locations of specific TFs and modified histones on fixed and native chromatin (e.g., crosslinking chromatin immunoprecipitation [X-ChIP], occupied regions of genomes from affinity-purified naturally isolated chromatin [ORGANIC], and cleavage under target and release using nuclease [CUT&RUN]) in various contexts (Kasinathan et al., 2014; Skene and Henikoff, 2015, 2017) as an alternative to the chromatin immunoprecipitation (ChIP)-exo methods (Rhee and Pugh, 2011) and ChIP-nexus methods (He et al., 2015).
All previously described methods share an inherent limitation: the protocols used to modify these fragments for massively parallel sequencing contribute technical biases that skew the quantitation of bona fide in vivo protein-DNA interactions. For example, standard nucleolytic digestion product sequencing library protocols for the Illumina platform employ gap filling and end repair by the enzyme T4 DNA polymerase, 3ʹ adenylation by Klenow (exo−), and T4 DNA ligase-mediated adaptor ligation; these enzymatic steps bias libraries toward longer fragments and against shorter fragments that might correspond to the footprints of smaller proteins. Furthermore, the large number of enzymatic steps involved in these protocols necessitates large amounts of input DNA for reliable library preparation to mitigate losses incurred after purifying DNA at each step. Finally, because these steps operate on double-stranded DNA fragments, any biases are symmetric and therefore impossible to decouple from the well-characterized sequence biases of enzymes like DNase and MNase (Dingwall et al., 1981).
We and colleagues previously demonstrated that a single-stranded library preparation protocol intended for sequencing very small quantities of damaged ancient DNA (Gansauge and Meyer, 2013) could be applied to sequence cell-free DNA (cfDNA) derived from patients and that this single-stranded protocol (SSP) led to marked enrichment of short DNA molecules in sequenced libraries (Snyder et al., 2016). Here, we extend this protocol to study murine chromatin digested in vitro by MNase. We demonstrate that this protocol, termed MNase-SSP, (1) strongly enriches for short DNA fragments reflective of specific types of protein-DNA interaction, (2) dramatically reduces sequence biases compared to traditionally prepared MNase-seq libraries, and (3) enables simultaneous mapping of nucleosomal, subnucleosomal, and TF-bound fragments genome-wide. We anticipate that MNase-SSP will be a broadly applicable sequencing library protocol and that SSP can be further adapted to diverse genome-wide protein-DNA interaction mapping techniques.
RESULTS
Single-Stranded Libraries Capture Short Nucleolytic Fragments with Reduced Sequence Bias
Conventional sequencing library construction protocols applied to products of nuclease digestion involve fragment repair steps that seal nicks and polish fragment ends on double-stranded DNA, masking a subset of true nuclease cut sites flanking protein-DNA contacts and biasing sequencing libraries toward longer repaired templates. Following our previous observations that cfDNA preparations made using a single-stranded library protocol captured shorter DNA fragments representing TF-bound genomic sites (Snyder et al., 2016), we applied single-stranded DNA sequencing to in vitro MNase-digested native chromatin, a method we term MNase-SSP. Following isolation and treatment of nuclei with MNase, DNA is purified by phenol-chloroform extraction and subjected to the single-stranded library preparation protocol of Gansauge and Meyer (2013). DNA is melted, ligated at its 3′ terminus to a biotinylated single-stranded adaptor, and immobilized on streptavidin beads. DNA is then made double stranded through second-strand synthesis, ligated to a double-stranded adaptor, and amplified for Illumina sequencing (Figure 1A).
Figure 1. MNase-SSP Is a Novel Library Preparation for Nucleolytic Digestion Products.

(A) Schematic of MNase-SSP, which involves melting of MNase digestion products followed by 3′ adaptor ligation, fragment immobilization, second-strand synthesis, double-stranded adaptor ligation, PCR, and sequencing.
(B) Fragment-length distributions for SSP and DSP preparations of MNase digest ML and replicate ML R2 and published MNase datasets (Carone et al., 2014; Ishii et al., 2015).
(C) Terminal dinucleotide biases for the same libraries as in (B). Biases are computed as the natural log of the ratio of the observed dinucleotide frequency over the expected dinucleotide frequency found in the mouse genome. + refers to the 5′ end of the positive strand, while — refers to the 3′ end of the positive strand (all dinucleotide sequences are shown 5′ →3′).
As a proof of concept, we applied MNase-SSP to two murine embryonic stem cell (mESC) lines grown in serum and leukemia inhibitory factor (libraries ML and FL). We generated multiple lightly digested MNase-treated samples (1 min digestion with 1 U MNase/5 × 106 nuclei), from which we used 10 ng of purified DNA to construct sequencing libraries (sequencing depths are summarized in Table S1). Though we observed subtle variation in the fragment-length distribution across replicate experiments (likely the consequence of different MNase aliquots) (Figure S1), we observed clear enrichment for short (<80 base pairs [bp]) fragments in SSP libraries when compared to either matched (i.e., same input source) or published double-stranded protocol (DSP) MNase-seq (MNase-DSP) datasets (Figure 1B; Figure S1A). One published DSP library (Carone et al., 2014) was enriched for short fragments compared with all other DSP libraries. However, when we compared the relative abundance of 30–50 bp fragments in our SSP libraries versus this DSP library (Carone et al., 2014), SSP libraries were ~2-fold enriched (ML SSP, 2.08-fold; FL SSP, 2.36-fold). We also found that melting of DNA fragments is necessary for short fragment enrichment, because single-stranded ligation to unmelted input did not result in short fragment enrichment (Figure S1A).
Because of the single-stranded nature of its library preparation, MNase-SSP harbors distinct, asymmetric dinucleotide sequence biases compared with our in-house MNase-DSP libraries, as well as two published DSP datasets (Figure 1C, top two rows versus remaining rows) (Carone et al., 2014; Ishii et al., 2015). This suggests that MNase-SSP may capture particles previously missed due to the stronger symmetric biases associated with double-stranded library preparations. The technical improvements of MNase-SSP versus traditional MNase-seq protocols enable decoupling of true sequence-encoded protein-DNA interactions versus well-documented intrinsic technical biases associated with MNase digestion. To demonstrate this decoupling, we summarized sequence bias as a simple sum of log-odds ratios for every possible dinucleotide with respect to the background dinucleotide frequency of the mouse genome and plotted this sum as a function of fragment length for both 5′ ends (Figure S1B, top) and 3′ ends (Figure S1B, bottom) of sequenced fragments. We assume that enzymatic sequence biases (e.g., MNase sequence preferences and biases that are consequences of enzymatic steps of Illumina library preparation) should be uniformly distributed across all sampled fragment-length classes. While both SSP and analyzed DSP libraries demonstrate substantial variability in bias across diversely sized fragments, both sequenced SSP libraries demonstrate markedly lower overall terminal dinucleotide sequence bias compared to DSP libraries, independent of fragment length and independent of strand. These data suggest that the MNase-SSP library preparation may better distinguish sequence biases that are of biological origin (e.g., sequence-influenced preferences for nucleosome occupancy) (Struhl and Segal, 2013) and those that arise as a product of library preparation. These comparisons highlight the importance of considering all enzymatic steps when studying sequence biases in nuclease-digestion experiments and provide a resource for further disentangling the intrinsic sequence preferences of DNA binding proteins in vivo from multiple sources of technical bias.
MNase-SSP Libraries Are Enriched for Short Fragments of Active Regulatory DNA
We hypothesized that the enriched fraction of short reads in MNase-SSP libraries would coincide with enriched coverage of active regulatory DNA, including active transcriptional start sites (TSSs), and more generally, chromatin decorated with active histone marks, i.e., histone H3 lysine 27 acetylation (H3K27ac), histone H3 lysine 4 trimethylation (H3K4me3), and histone H3 lysine 4 monomethylation (H3K4me1). To test this hypothesis, we subjected our libraries to a fragment-length fold enrichment (FLFE) analysis (Risca et al., 2017), wherein fold enrichments of fragments of varying size classes within prespecified regions of the genome are computed, relative to the genome-wide background fragment-length distribution (Figure S2).
Consistent with MNase-SSP libraries capturing short fragments of regulatory DNA, we observe greater enrichment of shorter fragment lengths in 1 kilobase (kb) windows surrounding the TSS of highly expressed genes compared to lowly or unexpressed genes (deciles of expression in Figure S2; expression values from Marks et al., 2015). Short fragment enrichment for different chromatin states varies by mark, with H3K4me3 (associated with active promoters) demonstrating strong enrichment and histone H3 lysine 9 trimethylation (H3K9me3) (associated with heterochromatin) demonstrating the strongest depletion of 30–50 bp fragments (chromatin states from Yue et al., 2014). We also observe short fragment enrichment in H3K27ac- and H3K4me1-decorated regions, albeit more weakly, which may reflect differences in the relative abundances of TFs and basal transcriptional machinery in regions with these marks. We also note modest short fragment enrichment in H3K27me3-decorated chromatin; FLFEs calculated using the sequence in peaks modified by both H3K4me3 and H3K27me3 (i.e., bivalent) versus exclusively H3K27me3-marked peaks (Figure S3) suggests that the modest short fragment enrichment for H3K27me3 marks shown in Figure S2 is driven by bivalent promoters (Bernstein et al., 2006; Shema et al., 2016). These data suggest that the diversity of fragment lengths captured by MNase-SSP should enable finer-scale analyses of links between promoter activity and subnucleosome-scale chromatin structure.
MNase-SSP Captures the Subunit Architecture of Murine Promoter Chromatin
Given the increased representation of short fragments in our libraries, we next sought to determine whether MNase-SSP libraries display a structured pattern of fragments at the TSSs of RNA polymerase II (Pol II) and Pol III genes, i.e., “footprinting” of the binding sites of transcriptional regulatory machinery.
We first analyzed the enrichment of varying size classes of SSP fragments in the context of Pol II promoters in the mESC genome to determine the identity of Pol II promoter-bound minimally protected fragments. We defined +1 nucleosomes for all genes in the mESC genome using the gold-standard chemical cleavage map of Voong et al. (2016), computed local enrichment of our sequenced fragment midpoints with respect to these +1 dyads, and then stratified these data by fragment-length class (Figure 2A, rows ordered from longest to shortest bins) and expression level (Figure 2A, columns). At active genes (i.e., top 30% of expressed genes) (Figure 2A, left column), we observed previously defined hallmarks of murine promoters, including the previously defined, well-positioned, nuclease-sensitive −1 nucleosome (Ishii et al., 2015; Voong et al., 2016), observed in our data as fragments that are less than 130 bp in length; a well-positioned +1 nucleosome, observed in 130–159 bp fragments; and a patterned arrangement of subnucleosomal and TF-bound fragments (<100 bp in length) with respect to the +1 nucleosome. This is in contrast to inactive genes, which demonstrate phasing of longer nucleosome-DNA protections, and negligible enrichment for short fragments, consistent with our FLFE analyses (Figure 2A, right column). The concordance between MNase-SSP-derived nucleosomal fragments and true in vivo nucleosome positioning is further illustrated by the overlap between MNase-SSP fragment midpoints and fragment ends derived from in vivo chemical cleavage mapping (Voong et al., 2016) (see the 130–159 bp fragments of Figure 2A, top row; chemical cleavage data are shown in gray).
Figure 2. MNase-SSP Captures the Subunit Architecture of Murine Promoter Chromatin at High Resolution.
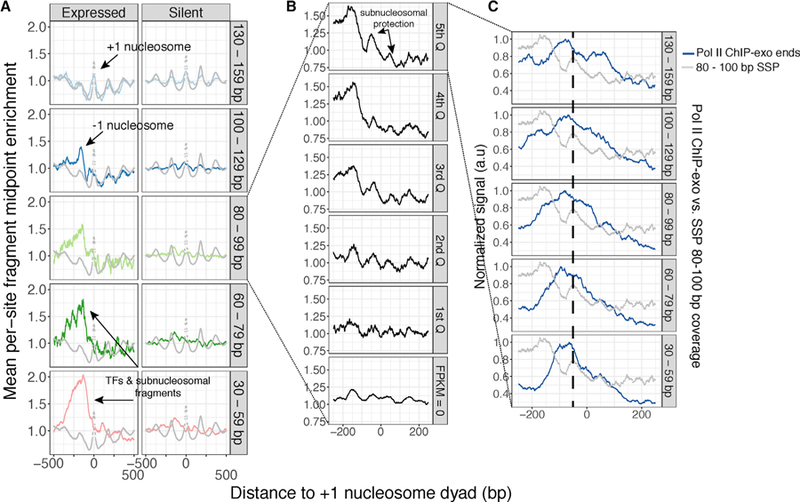
(A) MNase-SSP data can be fractionated by size to relate the positions of distinct protein-DNA contacts. Here, we examine the enrichment of sequenced fragment midpoints with respect to the +1 nucleosome of expressed genes (left) and silent genes (right). Expressed genes are defined as the top 30% of genes ranked by expression; silent genes are all genes with fragments per kilobase million (FPKM) = 0. Gray dotted lines represent the raw H4 chemical cleavage signal of Voong et al. (2016). For all plots, enrichment is defined as the fold difference between smoothed midpoint coverage (25 bp running mean) and average midpoint coverage in a 2 kb window centered at the feature. We then average this value over all genomic sites in a given class (e.g., expressed genes).
(B) MNase-SSP allows for dissection of subnucleosome-scale protein-DNA interactions. Here, we plot enrichment of 80–100 nt fragments with respect to the +1 nucleosome, observing increasing asymmetry in subnucleosomal particle enrichment with increasing gene expression.
(C) MNase-SSP data represent the superposition of fragments representing Pol II-nucleosome interactions and fragments representing subnucleosomal H2A/ H2B dimers. Enrichment for size-fractionated Pol II ChIP-exo fragment ends is shown in blue, while MNase-SSP data are shown in gray. Longer Pol II ChIP-exo fragments are found distal from the +1 nucleosome, while shorter fragments, indicative of bona fide Pol II footprints, overlap observed MNase-SSP peaks. For both vectors, enrichment is calculated as in (A) and then normalized by the maximum value. The dashed line is included to highlight overlap of Pol II ChIP-exo fragment ends and promoter-proximal +1 subnucleosomal particle asymmetry.
We also observed clear differences in subnucleosomal (i.e., 80–100 bp) patterning at active genes versus inactive genes (Figure 2A, middle row). A study of Drosophila S2 cells has suggested that 80 to 100 bp nucleolytic fragments result from coordinated inter- and intranucleosomal cleavage flanking a single H2A/H2B dimer within the nucleosome core particle (Ramachandran et al., 2017). Analysis of our subnucleosomal fragment distributions in relation to quintiles of gene expression (Figure 2B) reveals a positive correlation between asymmetry of these subnucleosomal fragments and higher expression, suggesting the superposition of two similarly sized types of protein-DNA interaction: (1) symmetric protein-DNA contacts between promoter-proximal and promoter-distal H2A/H2B dimers and (2) interrogation of the +1 nucleosome by paused Pol II.
To test this hypothesis, we compared our data with published paired-end Pol II ChIP-exo sequencing data from mESCs (de Dieuleveult et al., 2016) (Figure 2C). We took advantage of the paired-end nature of these data to stratify ChIP-exo fragment-end distributions by size class, under the assumption that longer fragments represent larger Pol II-containing protein-DNA complexes, while shorter fragments more accurately position Pol II. We observe overlap of 30 to 60 bp Pol II ChIP-exo fragment ends with the promoter-proximal subnucleosomal fragments captured by MNase-SSP, suggesting that the observed asymmetries are at least partly because of interrogation of the +1 nucleosome by transiting Pol II. These results are consistent with the +1 nucleosome serving as a barrier for Pol II (Weber et al., 2014) and demonstrate the utility of MNase-SSP in resolving the fine-scale structure of protein-DNA interactions at mammalian Pol II promoters.
We next sought to determine whether the added sensitivity of MNase-SSP could provide information at another class of mammalian promoters: Pol III-driven tRNA promoters. To assess this, we generated fragment-length versus midpoint V plots centered at the TSS of all tRNAs in the murine genome (Figure 3A) (Henikoff et al., 2011; Chan and Lowe, 2009). V plot analysis over tRNA TSSs revealed the tripartite architecture of protein-DNA interactions flanked by well-positioned nucleosomes, consistent with the known positioning of the basal TFs TFIIIB upstream of the tRNA TSS, TFIIIC binding to the B-box element, and a larger class of fragments that we speculate may also reflect positioning of TFIIIC over the A-box binding element (Kirkland et al., 2013). When compared with results from a high-coverage, published MNase-DSP dataset, we found that this existing dataset recapitulated many features found in MNase-SSP, albeit with reduced coverage of the short minimally protected fragments suggestive of TFIIIC-B-box interactions (Figure 3B). Altogether, these analyses demonstrate that fragments captured by MNase-SSP represent footprints of active polymerases and their basal transcriptional machinery, as well as labile nucleosomes and subnucleosomal histone-DNA contacts.
Figure 3. MNase-SSP Footprints Protein-DNA Interactions at tRNA Promoters.

(A) V plot over tRNA TSSs generated for library ML. The V plot appears to localize internal TFIIIC binding to the A and B boxes of tRNA, as well as upstream binding of TFIIIB (schematized and aligned to the V plot).
(B) Line plots comparing fragment midpoint coverage at mESC tRNA loci for a deeply sequenced published MNase-DSP dataset (Carone et al., 2014) against coverage from SSP library ML. Consistent with both assays employing MNase, broad patterning at different fragment classes is maintained, though SSP libraries demonstrate enrichment for short DNA fragments, likely representing true regulatory protein-DNA interactions.
MNase-SSP Resolves Protein-DNA Interactions at Putative TF Binding Sites
We next sought to determine the extent to which MNase-SSP can footprint sequence-specific TFs. To study this, we re-analyzed various mESC TF ChIP-seq datasets (Chronis et al., 2017; Domcke et al., 2015; Yu et al., 2011, 2014; Sigova et al., 2015) to determine a reference set of predicted TF binding sites (STAR Methods) and generated V plots for each of these factors (Figure S4). For each factor, we observed characteristic V patterning, showing enrichment of fragment midpoints over predicted motif occurrences emblematic of in vivo TF-DNA interactions. However, each of these factors varied considerably in the degree to which short fragments were enriched with respect to background coverage and in the relative distributions of fragment midpoints of varying length classes with respect to predicted motif centers.
The assay for transposase accessible chromatin sequencing (ATAC-seq) assay, which relies on the Tn5 transposome, has been used as a tool for measuring chromatin accessibility and for marking sites of protein-DNA interaction (Buenrostro et al., 2013). Given that ATAC-seq and MNase-SSP both enrich for short fragments of regulatory DNA, we sought to compare Tn5-derived minimally protected fragments with MNase-SSP-derived fragments over a range of fragment-length classes. To do so, we in silico-fractionated published ATAC-seq data (Giorgetti et al., 2016) and MNase-SSP data and plotted the relative enrichment of fragment midpoints with respect to predicted mESC binding sites for Ctcf and Rest (Figure 4). We found that ATAC-seq and MNase-SSP both footprint these factors at specific length classes, with MNase-SSP demonstrating enrichment in fragments sized 30–59 bp over predicted motifs, and ATAC-seq demonstrating enrichment across a broader range of fragment lengths. Although focal enrichment in MNase-SSP broadly tracks with expectations for the relative sizes of TF and nucleosome-sized particles, ATAC-seq enrichments obey a different pattern, with non-specific enrichment at very short fragment lengths (note three peaks in the 30–59 bp range) and specific enrichment in longer fragments from 60–159 bp. This suggests that the fragments obtained by MNase-SSP footprint the base pairs occupied by TFs and nucleosomes with greater resolution than ATAC-seq, possibly because of steric or kinetic differences in how MNase and Tn5 bind and process native chromatin. A per-site fragment midpoint enrichment analysis at predicted Ctcf and Rest binding sites supports this view, with per-site Ctcf and Rest fragment midpoint enrichments demonstrating modest positive correlations with predicted FIMO scores and ChIP signal intensity (Figure 5; Figure S5).
Figure 4. Comparison of ATAC-Seq and MNase-SSP Fragments Found at Predicted Transcription Factor Binding Sites.

(A) Size-fractionated line plots showing enrichment of fragment midpoints for varying sizes of sequenced DNA fragments over predicted Ctcf binding sites for ATAC-seq and MNase-SSP (library ML). While both assays footprint Ctcf, fragment-size patterning varies substantially between assays.
(B) As in (A) but for the transcription factor Rest. All line plots represent fragment midpoint enrichment, smoothed with a 10 bp running mean. Because ATAC-seq and MNase-SSP libraries exhibit different fragment-length distributions, different y axes are presented for each assay.
Figure 5. MNase-SSP Short Fragments Footprint Ctcf and Rest Binding Sites.

(A) Heatmap of per-site fragment midpoint enrichment centered at predicted Ctcf binding sites for SSP fragments sized between 30 and 59 bp in length. Fragment midpoint enrichment was calculated with respect to a 2 kilobase background coverage distribution, smoothed using a 10 bp running mean, and then plotted in heatmap form sorted by decreasing fragment midpoint enrichment.
(B) Heatmap as in (A) but for the transcription factor Nrsf/Rest.
MNase-SSP Resolves Heterogeneous Cys2-His2 Zinc-Finger TF Binding Modes
Because these data suggest MNase-SSP could provide high-resolution information on TF occupancy, we next hypothesized that our method would be able to resolve subtle site-specific differences in the way TFs might engage a genomic sequence. Ctcf contains 11 Cys2-His2 zinc-finger DNA binding domains, and the manner by which these fingers interrogate chromatin is thought to encompass a functional code (Lobanenkov et al., 1990; Phillips and Corces, 2009). To test whether MNase-SSP libraries could capture information relevant to this code, we generated a V plot to determine the relative enrichment of fragment midpoints within a 2 kb window, averaged over gold-standard Encyclopedia of DNA Elements (ENCODE) Ctcf ChIP-seq sites in the mESC genome (Figure 6A) (Yue et al., 2014). Consistent with our previous V plot analyses, we observed massive enrichment for fragment midpoints immediately proximal to the center of the core Ctcf motif; on closer inspection, however, we noted a striking bipartite pattern of fragment midpoints immediately over the predicted motif center (Figure 6A, inset), with focal midpoint enrichment at both ~30 and ~40 bp in length and with 40 bp fragments centered upstream of the center of the core Ctcf motif. To determine Ctcf binding sites that preferentially led to these longer minimally protected fragments, we used k-means clustering (k = 3) to separate site-by-site fragment midpoint coverage profiles (Figure 5A), using all fragments sized 30 to 49 bp falling within a 160 bp window centered at the core Ctcf motif (Figure 6B).
Figure 6. MNase-SSP Enables Dissection of Unique Ctcf Binding Modes.

(A) V plot centered at ENCODE-defined Ctcf motifs. V plots show clearly phased nucleosomes and strong enrichment for short fragment midpoints immediately over the core Ctcf binding motif. Inset: closer inspection of the Ctcf V plot reveals bipartite patterning of fragment midpoints with respect to the core Ctcf motif.
(B) k-means clustering (k = 3) of smoothed (5 bp running mean) per-site fragment midpoint enrichment in a 160 bp window separates >18,000 Ctcf binding sites into distinct clusters.
(C) Cluster 3 is separated from clusters 1 and 2 by FIMO score, suggesting that cluster 3 is capturing low-affinity Ctcf binding sites. Distribution differences between clusters 1 and 3 and clusters 2 and 3 are both significant (Kolmogorov-Smirnov: cluster 3 versus cluster 1, D = 0.298; cluster 3 versus cluster 2, D = 0.230; p < 2.2E—16 for both tests).
(D) De novo motif detection using the MEME suite uncovers a cluster 2-specific motif, which corresponds to the known motif employed by Ctcf while using zinc fingers 9–11.
(E) Cartoon representation of how different binding modes of Ctcf are captured by MNase-SSP.
First, we compared our cluster assignments against two other SSP libraries (FL and ML replicate 2 [R2]), finding that cluster-specific positional shifts in midpoint coverage with respect to the Ctcf motif center were reproducible across multiple SSP libraries (Figure S6A). This suggests that the patterns observed here are due to properties of the Ctcf sites and are not a technical artifact arising from differences in digestion extent or library preparation. Next, we examined the distribution of Find Individual Motif Occurrences (FIMO) scores for each cluster of Ctcf sites (Figure 6C), finding that cluster 3 captured significantly lower-scoring Ctcf motif occurrences (Kolmogorov-Smirnov: cluster 3 versus cluster 1, D = 0.298; cluster 3 versus cluster 2, D = 0.230; p < 2.2E—16 for both tests), consistent with cluster 3 capturing low-affinity Ctcf binding sites. Finally, we used de novo motif detection software (Bailey et al., 2009) to discover motifs specific to the offset cluster 2 or the centered cluster 1. We discovered one cluster 2-specific motif, TG[CT]A[GA]T (Figure 6D), a motif that is consistent with MNase digestion releasing the 40 bp footprint of Ctcf engaging chromatin using zinc fingers 9 to 11 (Figure 6E) (Nakahashi et al., 2013).
To demonstrate that this type of analysis is applicable beyond Ctcf, we repeated the same clustering analysis for the Cys2-His2 (C2H2) zinc-finger protein Nrsf/Rest (persite enrichments are shown in Figure 5B). As with Ctcf, we were able to define three reproducible clusters of binding sites using short MNase-SSP fragments alone; two clusters clearly capture discrete binding modes of the TF (Figure S6B), with cluster 3 demonstrating enrichment for fragments centered immediately upstream of the center of the core RE1 motif. Finally, a third low-coverage cluster was captured (cluster 2), which likely captures weak site occupancy as inferred by the motif similarity score (Figure S6C), because cluster 2 sites demonstrated significantly lower FIMO scores (Kolmogorov-Smirnov [K.S.]: D = 0.313, p = 6.22E—15 for cluster 1 versus cluster 2; D = 0.277, p = 1.96E—11 for cluster 3 versus cluster 2). Due to the relatively low number of sites per cluster, however, we were unable to determine significantly enriched sequences beyond the core RE1 element and did not observe that marked enrichment of known REST interactors separated clusters 1 and 3 (Yu et al., 2011). Nevertheless, these results suggest that the improved sensitivity of SSP allows for discrimination of site-specific differences in how TFs interrogate chromatin.
The exact architecture of in vivo Ctcf-DNA interactions remains elusive; though genomic studies like this suggest multiple binding modes for Ctcf, crystallographic study has failed to demonstrate direct protein-DNA interactions between zinc fingers 9–11 and target sequence (Hashimoto et al., 2017). Though ChIP-exo and MNase-SSP both demonstrate statistical enrichment for the extended Ctcf motif sequence, it is difficult to determine whether this discrepancy results from the sequences tested in structural studies or the observed extended motif is driven by additional biophysical factors (e.g., speculatively, indirect protection of the motif by zinc finger (ZF) 9–zinc finger 11 interacting with other nucleoprotein partners). Another in vitro study using atomic force microscopy has demonstrated that CTCF-DNA interactions using all 11 zinc fingers (as opposed to the truncated set of zinc fingers 6–8) induces a unique wrapped DNA conformation (Mawhinney et al., 2018), which may also contribute to the unique patterning observed in our data. Though MNase-SSP in isolation cannot distinguish among these models, integrative analysis of the MNase-SSP data and such orthogonal data types may clarify how Ctcf and similar proteins interrogate chromatin.
Minimally Protected Fragment Identities Are Intrinsically Linked to Digestion Extent
A critical parameter in any nuclease footprinting experiment, independent of the methodologies used to characterize the resulting fragments, is the extent to which chromatin is digested. In analyzing the SSP libraries presented here, we noted subtle differences between replicate libraries derived from different MNase digestion experiments. Variability in the types of fragments captured by MNase-seq is well documented (Rizzo et al., 2012), and we sought to use SSP to broadly characterize the relationships among digestion extent, sequence bias, and identity of sequenced minimally protected fragments of various size classes. To do this, we allowed our replicate digestion experiment (ML R2) to digest past 1 min, sampled digested chromatin at regular intervals, and then sequenced 10 ng of nucleolytic fragments using SSP. Fragment-length distributions for these libraries reveal consistent enrichment for short digested fragments in all libraries, suggesting that short fragment enrichment by SSP does not depend on digestion extent (Figure S7A). We also observed an increase in the overall bias of our libraries at every fragment-length class as digestions were allowed to progress (Figure S7B), with sharp spikes in bias precisely at nucleosome-sized fragments. Based on these results, we hypothesized that these increased digestion-dependent trends are likely reflective of biology—as MNase digestion progresses, open chromatin is completely digested, increasing the relative abundance of nucleosome-derived fragments, each of which is inherently biased by the low amount of biological sequence preference exhibited by nucleosomes.
To qualitatively test this hypothesis, we generated V plots for each of our libraries centered at all chemical cleavage-defined dyads on murine chromosome 12 (Figures 7A–7E). Consistent with our hypothesis, we observe increased enrichment for well-patterned subnucleosomal protections with a periodicity of 10 bp in both dimensions as digestion extent progresses, as well as a loss of the short minimally protected linker sequence. However, overdigestion has distinct effects depending on the feature being studied. As a comparison, we generated V plots over Ctcf sites for the same set of sequenced libraries (Figures 7F–7J). We found that even after 20 min of MNase digestion, a fraction of very short fragments still co-localize with the Ctcf motif, suggesting that some portion of Ctcf sites is recalcitrant to nucleolytic digestion. While deeper sequencing and further analysis are required to determine whether these relationships pose biological significance, we believe that these preliminary analyses demonstrate the value of SSP in characterizing chromatin preparations of any digestion extent while suggesting a set of future experiments pairing systematic digestion time courses of chromatin with SSP profiling.
Figure 7. MNase Digestion Extent Leads to the Capture of Distinct Sets of Protein-DNA Contacts.

(A–E) MNase digestion progressively liberates intranucleosomal fragments. Here, we generate V plots centered at chemical cleavage-defined chromosome 12 (chr12) dyads (Voong et al., 2016) for 5 SSP libraries taken from an MNase digestion time course to examine the effect of MNase digestion on nucleosome-sized fragments. Increased digestion leads to progressive liberation of every possible subnucleosomal fragment within the nucleosome core particle, with clear 10 bp periodicity indicative of sites of accessible DNA as DNA is wound along the histone octamer.
(F–J) Extensive digestion also affects enrichment over Ctcf sites, as longer protected fragments are progressively digested until only a subset of minimally protected core fragments remains.
DISCUSSION
Here, we present MNase-SSP, a sequencing library preparation protocol that improves upon existing methods for sequencing nucleolytic digestion products in two critical ways. First, due to the single-stranded nature of the protocol, and likely because of a combination of nicked fragment capture and single-stranded ligation biases (Li and Weeks, 2006), MNase-SSP preferentially enriches for short DNA fragments. These short fragments represent both subnucleosomal protections and minimally protected TF-bound DNA fragments, enabling fine-scale analysis of chromatin substructure and direct comparison of relationships among TF occupancy, nucleosomal architecture, and nucleosome positioning. As a proof of concept of this, we demonstrate that SSP data can be used to dissect polymerase-nucleosome interactions at active Pol II genes, map protein-DNA interactions at tRNA promoters, interrogate the relationships between TF occupancy and nucleosome occupancy, and dissect the binding modes of C2H2 zinc-finger TFs. The enrichment for short fragments is necessarily associated with a depletion of long nucleolytic fragments in MNase-SSP libraries. In principle, the relative abundance of short versus long fragments can be tuned through simple size selection of long molecules following PCR amplification.
Second, MNase-SSP harbors a distinct and muted sequence bias compared to traditional double-stranded sequencing protocols. This novel bias profile allows for explicit analysis of the sequence preferences of MNase, as well as the biological sequence preferences of various protein-DNA interactions. The results presented here highlight the importance of considering all enzymatic steps when generating high-throughput sequencing libraries and point to a largely unappreciated contribution of other DNA-processing enzymes to dinucleotide sequence biases in MNase-seq libraries.
Third, like the popular ATAC-seq method, MNase-SSP markedly enriches for short DNA fragments. While ATAC-seq captures accessible chromatin genome-wide, MNase-SSP does not expressly bias for open chromatin, though this limitation could be circumvented through salt fractionation (Henikoff et al., 2009). Both assays capture sites of protein-DNA contact at high resolution, though purified fragment lengths are less interpretable by ATAC-seq, likely because of the steric considerations required for productive transposition events by Tn5 compared to digestion by MNase. As such, we see MNase-SSP as a powerful complement to ATAC-seq—one that more readily profiles the lengths of subnucleosomal and TF-mediated protected stretches at DNA at the cost of increased sequencing depth.
Finally, as detailed earlier, the fragments profiled by MNase-SSP (and any nucleolytic digestion assay) depend considerably on the digestion extent used; we strongly recommend testing and sequencing a continuum of digestion extents when using any MNase-based approach to map protein-DNA interactions. Still, we foresee several potential experiments leveraging the added sensitivity of MNase-SSP to extend the concepts of nucleosome fragility (Kubik et al., 2015) and nucleosome nuclease hypersensitivity (Mieczkowski et al., 2016) to the diverse array of protein-DNA interactions constituting chromatin.
How else might SSP be applied? We close by emphasizing the versatility of the SSP for capturing protein-DNA interactions in various biological contexts. The general acceptance of high-throughput sequencing as a readout for chromatin structure has led to the development of a large number of enrichment-based strategies for mapping specific protein-DNA interactions at high resolution. Though beyond the scope of this study, we are confident that SSP can be applied as a library protocol to sequence the DNA resulting from ChIP-exo (Rhee and Pugh, 2011; He et al., 2015) and MNase-ChIP (Kasinathan et al., 2014; Skene and Henikoff, 2015) approaches, as well as other MNase-based protocols for probing chromatin substructure (e.g., CUT&RUN and mapping in vivo nascent chromatin with EdU and sequencing [MINCE-seq]) (Ramachandran and Henikoff, 2016; Skene and Henikoff, 2017). In addition, the original SSP has been reported to work on as few as 8 picograms (pg) of DNA, raising the intriguing possibility of employing SSP in single-cell sequencing assays to study protein-DNA interactions in individually isolated single cells or, preferably, in thousands of single cells in parallel via combinatorial indexing (Cao et al., 2017; Cusanovich et al., 2015; Ramani et al., 2017). In each of these cases, we envision that the added sensitivity and reduced bias of SSP will lead to more complete, higher-resolution maps of the full complement of protein-DNA interactions comprising chromatin.
STAR★METHODS
CONTACT FOR REAGENT AND RESOURCE SHARING
Further information and requests for resources and reagents should be directed to and will be fulfilled by Jay Shendure (shendure@uw.edu).
EXPERIMENTAL MODEL AND SUBJECT DETAILS
Cell Culture
Male F123-Cast/129 and female F121-Tsix-Stop-Cas/129 (Luikenhuis et al., 2001) mESC lines (gifts from C. Disteche lab) were cultured according to standard protocols in ES-DMEM containing 1000 U / mL LIF (Millipore), 1X Pen/Strep (Life Technologies), and 15% FBS (Life Technologies). Cells were tested for mycoplasma contamination by PCR and by scanning sequenced reads for known common contaminant sequences.
METHOD DETAILS
Nuclei Isolation and MNase Digestion
ES cells were lightly trypsinized to create single cell suspensions, aliquoted into 2.5E6 cell aliquots, washed once with 1X PBS, resuspended in 500 uL Buffer NE1 containing EDTA-free protease inhibitor (Roche) (Buffer NE1: 20 mM HEPES, 10 mM KCl, 1 mM MgCl2, 0.1% Triton X-100, 20% Glycerol), pipetted up and down 5X using a wide-bore tip, then incubated on ice for 5 min. Nuclei were then pelleted at 600xg / 4°C for 5 min, and washed once with 1 mL cold Buffer M containing EDTA-free protease inhibitor (15 mM Tris HCl pH 8.0, 15 mM NaCl, 60 mM KCl, 0.5 mM spermidine). Nuclei were then resuspended in 1 mL pre-warmed Buffer M containing 1 mM CaCl2, after which 1U MNase (Sigma) was added and the reaction was incubated for 1 min. at 37°C. Reaction was terminated by the addition of EGTA to a final concentration of 2 mM, and the entire reaction volume was subjected to a standard phenol-chloroform-isoamyl alcohol DNA extraction. We did not perform any size extraction prior to sequencing library preparation.
Time-course experiments were performed essentially as above, but allowing digestion to progress 2.5 min., 5 min., 10 min., and 20 min prior to quenching with EGTA and phenol-chloroform-isoamyl alcohol DNA extraction. We note that we did not perform any size extraction for any samples generated in this study.
MNase-SSP
10 ng of purified DNA was used as input to the protocol. Input DNA was mixed with dephosphorylation mix (4 uL 5X CircLigase II buffer, 2 uL MnCl2, 14.5 uL ddH2O with sample, 1 uL FastAP), incubated at 37°C for 30 min., 95°C for 3 min., then transferred to an slurry of liquid ice and water for 1 min. Melted DNA was then incubated with ligation master mix (16 uL 50% PEG-4000, 0.5 uL single-strand adaptor at 10 uM, 2 uL CircLigase II enzyme) at 60°C overnight. To pull down biotinylated ssDNA fragments, ligation reactions were terminated by 95°C treatment for 3 min., and then mixed with 250 uL of pre-washed streptavidin MyOne C1 beads (20 uL stock) in bead wash buffer (100 uL 1M Tris-HCl, pH 8.0; 2 mL 5M NaCl; 20 uL 0.5M EDTA, pH 8.0; 25 uL 20% Tween-20; 250 uL 20% SDS; 7.6 mL ddH2O). Slurries were rotated at 25°C for 30 min. Beads were then washed once with Wash Buffer A (500 uL Tris-HCl, pH 8.0; 1 mL 5M NaCl; 100 uL 0.5M EDTA, pH 8.0; 150 uL 20% Tween-20; 1.25 mL 20% SDS; 47 mL ddH2O) and once with Wash Buffer B (500 uL Tris-HC, pH 8.0; 1 mL 5M NaCl; 100 uL 0.5M EDTA, pH 8.0; 150 uL 20% Tween-20; 48.25 mL ddH2O). To carry out second-strand synthesis, immobilized beads were resuspended in second strand synthesis mix (5 uL 10X isothermal amplification buffer; 1.25 uL 10 mM dNTP mix; 1 uL 100 uM extension primer CL9; 39.75 uL ddH2O) and incubated at 65°C for 3 min, and then transferred to a slurry of liquid ice and water for 1 min. Following ice water incubation, 3 uL of Bst 2.0 DNA polymerase was added, and the resulting reaction mixtures were incubated using the following program with mixing: 15°C 9 mins →19°C 4 mins →23°C 4 mins →27°C 4 mins →31°C 4 mins →34°C 4 mins →37°C 10 mins.
Following second strand synthesis, beads were washed once with Wash Buffer A and once with Wash Buffer B, and then resuspended in 3′ end fill mix (10 uL NEBuffer 2; 2.5 uL 1% Tween-20; 1 uL 10 mM dNTP mix; 85.5 uL ddH2O; 1 uL T4 DNA polymerase). Reactions were incubated at 25°C for 30 min. with mixing. Polished dsDNA was then subjected to double-stranded adaptor ligation: beads were washed once with Wash Buffer A, resuspended in Wash Buffer Stringent (250 uL 20% SDS; 250 uL 20X SSC; 49.6 mL ddH2O), incubated at 45°C for 5 min., washed once with Wash Buffer B, and resuspended in ligation master mix (10 uL 10X T5 DNA ligase buffer w/ ATP; 10 uL 50% PEG-4000; 2.5 uL 1% Tween-20; 73.5 uL ddH2O; 2 uL 100 uM double-stranded adaptor, and 2 uL T4 DNA ligase). Ligation reactions were incubated at 25°C for 2 hours with mixing. Ligated beads were then washed once with Wash Buffer A, resuspended in Wash Buffer Stringent, incubated at 45°C for 5 min., washed once with Wash Buffer B, and resuspended in 20 uL TET buffer (500 uL 1M Tris-HCl, pH 8.0; 100 uL 0.5M EDTA, pH 8.0; 150 uL 20% Tween-20; 49.25 mL ddH2O). Samples were then incubated at 95°C for 3 min., immobilized on the magnet, and the supernatant transferred to a fresh tube. Resulting single-stranded DNA could be stored at −20°C indefinitely, or subjected to final Illumina adaptor PCR, with the following reaction conditions: 25 uL 2X Kapa HiFi master mix; 1.25 uL 10 uM P5 primer, 12 uL eluted fragments; 10 uL ddH2O, and 1.25 uL 10 uM barcoded P7 primer. Reactions were cycled using the provided KAPA Hi-Fi protocol for 8 – 12 cycles. All libraries were purified using a final 1.8X AMPure XP (Beckman Coulter) cleanup, quantified using the Qubit system (Invitrogen), and then sequenced, without size-selection, on an Illumina MiSeq and/or Illumina NextSeq 500 instrument.
As a control, 500 ng of purified DNA was used as input for double-stranded libraries, which were prepared using the Illumina TruSeq protocol. Libraries were also purified using a final 1.8X AMPure XP (Beckman Coulter) cleanup, quantified using the Qubit system (Invitrogen), and then sequenced, without size-selection, on an Illumina MiSeq and/or Illumina NextSeq 500 instrument.
QUANTIFICATION AND STATISTICAL ANALYSIS
All code and pipelines used for data analysis are available at GitHub at https://github.com/VRam142/MNase_SSP. Many scripts were modified using original source code from (Snyder et al., 2016).
Read processing & alignment
Raw paired-end reads were first adaptor-clipped using the SeqPrep utility, with a minimum read size cutoff of 30 bp. Adaptor clipped read pairs were aligned to mouse reference mm10 using bowtie2 with default parameters. Aligned BAM files were sorted, deduplicated using a custom Python script, re-sorted, and indexed using samtools and the PySAM API. All analyses were carried out in sorted, indexed BAM files.
Fragment Length Distribution calculation
A custom Python script calling the PySAM API was used to iterate, for each full chromosome in the mm10 assembly, through all mapped reads with MAPQ > = 5 and calculate the alignment length. These values were then tabulated into histogram form for each sample, aggregated into a matrix, and plotted using ggplot2 in R.
Sequence bias calculations
Terminal 2-mer biases for the 5′ and 3′ ends of fragments were calculated as in Snyder et al. (2016). Briefly, the PySAM API was used to iterate through all mapped reads and tabulate the abundance of each possible 2-mer and the 5′ and 3′ ends of mapped reads, taking strand into account. These 2-mer frequencies were then compared against the background 2-mer frequency in the mm10 assembly, and a log-odds ratio was calculated for each 2-mer as ln(f_2mer_mappedreads / f_2mer_mm10). These were tabulated and plotted using ggplot2 in R.
For bias vector calculations, we computed the “overall bias” as the sum of all log-odds ratios, but calculated these values after binning mapped reads by fragment length. This vector of “overall” bias as a function of fragment length was then plotted using ggplot2 in R.
Fragment-length Fold Enrichment analyses
Fragment-length fold enrichment (FLFE) analyses were performed as described in (Risca et al., 2017). Expression data (FPKM values) from Marks et al. (2015) was downloaded, averaged over replicates, and used to classify all expressed genes (i.e., FPKM ! = 0) into deciles, with the 1st “decile” including all unexpressed genes as well as genes with FPKM values in the first decile. For each promoter in each bin (and for all sequences in chromatin domains defined by (Yue et al., 2014)), we extracted sequence ± 500 bp from the GENCODE annotated TSS, and calculated the fold differences between the abundance of fragments of all fragments sized between 30 and 300 bp with respect to the background, genome-wide fragment length distribution. These values were then aggregated into a matrix and visualized using ggplot2 in R. For Figure S3, we extracted FLFE values between 30 and 50 bp, averaged these for each class of expressed genes, and plotted them along with associated standard deviations.
Promoter enrichment analyses
We utilized the gold standard nucleosome calls of (Voong et al., 2016) to define +1 nucleosomes for all GENCODE-defined TSSs. We then used a custom Python script calling the PySAM API to tabulate all sequenced fragment midpoints in the vicinity of these TSSs, and stratified these by gene expression levels and sequenced fragment size. We then calculated local enrichment of midpoint coverage for each of these TSSs in a 2 kb window, by smoothing per-base midpoint coverages for each site using a 25 bp running mean, and then calculating the fold enrichment of smoothed midpoint coverage at each base with respect to the mean midpoint coverage in the 2 kb window surrounding the TSS. We then plotted the mean enrichment across all TSSs in ggplot2.
We processed paired-end ChIP-exo data by tabulating fragment ends, as is standard for ChIP-exo data with respect to these same features. Unlike most ChIP-exo datasets, these data were paired-end sequenced, allowing for filtration of long molecules likely consequent of crosslinking to adjacent nucleosomes, and short molecules that likely represent footprinting of Pol II or TFs.
TF enrichment and V-plot analyses
Gold-standard TF binding sites were calculated as follows: First, we collated existing callsets for the factors Ctcf, Rest, Nrf1, Yy1, Klf4, Sox2, Oct4, Esrrb, and c-Myc from multiple published sources (Yue et al., 2014; Domcke et al., 2015; Yu et al., 2011; Sigova et al., 2015; Chronis et al., 2017), calling peaks when necessary using MACS2 with default parameters. We then filtered all peak call-sets to remove sequences containing Ns, determined position weight matrices for each callset using MEME-ChIP, and ultimately tabulated all putative TF binding sites falling within peaks using FIMO. Finally, we filtered out all predicted binding sites falling within 2 kb of each other, and used these sets of binding sites for all subsequent analyses.
For all V-plot analyses, we used a custom Python script calling the PySAM API. For each TF, we took as input a list of binding sites centered at the factor’s motif and an sorted and indexed BAM file, and tabulated all sequenced fragments falling within a 2 kb window centered at the TF motif center. We then stratified these fragments by distance from the motif center, and fragment length, to generate a matrix where rows represent fragments lengths and columns represent fragment counts with respect to the motif center. Finally, we converted this matrix of raw counts into a z-score matrix, by computing length-specific z-scores signifying the enrichment of depletion of fragment midpoints with respect to the motif center, for each fragment length between 30 and 300 bp. These were visualized using the Matplotlib package in Python.
Site clustering
We employed the k-means clustering function of the scikit-learn package in Python to cluster Ctcf and Rest binding sites based on their per-site fragment midpoint enrichment patterns (as calculated above). We determined k = 3 using the “elbow” method (Thorndike, 1953).
Supplementary Material
KEY RESOURCES TABLE
| REAGENT or RESOURCE | SOURCE | IDENTIFIER |
|---|---|---|
| Chemicals, Peptides, and Recombinant Proteins | ||
| MNase | Sigma-Aldrich | Cat#N5386–200UN |
| Triton X-100 | Sigma-Aldrich | Cat#X100–5ML |
| Streptavidin MyOne Beads | Thermo-Fisher | Cat#65001 |
| CircLigase II | Lucigen | Cat# CL9025K |
| FastAP | Thermo-Fisher | Cat# EF0651 |
| Bst 2.0 DNA Polymerase | NEB | Cat#M0537 |
| KAPA Hi-Fi DNA Polymerase ReadyStart Mix | Roche | Cat# KK2602 |
| 1M Tris-HCl, pH 8.0 | Thermo-Fisher | Cat# AM9855G |
| 0.5M EDTA, pH 8.0 | Thermo-Fisher | Cat# 15575020 |
| 20% SDS | Thermo-Fisher | Cat# AM9820 |
| Tween-20 | Sigma-Aldrich | Cat# P9416–50ML |
| 20X SSC | Thermo-Fisher | Cat# 15557044 |
| T4 DNA ligase | Thermo-Fisher | Cat# EL0014 |
| 5M NaCl | Sigma-Aldrich | Cat# S6546–1L |
| Critical Commercial Assays | ||
| NextSeq 500 Sequencing Kit (75 cycles; 150 cycles) | Illumina | Cat# TG-160–2005; Cat# TG-160–2002 |
| MiSeq Sequencing Kits (150 cycles) | Illumina | Cat# MS-102–3001 |
| Deposited Data | ||
| MNase-SSP data | This study | GSE125053 |
| MNase-seq data | Carone et al., 2014 | GSE58101 |
| MNase-seq data | Ishii et al., 2015 | GSE69098 |
| ATAC-seq data | Giorgetti et al., 2016 | GSE71156 |
| Chemical cleavage mapping data | Voong et al., 2016 | GSE82127 |
| ENCODE mESC H3K27me3 | ENCODE Project | ENCFF339LRS |
| ENCODE mESC H3K27ac | ENCODE Project | ENCFF583TQN |
| ENCODE mESC H3K4me3 | ENCODE Project | ENCFF576PIA |
| ENCODE mESC H3K4me1 | ENCODE Project | ENCFF805KAU |
| ENCODE mESC H3K9me3 | ENCODE Project | ENCFF133QCX |
| ENCODE mESC CTCF | ENCODE Project | ENCFF508CKL |
| Rest TF ChIP-seq data | Yu et al., 2011 | GSE28289 |
| Yy1 TF ChIP-seq data | Sigova et al., 2015 | GSE68195 |
| Nrf1 TF ChIP-seq data | Domcke et al., 2015 | GSE67867 |
| Sox2, Oct4, Klf4, Esrrb, c-Myc ChIP-seq data | Chronis et al., 2017 | GSE90892 |
| Experimental Models: Cell Lines | ||
| Male Cast/129 F123 murine embryonic stem cell line | Gift of Disteche Lab | N/A |
| Female Cast/129 Tsix-Stop-F121 F121 murine embryonic stem cell line | Gift of Disteche Lab | N/A |
| Oligonucleotides | ||
| 5′ CGACGCTCTTC/3ddC/ 3′ | IDT | SSP_DS_Adaptor_1 |
| 5′/5Phos/GGAAGAGCGTCGTGTAGGGAAAGAG*T*G*T*A 3′ | IDT | SSP_DS_Adaptor_2 |
| /5Phos/AGATCGGAAG/iSp18//iSp18//3BioTEG/ | IDT | SSP_SS_Adaptor |
| GTGACTGGAGTTCAGACGTGTGCTCTTCCGATCT | IDT | Extension_Primer_CL9 |
| ACACTCTTTCCCTACACGACGCTCTTCC | IDT | Custom_Primer_ILMN_R1 |
| REAGENT or RESOURCE | SOURCE | IDENTIFIER |
| CAAGCAGAAGACGGCATACGAGAT[BARCODE]GTGACTGGAGTTCAGACGTGT | IDT | PCR_AMP_P7 |
| AATGATACGGCGACCACCGAGATCTACACTCTTTCCCTACACGACGCTCTT | IDT | PCR_AMP_P5 |
| Software and Algorithms | ||
| Bowtie2 | Langmead and Salzberg, 2012 | http://bowtie-bio.sourceforge.net/bowtie2/index.shtml |
| Samtools | Li et al., 2009 | http://samtools.sourceforge.net/ |
| Python 2.7.3 | https://www.python.org/download/releases/2.7.3/ | |
| Numpy, Scipy, Pandas via Anaconda | https://www.anaconda.com/ | |
| MNase-SSP GitHub Repo | This study | https://github.com/VRam142/MNase_SSP |
Highlights.
MNase-SSP decreases sequence bias and increases short DNA fragment representation
MNase-SSP captures subnucleosomal architecture and maps minimally protected fragments
Ctcf-bound short fragments distinguish different transcription factor binding modes
ACKNOWLEDGMENTS
The authors thank members of the Shendure lab (specifically A. Minkina and J. Tome), S. Kasinathan, S. Ramachandran, P. Skene, and S. Henikoff for discussion and comments on the manuscript. The authors also thank X. Deng, C. Disteche, and members of the Disteche lab for cell culture advice. This work was funded through grant DP1HG007811 to J.S. V.R. is funded through the generous support of the Sandler Foundation and the UC San Francisco Program for Breakthroughs in Biomedical Research. J.S. is an Investigator of the Howard Hughes Medical Institute.
Footnotes
SUPPLEMENTAL INFORMATION
Supplemental Information can be found with this article online at https://doi.org/10.1016/j.celrep.2019.02.007.
DECLARATION OF INTERESTS
The authors declare no competing interests.
DATA AND SOFTWARE AVAILABILITY
Data are available at GEO (accession GSE125053). All scripts used for data analysis are available at https://github.com/VRam142/MNase_SSP.
REFERENCES
- Bailey TL, Boden M, Buske FA, Frith M, Grant CE, Clementi L, Ren J, Li WW, and Noble WS (2009). MEME Suite: tools for motif discovery and searching. Nucleic Acids Res 37, W202–W208. [DOI] [PMC free article] [PubMed] [Google Scholar]
- Bernstein BE, Mikkelsen TS, Xie X, Kamal M, Huebert DJ, Cuff J, Fry B, Meissner A, Wernig M, Plath K, et al. (2006). A bivalent chromatin structure marks key developmental genes in embryonic stem cells. Cell 125, 315–326. [DOI] [PubMed] [Google Scholar]
- Brogaard K, Xi L, Wang J-P, and Widom J (2012). A map of nucleosome positions in yeast at base-pair resolution. Nature 486, 496–501. [DOI] [PMC free article] [PubMed] [Google Scholar]
- Buenrostro JD, Giresi PG, Zaba LC, Chang HY, and Greenleaf WJ (2013). Transposition of native chromatin for fast and sensitive epigenomic profiling of open chromatin, DNA-binding proteins and nucleosome position. Nat. Methods 10, 1213–1218. [DOI] [PMC free article] [PubMed] [Google Scholar]
- Cao J, Packer JS, Ramani V, Cusanovich DA, Huynh C, Daza R, Qiu X, Lee C, Furlan SN, Steemers FJ, et al. (2017). Comprehensive single-cell transcriptional profiling of a multicellular organism. Science 357, 661–667. [DOI] [PMC free article] [PubMed] [Google Scholar]
- Carone BR, Hung J-H, Hainer SJ, Chou M-T, Carone DM, Weng Z, Fazzio TG, and Rando OJ (2014). High-resolution mapping of chromatin packaging in mouse embryonic stem cells and sperm. Dev. Cell 30, 11–22. [DOI] [PMC free article] [PubMed] [Google Scholar]
- Chan PP, and Lowe TM (2009). GtRNAdb: a database of transfer RNA genes detected in genomic sequence. Nucleic Acids Res 37, D93–D97. [DOI] [PMC free article] [PubMed] [Google Scholar]
- Chronis C, Fiziev P, Papp B, Butz S, Bonora G, Sabri S, Ernst J, and Plath K (2017). Cooperative binding of transcription factors orchestrates reprogramming. Cell 168, 442–459. [DOI] [PMC free article] [PubMed] [Google Scholar]
- Cusanovich DA, Daza R, Adey A, Pliner HA, Christiansen L, Gunderson KL, Steemers FJ, Trapnell C, and Shendure J (2015). Multiplex single cell profiling of chromatin accessibility by combinatorial cellular indexing. Science 348, 910–914. [DOI] [PMC free article] [PubMed] [Google Scholar]
- de Dieuleveult M, Yen K, Hmitou I, Depaux A, Boussouar F, Bou Dargham D, Jounier S, Humbertclaude H, Ribierre F, Baulard C, et al. (2016). Genome-wide nucleosome specificity and function of chromatin remodellers in ES cells. Nature 530, 113–116. [DOI] [PMC free article] [PubMed] [Google Scholar]
- Dingwall C, Lomonossoff GP, and Laskey RA (1981). High sequence specificity of micrococcal nuclease. Nucleic Acids Res 9, 2659–2673. [DOI] [PMC free article] [PubMed] [Google Scholar]
- Domcke S, Bardet AF, Adrian Ginno P, Hartl D, Burger L, and Schu€beler D (2015). Competition between DNA methylation and transcription factors determines binding of NRF1. Nature 528, 575–579. [DOI] [PubMed] [Google Scholar]
- Gaffney DJ, McVicker G, Pai AA, Fondufe-Mittendorf YN, Lewellen N, Michelini K, Widom J, Gilad Y, and Pritchard JK (2012). Controls of nucleosome positioning in the human genome. PLoS Genet 8, e1003036. [DOI] [PMC free article] [PubMed] [Google Scholar]
- Gansauge M-T, and Meyer M (2013). Single-stranded DNA library preparation for the sequencing of ancient or damaged DNA. Nat. Protoc 8, 737–748. [DOI] [PubMed] [Google Scholar]
- Giorgetti L, Lajoie BR, Carter AC, Attia M, Zhan Y, Xu J, Chen CJ, Kaplan N, Chang HY, Heard E, and Dekker J (2016). Structural organization of the inactive X chromosome in the mouse. Nature 535, 575–579. [DOI] [PMC free article] [PubMed] [Google Scholar]
- Hashimoto H, Wang D, Horton JR, Zhang X, Corces VG, and Cheng X (2017). Structural basis for the versatile and methylation-dependent binding of CTCF to DNA. Mol. Cell 66, 711–720. [DOI] [PMC free article] [PubMed] [Google Scholar]
- He Q, Johnston J, and Zeitlinger J (2015). ChIP-nexus enables improved detection of in vivo transcription factor binding footprints. Nat. Biotechnol 33, 395–401. [DOI] [PMC free article] [PubMed] [Google Scholar]
- Henikoff S, Henikoff JG, Sakai A, Loeb GB, and Ahmad K (2009). Genome-wide profiling of salt fractions maps physical properties of chromatin. Genome Res 19, 460–469. [DOI] [PMC free article] [PubMed] [Google Scholar]
- Henikoff JG, Belsky JA, Krassovsky K, MacAlpine DM, and Henikoff S (2011). Epigenome characterization at single base-pair resolution. Proc. Natl. Acad. Sci. USA 108, 18318–18323. [DOI] [PMC free article] [PubMed] [Google Scholar]
- Hesselberth JR, Chen X, Zhang Z, Sabo PJ, Sandstrom R, Reynolds AP, Thurman RE, Neph S, Kuehn MS, Noble WS, et al. (2009). Global mapping of protein-DNA interactions in vivo by digital genomic footprinting. Nat. Methods 6, 283–289. [DOI] [PMC free article] [PubMed] [Google Scholar]
- Hewish DR, and Burgoyne LA (1973). Chromatin sub-structure. The digestion of chromatin DNA at regularly spaced sites by a nuclear deoxyribonuclease. Biochem. Biophys. Res. Commun 52, 504–510. [DOI] [PubMed] [Google Scholar]
- Ishii H, Kadonaga JT, and Ren B (2015). MPE-seq, a new method for the genome-wide analysis of chromatin structure. Proc. Natl. Acad. Sci. USA 112, E3457–E3465. [DOI] [PMC free article] [PubMed] [Google Scholar]
- Kasinathan S, Orsi GA, Zentner GE, Ahmad K, and Henikoff S (2014). High-resolution mapping of transcription factor binding sites on native chromatin. Nat. Methods 11, 203–209. [DOI] [PMC free article] [PubMed] [Google Scholar]
- Kirkland JG, Raab JR, and Kamakaka RT (2013). TFIIIC bound DNA elements in nuclear organization and insulation. Biochim. Biophys. Acta 1829, 418–424. [DOI] [PMC free article] [PubMed] [Google Scholar]
- Kubik S, Bruzzone MJ, Jacquet P, Falcone J-L, Rougemont J, and Shore D (2015). Nucleosome stability distinguishes two different promoter types at all protein-coding genes in yeast. Mol. Cell 60, 422–434. [DOI] [PubMed] [Google Scholar]
- Langmead B, and Salzberg SL (2012). Fast gapped-read alignment with Bowtie 2. Nature Methods 9, 357–359. [DOI] [PMC free article] [PubMed] [Google Scholar]
- Li TW, and Weeks KM (2006). Structure-independent and quantitative ligation of single-stranded DNA. Anal. Biochem 349, 242–246. [DOI] [PubMed] [Google Scholar]
- Li H, Handsaker B, Wysoker A, Fennell T, Ruan J, Homer N, Marth G, Abecasis G, and Durbin R; 1000 Genome Porject Data Processing Subgroup (2009). The Sequence Alignment/Map format and SAMtools. Bioinformatics 25, 2078–2079. [DOI] [PMC free article] [PubMed] [Google Scholar]
- Lobanenkov VV, Nicolas RH, Adler VV, Paterson H, Klenova EM, Polotskaja AV, and Goodwin GH (1990). A novel sequence-specific DNA binding protein which interacts with three regularly spaced direct repeats of the CCCTC-motif in the 5′-flanking sequence of the chicken c-myc gene. Oncogene 5, 1743–1753. [PubMed] [Google Scholar]
- Luikenhuis S, Wutz A, and Jaenisch R (2001). Antisense transcription through the Xist locus mediates Tsix function in embryonic stem cells. Mol. Cell Biol 21, 8512–8520. [DOI] [PMC free article] [PubMed] [Google Scholar]
- Marks H, Kerstens HHD, Barakat TS, Splinter E, Dirks RAM, van Mierlo G, Joshi O, Wang SY, Babak T, Albers CA, et al. (2015). Dynamics of gene silencing during X inactivation using allele-specific RNA-seq. Genome Biol 16, 149. [DOI] [PMC free article] [PubMed] [Google Scholar]
- Mawhinney MT, Liu R, Lu F, Maksimoska J, Damico K, Marmorstein R, Lieberman PM, and Urbanc B (2018). CTCF-induced circular DNA complexes observed by atomic force microscopy. J. Mol. Biol 430, 759–776. [DOI] [PMC free article] [PubMed] [Google Scholar]
- Mieczkowski J, Cook A, Bowman SK, Mueller B, Alver BH, Kundu S, Deaton AM, Urban JA, Larschan E, Park PJ, et al. (2016). MNase titration reveals differences between nucleosome occupancy and chromatin accessibility. Nat. Commun 7, 11485. [DOI] [PMC free article] [PubMed] [Google Scholar]
- Nakahashi H, Kieffer Kwon K-R, Resch W, Vian L, Dose M, Stavreva D, Hakim O, Pruett N, Nelson S, Yamane A, et al. (2013). A genome-wide map of CTCF multivalency redefines the CTCF code. Cell Rep 3, 1678–1689. [DOI] [PMC free article] [PubMed] [Google Scholar]
- Phillips JE, and Corces VG (2009). CTCF: master weaver of the genome. Cell 137, 1194–1211. [DOI] [PMC free article] [PubMed] [Google Scholar]
- Ramachandran S, and Henikoff S (2016). Transcriptional regulators compete with nucleosomes post-replication. Cell 165, 580–592. [DOI] [PMC free article] [PubMed] [Google Scholar]
- Ramachandran S, Ahmad K, and Henikoff S (2017). Transcription and remodeling produce asymmetrically unwrapped nucleosomal intermediates. Mol. Cell 68, 1038–1053. [DOI] [PMC free article] [PubMed] [Google Scholar]
- Ramani V, Deng X, Qiu R, Gunderson KL, Steemers FJ, Disteche CM, Noble WS, Duan Z, and Shendure J (2017). Massively multiplex single-cell Hi-C. Nat. Methods 14, 263–266. [DOI] [PMC free article] [PubMed] [Google Scholar]
- Rhee HS, and Pugh BF (2011). Comprehensive genome-wide protein-DNA interactions detected at single-nucleotide resolution. Cell 147, 1408–1419. [DOI] [PMC free article] [PubMed] [Google Scholar]
- Risca VI, Denny SK, Straight AF, and Greenleaf WJ (2017). Variable chromatin structure revealed by in situ spatially correlated DNA cleavage mapping. Nature 541, 237–241. [DOI] [PMC free article] [PubMed] [Google Scholar]
- Rizzo JM, Bard JE, and Buck MJ (2012). Standardized collection of MNase-seq experiments enables unbiased dataset comparisons. BMC Mol. Biol 13, 15. [DOI] [PMC free article] [PubMed] [Google Scholar]
- Shema E, Jones D, Shoresh N, Donohue L, Ram O, and Bernstein BE (2016). Single-molecule decoding of combinatorially modified nucleosomes. Science 352, 717–721. [DOI] [PMC free article] [PubMed] [Google Scholar]
- Sigova AA, Abraham BJ, Ji X, Molinie B, Hannett NM, Guo YE, Jangi M, Giallourakis CC, Sharp PA, and Young RA (2015). Transcription factor trapping by RNA in gene regulatory elements. Science 350, 978–981. [DOI] [PMC free article] [PubMed] [Google Scholar]
- Skene PJ, and Henikoff S (2015). A simple method for generating high-resolution maps of genome-wide protein binding. eLife 4, e09225. [DOI] [PMC free article] [PubMed] [Google Scholar]
- Skene PJ, and Henikoff S (2017). An efficient targeted nuclease strategy for high-resolution mapping of DNA binding sites. eLife 6, 576. [DOI] [PMC free article] [PubMed] [Google Scholar]
- Snyder MW, Kircher M, Hill AJ, Daza RM, and Shendure J (2016). Cell-free DNA comprises an in vivo nucleosome footprint that informs its tissues-of-origin. Cell 164, 57–68. [DOI] [PMC free article] [PubMed] [Google Scholar]
- Struhl K, and Segal E (2013). Determinants of nucleosome positioning. Nature Structural & Molecular Biology 20, 267–273. [DOI] [PMC free article] [PubMed] [Google Scholar]
- Sulkowski E, and Laskowski M Sr.. (1962). Mechanism of action of micrococcal nuclease on deoxyribonucleic acid. J. Biol. Chem 237, 2620–2625. [PubMed] [Google Scholar]
- Teif VB, Vainshtein Y, Caudron-Herger M, Mallm J-P, Marth C, Höfer T, and Rippe K (2012). Genome-wide nucleosome positioning during embryonic stem cell development. Nat. Struct. Mol. Biol 19, 1185–1192. [DOI] [PubMed] [Google Scholar]
- Thorndike RL (1953). Who belongs in the family? Psychometrika 18, 267–276. [Google Scholar]
- Tullius TD (1988). DNA footprinting with hydroxyl radical. Nature 332, 663–664. [DOI] [PubMed] [Google Scholar]
- Valouev A, Johnson SM, Boyd SD, Smith CL, Fire AZ, and Sidow A (2011). Determinants of nucleosome organization in primary human cells. Nature 474, 516–520. [DOI] [PMC free article] [PubMed] [Google Scholar]
- Voong LN, Xi L, Sebeson AC, Xiong B, Wang J-P, and Wang X (2016). Insights into nucleosome organization in mouse embryonic stem cells through chemical mapping. Cell 167, 1555–1570. [DOI] [PMC free article] [PubMed] [Google Scholar]
- Weber CM, Ramachandran S, and Henikoff S (2014). Nucleosomes are context-specific, H2A.Z-modulated barriers to RNA polymerase. Mol. Cell 53, 819–830. [DOI] [PubMed] [Google Scholar]
- Williamson R (1970). Properties of rapidly labelled deoxyribonucleic acid fragments isolated from the cytoplasm of primary cultures of embryonic mouse liver cells. J. Mol. Biol 51, 157–168. [DOI] [PubMed] [Google Scholar]
- Yu H-B, Johnson R, Kunarso G, and Stanton LW (2011). Coassembly of REST and its cofactors at sites of gene repression in embryonic stem cells. Genome Res 21, 1284–1293. [DOI] [PMC free article] [PubMed] [Google Scholar]
- Yue F, Cheng Y, Breschi A, Vierstra J, Wu W, Ryba T, Sandstrom R, Ma Z, Davis C, Pope BD, et al. ; Mouse ENCODE Consortium (2014). A comparative encyclopedia of DNA elements in the mouse genome. Nature 515, 355–364. [DOI] [PMC free article] [PubMed] [Google Scholar]
Associated Data
This section collects any data citations, data availability statements, or supplementary materials included in this article.