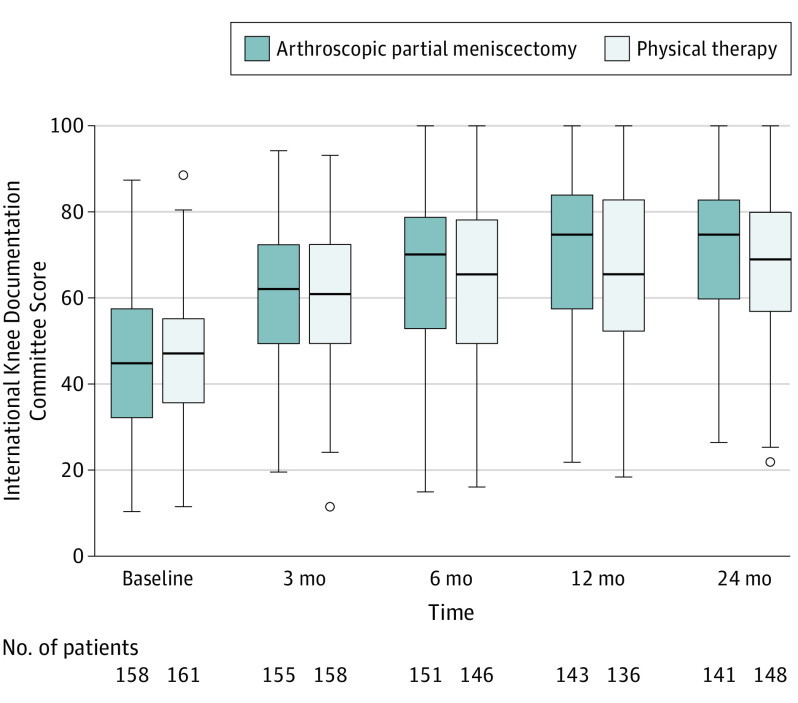
Figure 2. Distribution of International Knee Documentation Committee (IKDC) Score of Knee Function.
The figure represents the results of the primary outcome knee function on the IKDC (range, 0 to 100; from worse to best) for intention-to-treat analysis. The data represent actual patient data at each time. In each comparison, the box indicates the range between the 25th and 75th percentile, with the median indicated as a horizontal line within the box. The whiskers extend to the upper and lower adjacent values, the most extreme values that are within 1.5 × interquartile range (IQR) beyond the 26th and 75th percentiles. Circles indicate points beyond these values. The median IKDC data are in eTable 5 in Supplement 2.

