

Abstract
Objective: Study of the nutrition pathway for lumbar intervertebral disk cartilage of normal goats.
Methods: Four lumbar intervertebral disks from each of eight 24‐month‐old goats (32 disks) were studied. After the goats had been anesthetized, signal intensity changes in the regions of interest (ROI) were observed by dynamic contrast enhanced magnetic resonance scanning. Before and after enhancement at the time points of 0, 5, 10, and 30 mins, and 1.0, 1.5, 2.0, 2.5, 3.0, and 3.5 hs, the ROI signal intensity was measured, and the time‐signal intensity curve and peak times analyzed.
Results: Signal intensity in the vertebral bodies reached a peak at 0 min and decreased quickly thereafter. Signal intensity in the cartilage endplate zones reached the first peak at 30 mins and then went down slightly before increasing to a second peak at 2 hs. Signal intensity in the nuclei pulposus was negative within 5 mins, increased slowly to a peak at 2 hs, and declined thereafter.
Conclusion: Nutrient metabolism of the lumbar intervertebral disks of normal goats occurs mainly through the cartilage end‐plate pathway.
Keywords: Gadolinium diethylenetriamine penta‐acetic acid, Goats, Intervertebral disk, Magnetic resonance imaging
Introduction
Protrusion of the nucleus pulposus, facet joint degeneration, spinal instability, and spinal canal stenosis caused by disk degeneration often lead to lumbar and leg pain and cause physical and psychological suffering and economic burdens for affected patients 1 , 2 . Many studies have shown that disk degeneration is related to reduced supply of nutrition, apoptosis imbalance, changes in the activity of matrix enzymes, biomechanics and autoimmune reactions 3 , 4 , 5 , 6 .
Reduction in supply of nutrient substances has been considered to be the main factor resulting in eventual development of disk degeneration 7 . Numerous studies have shown that nutrition of intervertebral disks is obtained mainly through the endplates, and that there is a close relationship between degeneration of endplates and that of intervertebral disks 8 , 9 .
Tissue engineering and gene therapy studies of the disk area have become keys to investigating how intervertebral disks obtain nutrients. However, understanding of the complexities of disk nutrition in humans is not enough 10 , 11 . Therefore, studies of disk nutrition in animals may help us to learn more about this topic.
However, after unilaterally obstructing the nutrition pathway for endplates in dogs for 70 weeks, Hutton et al. found that, in most cases, degeneration of the intervertebral disks had not occurred 12 . Therefore, further study of the relationship between the nutrition pathway of the cartilage endplates of intervertebral disks and their degeneration is necessary. Because it requires dissection of the dogs' lumbar transverse arteries, it is not feasible to establish a model of bilateral blocking of the nutrition of the end‐plate. Therefore, it became necessary to choose a new experimental animal for studying the nutrition pathway for lumbar intervertebral disk cartilage and further establishing animal models for researching the relationship between nutrition and disk degeneration.
Dynamic contrast‐enhanced MRI (DCE‐MRI) scans are a non‐invasive and reproducible method that has been used to study the nutrition mechanism of disks 13 . Using DCE‐MRI techniques, Rajasekaran et al. observed lumbar intervertebral disks in 150 individuals continuously for 24 hs to study the diffusion process of contrast agents in various parts of the disks 14 . Through non‐invasive study by DCE‐MRI of normal goat lumbar disks, the purpose of the present research was to study the nutrition pathway of normal goat vertebral endplates.
Materials and methods
Experimental animals
Eight healthy adult goats (average age, 24 ± 2.1 months, average weight, 41.3 ± 5.1 kg) were provided by the Animal Center of the Medical School of Xi'an Jiaotong University. The sample goats were fed by members of the Xi'an Jiaotong University Animal Experimentation Committee for 2 weeks under standard rearing conditions. The protocols for all animals used in the current study were approved by the Xi'an Jiaotong University Animal Experimentation Committee and performed under the Xi'an Jiaotong University Guidelines for Animal Experimentation.
Instruments and methods
The Philips Intera Achieva 1.5 T MRI system dual‐gradient (Best, the Netherlands) was used in this experiment. The animals were fasted for 24 hs preoperatively and atropine 0.03–0.05 mg/kg was given by i.m. injection 20–30 mins before surgery. After Sumianxin (a combination of haloperidol and dihydroetorphine, 0.3 ml/kg body weight) had been given to the sample goats by i.m. injection for basic anesthesia, continuous ear vein infusion of propofol (2 mg/kg) was given to maintain adequate anesthesia, and tracheal intubation performed. A syringe containing 50 ml of pure water was placed in the lumbar dorsal region as a water model. A SENSE body coil for measuring phase resonance was wrapped on the goats at the lumbar level with the goats in a lateral position and the caudal end applied first and was used for surface location. Firstly, T2WI‐TSE‐SPAIR (repetition time/ echo time [TR/TE]= 3500 ms/60 ms, slices of thickness/gab = 4.0 mm/0.6 mm, scan time 3 mins 31 secs) were scanned. Next, after excluding disk degeneration deformity in the scan field region, sagittal T1‐TSE‐SPIR (TR/TE = 400 ms/7.8 ms, slice thickness/gab = 4.0 mm/0.6 mm, scan time 3 mins 31 seconds) were scanned. After line DCE‐MRI had been performed, gadobenate dimeglumine (Gd‐BOPTA) (ionic, molecular weight 1058.17), which enhances contrast, was given by ear vein catheter injection (dose 0.3 mmol/kg). Taking the time of contrast media injection as 0 min, and the scanning sequence for the sagittal T1‐TSE‐SPIR at 0 min, 5 mins, 10 mins, 30 mins, 1.0 h, 1.5 hs, 2.0 hs, 2.5 hs, 3.0 hs, and 3.5 hs, the variables were the same as for the non‐enhanced scan. The whole process of the experiment lasted for 5–7 hs.
Analysis
After scanning, the median sagittal lumbar level was selected. Regions of interest (ROI) were selected corresponding to five regions, namely the upper and lower vertebral bodies, the upper and lower cartilage endplate zones, and the nuclei pulposus (Fig. 1). In accordance with the shape of the observation site, the ROI of the vertebral and endplate zones selected the rectangle, and the numbers of pixels were 80 and 12, respectively. The oval was selected for the ROI of the nucleus area and the number of pixels was 16. The rectangular ROI was placed in the water mold area and the number of pixels was around 100. Attempts were made to avoid a partial volume effect when selecting these ROI. Within the same window width and window level, the six ROI signal intensity values for each vertebral disk, shown clearly under different time scan fields, were measured and recorded.
Figure 1.

Region of interest were selected corresponding to five regions, namely the upper and lower vertebral bodies, upper and lower cartilage endplate zones, and nuclei pulposus.
Statistical analysis
SPSS software 13.0 (SPSS, Chicago, IL, USA) was used for statistical analysis; the mean ± SD was used to show dispersion of the data. By analyzing the signal intensity changes of the water model, it was possible to confirm that the measured data was in a stable magnetic field, which ensured that the research data was statistically significant.
Results
Nucleus pulposus
In the scan fields, the 32 nuclei pulposus of eight goats were all shown clearly and no malformation of them was identified. Lumbar disks with degeneration in the nuclei pulposus were sampled in this study.
Observations on the morphology of normal goat vertebral disks
The T2WI‐TSE‐SPAIR sequences showed uniformly high signals of the nuclei pulposus, which are oval in shape. The peripheral fibroid annuli and cartilage endplates showed low signals (Fig. 2A). The normal disks could be seen in the T1‐TSE‐SPIR sequences, and were similar to those displayed in the T2‐TSE‐SPAIR sequences. Low signal area bands, which are cartilage endplate zones, could be seen between the vertebrae and nuclei pulposus (Fig. 2B). After MRI scan with injection of Gd‐BOPTA, the T1‐TSE‐SPIR sequences in the sagittal plane showed no enhanced signals on the nuclei pulposus, while the vertebral bodies were significantly enhanced, and the transverse lumbar arteries could be seen (Fig. 2C).
Figure 2.
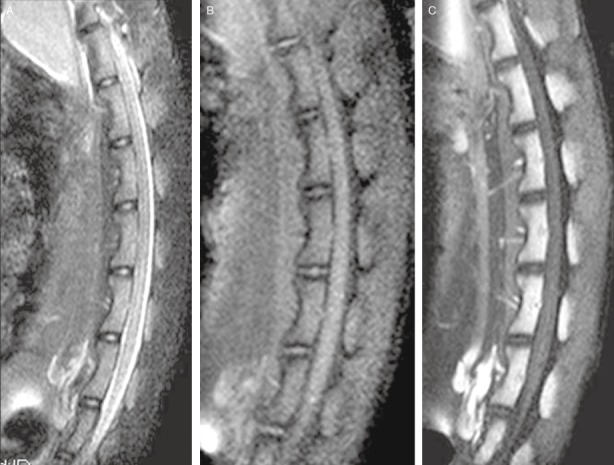
Observation of the morphology of normal goat vertebral disks (A) T2‐TSE‐SPAIR sequence: the nuclei pulposus show high intensity, and the peripheral fibrous rings and cartilage endplates low intensity. (B) T1‐TSE‐SPIR sequence: the vertebral disks show isointensity, and the nuclei pulpous and fibroid annuli are difficult to e distinguish from each other. (C) T1‐TSE‐SPIR sequence after the injection of Gd‐BOPTA: the nuclei pulposus are not enhanced, whereas the vertebral bodies are significantly enhanced. The transverse lumbar arteries can be seen entering the vertebrae.
Dynamic enhancement changes in each region
After injecting Gd‐BOPTA, the signal intensity on the upper and lower vertebra bodies reached a peak at 0 min, and then declined rapidly until beginning to increase again at 1 h to a second peak, which was lower than the first one, at 2 hs, and thereafter gradually decreased. The change trend of the signal intensity on the upper and lower vertebral bodies was consistent. The signal intensity on the upper and lower cartilage endplate zones slowly increased to a moderate peak at 10 mins. After decreasing slightly, it then rapidly increased, reaching a second peak at 2 hs. The curves of the upper and lower cartilage endplate zones did not overlap and the signal intensity on the area under the cartilage endplates was higher than the superior endplate zones. The signal intensity on the nuclei pulposus appeared as a negative value at 5 mins, and then slowly increased, the increase acceleratingt at 30 mins, and reaching a peak at 2 hs, after which it gradually declined (3, 4).
Figure 3.

Enhanced T1‐SPIR sequences showing the dynamic MR changes at different time points (A) pre‐injection of Gd‐BOPTA; (B) at 0 mins; (C) at 5 mins; (D) at 10 mins; (E) at 30 mins; (F) at 1.0 h; (G) at 1.5 hs; (H) at 2.0 hs; (I) at 2.5 hs; and (J) at 3 hs.
Figure 4.
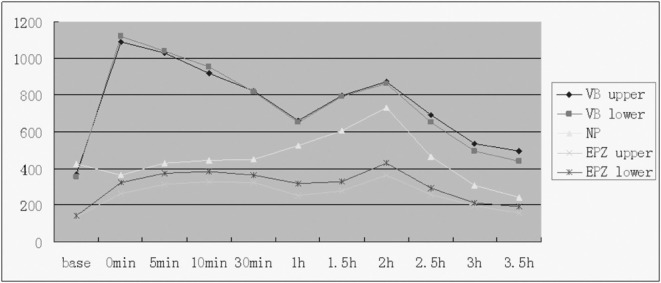
The time‐signal intensity of five ROIs. EPZ, end plate zone; NP, nucleus pulposus; VB, vertebral body.
Discussion
This research employed DCE‐MRI techniques to study the nutrition pathway of normal goat vertebral endplates. The goats tolerated the procedures well. This experiment proved that the lumbar vertebral transverse arteries of goats enter the vertebrae at their center, which provides an experimental basis for establishing animal models of bilateral blocking of the nutritional pathway to the endplates in goats. In this experiment we used DCE‐MRI techniques to study the metabolic process and characteristics of Gd‐BOPTA in goat lumbar intervertebral disks relatively completely. We propose that nutrient metabolism of the lumbar intervertebral disks of normal goats occurs mainly through cartilage end‐plate pathways.
The earliest study on the nutritional pathway of the intervertebral disk was carried out by infusing fluorescent or radioactive markers into animal disks, the markers being found to permeate the disks from the peripheral tissues of the vertebral bodies and annuli fibrosis. In the last few years, some studies have applied MRI techniques in studying the nutrition path of disks 15 , 16 . DCE‐MRI measures the speed of permeation and quantity of paramagnetic contrast agents in the disks, reflecting the nutrition diffusion process. Because the method can be conducted in vivo, it has the advantages of being reproducible and noninvasive, as well as allowing quantitative analysis and producing practical results.
We chose goats as an animal model for studying the nutritional pathway of intervertebral disks in vivo. In order to be sure that the model was comparable with humans in respect to the anatomy of the intervertebral disk and its degeneration process, we sought to satisfy the following requirements. Firstly, the histologic characteristics of degeneration and morphologic characteristics of disk herniation should be reproduced. Secondly, the model should be reproducible. Thirdly, the anatomical and physiological characteristics of the selected animals should be as similar to humans as possible. The ideal degeneration model would use primates (monkeys), because they are most similar to humans 17 . With their close evolutionary and genetic relationship with humans, monkeys have lumbar disks which have similar biochemical and mechanical properties to those of humans. Therefore, monkeys are ideal animals for establishing an intervertebral disk degeneration model 18 . However, economic and legal factors limit the choice of monkeys. Over the last 10 years, fairly big animals such as the pig, goat and dog have been selected for studying disk herniation and degeneration 19 , 20 . Besides their advantages of having gentle characters, being easy to feed and control, costing relatively little to obtain and feed, being large in size, and being suitable for obtaining repeated blood, urine and tissue samples, goats can tolerate having DCE‐MRI performed during long periods of anesthesia, and the imaging data are clear and easy to distinguish. The present experiment lasted 5 to 7 hs, and the goats showed good tolerance. Twenty‐four‐month‐old goats, which correspond to adolescents, were selected for this study, because at this age their intervertebral disk structure is stable, and has not begun to degenerate.
The time‐signal intensity curves of goat's vertebral bodies are similar to those of humans 13 , 14 . There are two pathways by which MR contrast agent reaches vertebral bodies after it been administered i.v.: starting from a branch of the spinal artery to the posterior center of the vertebral bodies, and starting from branches of the lumbar and intercostal arteries to their anterior lateral aspects. After entering the vertebral bodies the vessels are distributed horizontally into their centers. Branch‐like tributaries spread radially in upper and lower directions after anastomosing with each other, and extend to both ends of the vertebral bodies. Then they anastomose at the endplates and inferiorly, forming vascular loops 21 . Therefore, once the contrast agent has arrived at the vertebral bodies, the nuclear MR signal intensity reaches a peak immediately and falls off gradually as its plasma concentration changes. One h later, the curve starts to increase again, reaching a second peak at 2 hs, which might be due to the mixing of contrast agent with metabolic products of the nuclei pulposus and reaching the vertebral bodies in a reverse manner via their endplates. The second peak is significantly lower than the first one.
The nutrition of the goat lumbar endplate zones is influenced by the anatomical structure and metabolism of the nuclei pulposus. The vessels of the vertebral bodies anastomose to vascular loops at the endplates and inferior to them, then extend to the cartilage endplates and form vascular buds, the number determining the permeability of the cartilage endplates 22 . In the central area of the cartilage endplates, the vascular buds are enlarged and overlap, so their contact surface is large and the permeability high. However, because the peripherally located vascular buds are separate loops, their contact surface is smaller and permeability lower. By diffusion, the nutritional ingredients in capillaries permeate the hyaline cartilage endplates (the convection mechanism is relatively minor), and then reach the extracellular matrix of the intervertebral disks. After infusion of contrast agent, the time‐signal intensity curve of the endplates increase steadily, reaching the first peak within 10 mins, then decreasing slightly. One h later the curve rises quickly and reaches a second peak at 2 hs, then declines rapidly. The second peak is significantly higher and steeper than the first one. The reason for the curve changing in this way might be that the small blood vessel diameter of the vascular buds at the vertebral and cartilage endplates results in a decrease in the speed at which contrast agent enters the vertebral sinuses. Accordingly, the concentration and rate of increase of contrast agent at the endplates are lower than at the vertebral bodies. The time‐signal intensity curve at endplate rises slightly and reaches the smaller peak at 10 mins. Later, because of a delay in diffusion and rapid decline in plasma concentration, the concentration of contrast decreases at the endplates. Therefore, the rate of change of the curve slows down, while maintaining a higher level. With contrast agent entering in the nuclei pulposus and some of the contrast agent being metabolized, the curve rises again 1 h later and reaches a dynamic equilibrium to form the second peak. After this, contrast agent entering the nuclei pulposus decreases markedlydue to it being increasingly metabolized, the curve begins to decline.
In addition, the time‐signal intensity curve of the nuclei pulposus below the horizontal axis within 10 mins; the mechanism for this is hard to define. A possible reason is that the vertebral bodies and endplates are intensified in 10 mins and the molecular concentration of gadodiamide reaches a certain level in them. However, the molecular concentration of gadodiamide in the nuclei pulposus at this stage is rather low. The enhancement effect of contrast agent in the vertebral bodies and endplates may produce “negative interference” on the contrast agent in the nuclei pulposus. This would result in a decline in the signal intensity of the nuclei pulposus. The mechanism needs to be further studied. After i.v. injection of Gd‐BOPTA, rapid enhancement occurs for 30 mins, the intensity reaching a peak at 2 hs. It then declines gradually, still being above the baseline at 4 hs. The increase in nucleus pulposus intensity occurs after the dispersal peak of the endplates has occurred, which indicates that the nutritional ingredients are obtained mainly by dispersal from the endplates. Since the metabolism of the nuclei pulposus is slow, the intensity there is still above the baseline at 4 hs, although there is a clear trend to decline. These data suggest that obtaining of nutrition from the nucleus pulposus is a slow process.
The time‐intensity curve of the nuclei pulposus in goats is similar to that reported by Rajasekaran et al., who studied the dispersal of nutritional ingredients in human intervertebral disks with MRI 13 , 14 . This shows that the nutrition pathway of goat intervertebral disks is similar to that of humans. However, in contrast to the time‐intensity curve obtained by Rajasekaran et al., in the present experiment the peak of the nuclei pulposus occurred at 2 hs (earlier than in Rajasekaran et al.'s study), after which it immediately began to decrease. There are two possible reasons for this difference. Firstly, the cartilage endplates (cell layers) of goats are thinner than those of humans and the nuclei pulposus are notably smaller, so the contrast agent would more easily saturate them and reach its peak earlier. Secondly, the contrast agent used in the present experiment was Gd‐BOPTA, which contains phenoxy and is a lipophilic aromatic compound. BecauseGd‐BOPTA binds to plasma proteins, especially albumin, its clearance rate is significantly faster than that of other MRI contrast agents 23 . De Haën et al. indicated that the benzene ring plays a regulatory role in Gd‐BOPTA metabolism, enabling liver cells to absorb the Gd‐BOPTA molecule selectively and excrete it via the biliary tree 24 . The absorption mechanism is the same as for bilirubin metabolism; that is absorption and excretion occur through multi‐specific organic anion transport channels in the liver cell membranes. It has been suggested that Gd‐BOPTA may be related to the metabolism of proteoglycan with higher fixed negative charge in the nucleus pulposus, but further studies are needed for clarifying these mechanisms.
In this study a water phantom was used to rectify measurement of signal intensity, because signal intensity of tissues can be influenced by the stability of MR equipment. The goats were under anesthesia and coils were wrapped around their bodies. Because the experiment lasted several hs, body temperature and sweat would have caused some interference to the magnetic field. Therefore, a water phantom was necessary to enable calculation of exact values.
In conclusion, the present experiment studies the process of nutritional ingredients entering, and metabolic wastes being excreted from, goat intervertebral disks. It has clarified the nutrition pathway of goat lumbar intervertebral disk cartilage end‐plates and its significance. The current study provides a basis for the establishment of an animal model for bilateral blocking of the nutritional pathway of the goat's endplates and future related research on the relationship between nutrition and metabolism in this region.
References
- 1. Adams MA, Roughley PJ. What is intervertebral disk degeneration, and what causes it? Spine, 2006, 31: 2151–2161. [DOI] [PubMed] [Google Scholar]
- 2. Andersson GB. Epidemiology of low back pain. Acta Orthop Scand Suppl, 1998, 281: 28–31. [DOI] [PubMed] [Google Scholar]
- 3. Adams MA, Freeman BJ, Morrison HP, et al Mechanical initiation of intervertebral disk degeneration. Spine, 2000, 25: 1625–1636. [DOI] [PubMed] [Google Scholar]
- 4. Gruber HE, Hanley EN Jr. Recent advances in disk cell biology. Spine, 2003, 28: 186–193. [DOI] [PubMed] [Google Scholar]
- 5. Nerlich AG, Schleicher ED, Boos N. 1997 Volvo Award winner in basic science studies. immunohistologic markers for age‐related changes of human lumbar intervertebral discs. Spine, 1997, 22: 2781–2795. [DOI] [PubMed] [Google Scholar]
- 6. Boos N, Weissbach S, Rohrbach H, et al Classification of age‐related changes in lumbar intervertebral discs: 2002 Volvo Award in basic science. Spine, 2002, 27: 2631–2644. [DOI] [PubMed] [Google Scholar]
- 7. Buckwalter JA. Aging and degeneration of the human intervertebral disc. Spine, 1995, 20: 1307–1314. [DOI] [PubMed] [Google Scholar]
- 8. Horner HA, Urban JP. 2001 Volvo Award winner in basic science studies: effect of nutrient supply on the viability of cells from the nucleus pulposus of the intervertebral disc. Spine, 2001, 26: 2543–2549. [DOI] [PubMed] [Google Scholar]
- 9. Benneker LM, Heini PF, Alini M, et al 2004 Young Investigator Award Winner: vertebral endplate marrow contact channel occlusions and intervertebral disk degeneration. Spine, 2005, 30: 167–173. [DOI] [PubMed] [Google Scholar]
- 10. Cassinelli EH, Hall RA, Kang JD. Biochemistry of intervertebral disk degeneration and the potential for gene therapy applications. Spine J, 2001, 1: 205–214. [DOI] [PubMed] [Google Scholar]
- 11. Nishida K, Gilbertson LG, Evans CH, et al Spine update: potential applications of gene therapy to the treatment of spinal disorders. Spine, 2000, 25: 1308–1314. [DOI] [PubMed] [Google Scholar]
- 12. Hutton WC, Murakami H, Li J, et al The effect of blocking a nutritional pathway to the intervertebral disk in the dog model. J Spinal Disord Tech, 2004, 17: 53–63. [DOI] [PubMed] [Google Scholar]
- 13. Rajasekaran S, Naresh‐Babu J, Murugan S. Review of postcontrast MRI studies on diffusion of human lumbar discs. J Magn Reson Imaging, 2007, 25: 410–418. [DOI] [PubMed] [Google Scholar]
- 14. Rajasekaran S, Babu JN, Arun R, et al ISSLS prize winner: a study of diffusion in human lumbar discs: a serial magnetic resonance imaging study documenting the influence of the endplate on diffusion in normal and degenerate discs. Spine, 2004, 29: 2654–2667. [DOI] [PubMed] [Google Scholar]
- 15. Urban JP, Smith S, Fairbank JC. Nutrition of the intervertebral disc. Spine, 2004, 29: 2700–2709. [DOI] [PubMed] [Google Scholar]
- 16. Urban MR, Fairbank JC, Etherington PJ, et al Electrochemical measurement of transport into scoliotic intervertebral disks in vivo using nitrous oxide as a tracer. Spine, 2001, 26: 984–990. [DOI] [PubMed] [Google Scholar]
- 17. Singh K, Masuda K, An HS. Animal models for human disk degeneration. Spine J, 2005, 5 (Suppl.): S267–S279. [DOI] [PubMed] [Google Scholar]
- 18. Lauerman WC, Platenberg RC, Cain JE, et al Age‐related disk degeneration: preliminary report of a naturally occurring baboon model. J Spinal Disord, 1992, 5: 170–174. [PubMed] [Google Scholar]
- 19. Cinotti G, Della Rocca C, Romeo S, et al Degenerative changes of porcine intervertebral disk induced by vertebral endplate injuries. Spine, 2005, 30: 174–180. [DOI] [PubMed] [Google Scholar]
- 20. Holm S, Holm AK, Ekström L, et al Experimental disk degeneration due to endplate injury. J Spinal Disord Tech, 2004, 17: 64–71. [DOI] [PubMed] [Google Scholar]
- 21. Kurunlahti M, Kerttula L, Jauhiainen J, et al Correlation of diffusion in lumbar intervertebral disks with occlusion of lumbar arteries: a study in adult volunteers. Radiology, 2001, 221: 779–786. [DOI] [PubMed] [Google Scholar]
- 22. Roberts S, Menage J, Urban JP. Biochemical and structural properties of the cartilage end‐plate and its relation to the intervertebral disc. Spine, 1989, 14: 166–174. [DOI] [PubMed] [Google Scholar]
- 23. de Haën C, Lorusso V, Tirone P. Hepatic transport of gadobenate dimeglumine in TR‐rats. Acad Radiol, 1996, 3 (Suppl. 2): S452–S454. [DOI] [PubMed] [Google Scholar]
- 24. de Haën C, La Ferla R, Maggioni F. Gadobenate dimeglumine 0.5 M solution for injection (MultiHance) as contrast agent for magnetic resonance imaging of the liver: mechanistic studies in animals. J Comput Assist Tomogr, 1999, 23 (Suppl. 1): S169–S179. [DOI] [PubMed] [Google Scholar]