Abstract
In the field of biomedicine, there are optical systems that provide the tissue metabolic rate of oxygen consumption (tMRO2) by the simultaneous measurement of blood flow and oxygenation level. However, current optical systems are costly and require complex optical alignments, which are inconvenient for clinical applications. Therefore, in this study, we developed a simple diffuse optical metabolic spectroscopy system by combining a broadband light source and a laser and by sharing a spectrometer as a detector for both diffuse optical spectroscopy and diffuse speckle contrast analysis. This system simultaneously measures blood flow, volume, and oxygenation in a simple and cost-effective manner. The system response to flow is demonstrated through the flow phantom experiments. The results of the experiments show that flow response is in the range 0~0.9 ml/min, with a resolution better than 0.1 ml/min. During the blood phantom study, the blood volume fraction increased linearly with blood accumulation. Further, the change in oxygenation was monitored with the modulation of the oxygen level in the gas supply. Finally, tMRO2 changes were measured during ischemia, induced by the upper arm cuff and the results showed a decrease and a recovery of tMRO2 with cuff inflation and deflation, respectively. This simple diffuse optical metabolic spectroscopic system can easily be applied in medical environments by providing a simple and convenient solution for measuring tMRO2.
1. Introduction
Over the last few decades, the diffuse optical techniques have been widely adopted in the biomedical field and demonstrates significant impact on the diagnosis of the stroke [1], cancer [2–5], and erectile dysfunction [6]. The basic function of diffuse optical systems is to either provide a blood flow information by monitoring speckle pattern alternations using coherent light [7] or provide blood volume and oxygenation level by measuring the attenuation of light intensity passing through the tissue at multi-wavelengths [8]. The main output of diffuse optical systems involves the relative changes in tissue metabolic rate [8,9]. However, a single diffuse optical system cannot estimate the accurate metabolic rate of tissue because the individual measurement of blood flow, oxygenation, and volume are not enough to access the metabolic rate due to complementary responses to each other [10–12]. Therefore, to estimate tissue metabolic rate, the simultaneous measurement of blood flow, volume, and oxygenation level has to be performed at once.
Recently, The advanced diffuse optical system that simultaneously records the speckle pattern alternations and lights attenuations at multi-wavelength by tissue, such as DW-LSCI [13,14], DCS-NIRS [15], DSCA-NIRS [16], LSI-SFDI [17], and PPG-LSCI [18] (DW-LSCI: dual-wavelength laser speckle contrast imaging, DCS: diffuse correlation spectroscopy, NIRS: near-infrared spectroscopy, DSCA: diffuse speckle contrast analysis, LSI: laser speckle imaging, SFDI: spatial frequency domain imaging, PPG: photo-plethysmography and LSCI: Laser speckle contrast imaging) have been developed to concurrently measure the blood flow and the oxygenation.
However, current combined diffuse optical systems are costly and require complex light alignments with precisely fixed optical components, which are difficult to apply in the clinical studies. Therefore, in this study, we proposed a development of diffuse optical metabolic spectroscopy based on diffuse optical spectroscopy (DOS) and DSCA combined system to calculate tissue metabolic rate of oxygen consumption (tMRO2) by the simultaneous measurement of the blood flow, blood volume, and the oxygenation level in simple and cost-effective manner.
2. Material and methods
2.1 Diffuse optical spectroscopy
The DOS system has been applied to measure the biological chromophores of tissue [19,20] by fitting the measured spectrum to analytical photon diffusion model in a turbid media. The analytical model that was derived by Farrell’s study delineates the diffuse reflected light from the illuminated position to detected position, depending on absorption and scattering coefficients of a media [21]. (Eq. (1)
| (1) |
where μa, μs’, μeff = [3 μa (μa + μs’)]1/2 and ρ represent absorption coefficients, reduced scattering coefficients, effective attenuation coefficients, and source-detector separation distance, respectively. In theory, the extrapolated boundary condition is zb = 2AD, where A is internal reflection related parameter (in this study, A is equal to 1 same as Nachabé’s study [5,19]), and D = [3 (μa + μs’)]−1 is diffusion coefficients. A point source is located at z0 = (μa + μs’)−1 below the surface while the imaginary source is located at z0 + 2zb on the top of the surface. Therefore, the photon pathlength from a point source (z0) and imaginary source (z0 + 2zb) can be expressed by r1 = (z02 + ρ2)1/2 and r2 = [(z0 + 2z0)2 + ρ2]1/2, respectively.
The Eq. (2) and Eq. (3) describe the light absorption and the scattering of tissue. The absorption coefficients of tissue are expressed as a combination of blood volume fraction (v), oxygenation (StO2), oxyhemoglobin and deoxyhemoglobin extinction coefficients (εoxy and εdeoxy), which are strongest absorbers in the tissue in a visible range [19,22].
| (2) |
Where, λ and C are wavelength and correction factor, respectively, which compensates the inhomogeneous distribution of hemoglobin due to blood vessels [23]. (Eq. (2)
The reduced scattering coefficients of tissue are expressed as the double power function, including Mie and Rayleigh scattering [5,19,20,22].
| (3) |
Where, α, b, λ0 and γMR are scattering amplitude, Mie slope, normalized wavelength (λ0 = 500 nm) and Mie scattering fraction to total scattering, respectively.
2.2 Diffuse speckle contrast analysis
DSCA is an alternative method to DCS which allows the relative blood flow measurement from deep tissue in a cost-effective manner. DSCA monitor the relative blood flow based on the calculation of 1/Kt2 which is linearly proportional to flow [24,25]. (Eq. (4)
| (4) |
where, Kt, σt and < I > are temporal speckle contrast, standard deviation and mean intensity, respectively.
2.3 Tissue metabolic rate of oxygen consumption
The changes in the tissue metabolic rate of oxygen consumption were calculated by following Hoge’s method, which is an expression of tMRO2 changes related to the blood flow and the tissue oxygenation changes [17,18,26].
| (5) |
where rtMRO2 and rBF represent a relative change of tMRO2 and blood flow (1/Kt2) while StO2(0) and StO2(t) are oxygen saturation at the initial time and the transition time, respectively.
2.4 DOS-DSCA combined system
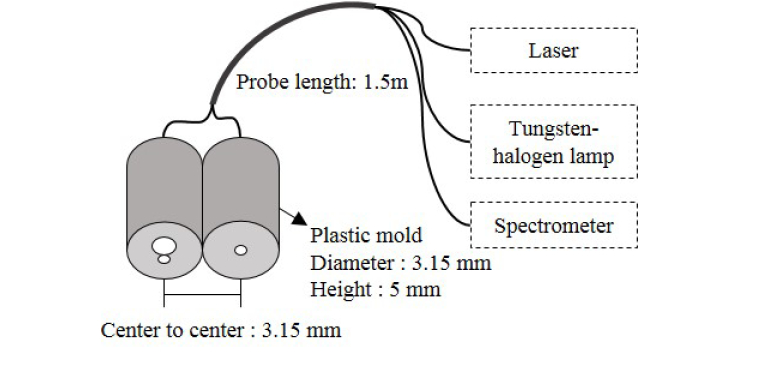
The diffuse optical metabolic spectroscopy system consists of a tungsten halogen lamp (HL-2000-HP, Ocean Optics, USA), a near-infrared laser for 852 nm (DL852-100-SO, CrystaLaser Technology, USA) and a spectrometer (USB4000, Ocean Optics, USA), which covers the spectral range from 470 nm to 1,140 nm.
To deliver and collect the light, a simple probe was fabricated using three multimode fiber bundles. Two fibers with a core diameter of 400 μm (FT400EMT, 0.39NA, Thorlabs, USA) and 50 μm (FG050LGA, 0.22NA, Thorlabs, USA), are connected to the tungsten halogen lamp and near-infrared laser, respectively. In addition, one fiber with a core diameter of 200 μm (FT200EMT, 0.39NA, Thorlabs, USA) is connected to the spectrometer. Figure 1 shows schematic drawing of the fabricated probe. The center to center distance between the source and detector fiber is 3.15 mm.
Fig. 1.
DOS and DSCA combined system.
2.5 Data acquisition and processing
The spectrometer scans at the rate of one hundred spectra per second with 5 msec integration time for each spectrum. When the spectrometer scans the spectrum, the measurement probe and area were covered by black fabric to prevent interference with ambient light, and dark signals on the measured spectrum were minimized by electrical dark correction function provided by Ocean Optics. Followed by the scanning process, our signal processing divides into two parts enabling 1/Kt2 calculation and spectrum fitting for the calculation of blood volume fraction and oxygenation. The first part, for the 1/Kt2 calculation, the intensity at 852 nm is extracted from each spectrum and recorded. 1/Kt2 value was then calculated from 100 temporal laser intensity fluctuations, which provides a sampling rate of 1Hz for blood flow measurement.
The second part is the whole spectrum recording and fitting to the analytical diffuse reflectance model. (Eq. (1)) Due to low spectrum intensity from the broadband light source, we used accumulated spectrum from one hundred raw spectra to calculate the diffuse reflectance (DR) (Eq. (6). Furthermore, the non-linear least square fitting (lsqcurvefit, Matlab, MathWorks, USA) is applied to fitting the DR to Eq. (1) with a spectral range from 530 nm to 700 nm to estimate the blood volume fraction and oxygenation level.
| (6) |
where DR, IS and IR are diffuse reflectance, reflected intensity from the sample, and reflected intensity from reference, respectively. The reference spectrum was measured on a 99% reflection plate (SRT-99-050, Labsphere, USA).
2.6 Experiments
2.6.1 Flow phantom experiments
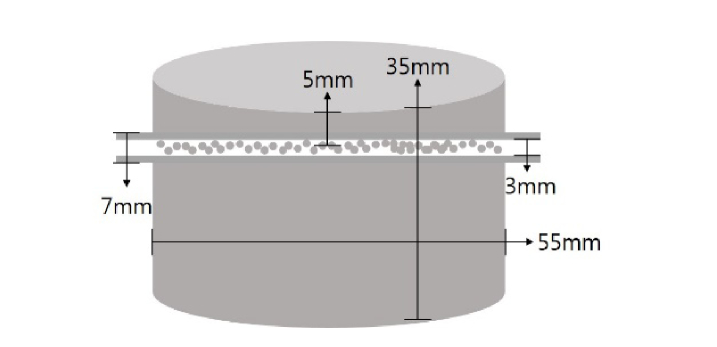
The flow phantom experiments were designed to study the system response to changes in the flow rate. The flow phantom was fabricated in the shape of a cylinder (diameter: 5.5 cm and height: 3.5cm). (Fig. 2) It consists of polydimethylsiloxane (PDMS, SYLARDTM 184 Silicon Elastomer Kit, Dow Corning, USA), India ink (0.16g/L) and titanium dioxide powder (0.64g/L) with a reference of Ayers et al.'s method [27], and the absorption and the reduced scattering coefficient values are estimated to be 0.013/mm and 0.87/mm at 650nm, respectively. Before the mixture became solidified, a transparent tube (inner diameter: 3mm and outer diameter: 7mm) filled with 2.5mm diameter plastic beads which make dynamic flow was inserted 5mm below the surface [16,24,25].
Fig. 2.
A schematic drawing of flow phantom. The outer and inner tube diameter are 7 mm and 3 mm, respectively and the tube was placed 5 mm below from the surface.
During the experiments, the probe was placed in the middle of silicon phantom surface. Further, 1% diluted intralipid solution (μs’ = 1.7/mm at 850nm [28]) flowed through a tube inserted into silicon flow phantom. The flow rate was gradually increased from 0 ml/min to 0.9 ml/min by a syringe pump with an increment of 0.1 ml/min. At each flow rate, sixty points of 1/Kt2 were calculated by using 6,000 temporal speckle fluctuations which recorded in one minute.
2.6.2 Blood phantom experiments
The blood phantom experiment was conducted to validate the capability of DOS to estimate the blood volume fraction and the oxygenation change. For the experiment, a 500ml cylindrical glass container (diameter: 9cm, height: 10cm) was filled with 20% intralipid solution (40 ml) and saline (260 ml). The optical probe was submerged in the middle of the solution. To monitor changes in the blood volume fraction, the bovine blood was added to the mixed solution in 0.5 ml increments until accumulated blood volume reached 3 ml. During the experiments, to prevent the exchange of oxyhemoglobin and deoxyhemoglobin, the air condition was maintained by supplying 79% nitrogen and 21% oxygen mixed gas with a flow rate of 1000 sccm.
Following the monitoring of blood volume fraction changes, the supply ratio of oxygen and nitrogen gas was controlled in three phases by a gas mixer to change the blood oxygenation. In the first phase: 79% nitrogen and 21% oxygen mixed gas supplied for 10 min, in the second phase: only 100% nitrogen supplied for 90 min, and in the third phase: only 100% oxygen supplied for 30 min. During the blood phantom experiment, the magnetic stirrer was used to maintain homogeneity of the mixed solution.
2.6.3 Arm occlusion experiments
To validate the tMRO2 monitoring, the arm occlusion experiments were carried out. The arm occlusion protocol was approved by the Gwangju Institute of Science and Technology’s Institutional Review Board (IRB 20140319-HR-10-01-02). A total of 4 healthy males (25~28 years old) were recruited in this experiment. The protocol includes 60 seconds pre-occlusion for baseline measurement, 100 seconds occlusion by cuff inflation at the pressure of 240 mmHg placed on the upper arm, and 140 seconds post-occlusion to recover from occlusion. During the experiments, the blood flow, volume, and oxygenation were simultaneously measured on the palm (adductor pollicis muscle) of each subject.
3. Results
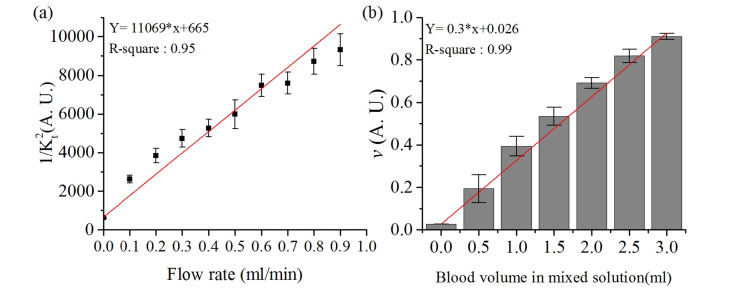
The average and standard deviation of 1/Kt2 changes during the flow phantom experiments are shown in Fig. 3(a). The results show an increase in 1/Kt2 from 615 to 9,314 corresponding to the flow rate, which increased from 0 ml/min to 0.9 ml/min. In addition, the results from the linear regression gave us the R-square value of approximately 0.95, which proves that 1/Kt2 is highly linearly proportional to the increase of flow rate.
Fig. 3.
(a) the changes of 1/Kt2 during the flow phantom experiments. The dot and error bar represent the average and the standard deviation of sixty points of 1/Kt2, respectively. (b) the increase of blood volume fraction (v) during the blood phantom experiments. The column and error bar represents the average and the standard deviation of sixty points of v. The red line is the result of linear regression.
Figure 3(b) shows blood volume fraction changes during the blood phantom experiments. The blood volume fraction increased with the accumulation of blood in the mixed solution. Prior to the addition of bovine blood, the blood volume fraction was 0.02. However, it is further increased approximately by 0.14 when we added 0.5 ml of blood to the solution. Finally, it reached 0.92 when the level of blood accumulated in the solution was 3 ml. The linear regression indicates linearity of blood volume fraction increase to the accumulation of blood.
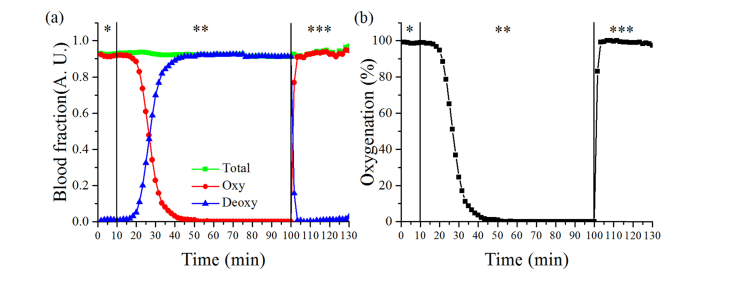
The blood volume fraction and oxygenation changes during the gas modulation are shown in Fig. 4. When mixed gas of 79% nitrogen and 21% oxygen supplied, the fraction of oxyhemoglobin and deoxyhemoglobin was 0.916 and 0.010, respectively. However, when 100% of the nitrogen gas was supplied, the fraction of oxyhemoglobin gradually reduced to 0.001, while the fraction of deoxyhemoglobin increased to 0.919. The fraction of both changed immediately following the supply of 100% oxygen. These values were recovered to 0.917 and 0.011, which are similar to the initial level. The fraction of total hemoglobin was approximately 0.92 during the entire experiment
Fig. 4.
The results from blood phantom experiment, (a) blood volume fraction changes of oxy, deoxy and total hemoglobin and (b) blood oxygenation changes during three phases of supplied gas. *, ** and *** represent first, second and third phase.
Changes in the oxygenation were observed which corresponded the changes in blood volume fraction. The oxygenation level gradually reduced from 98% to 0.1%, after 45 minutes of initializing the 100% nitrogen supply. Further, it quickly increased to 98% following the third phase.
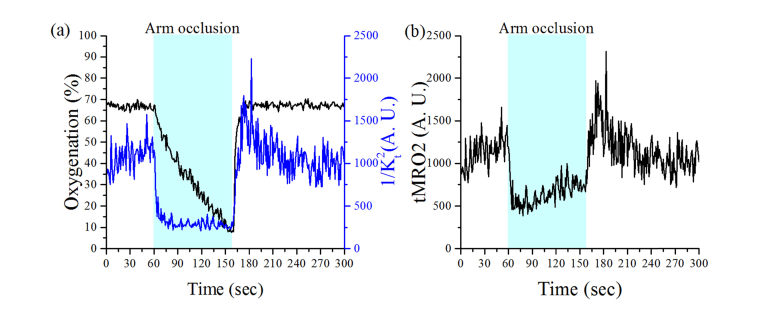
The representative results from the arm occlusion experiments are shown in Fig. 5. During the occlusion, 1/Kt2 prominently decreased, which immediately followed by the cuff inflation, and subsequently remained consistent. During this phase, oxygenation gradually decreased from 67% to 10%. Following the release of the cuff pressure, a hyperemic peak in 1/Kt2 is observed that is followed by recovery to baseline. In contrast, oxygenation quickly recovered to baseline. The changes of tMRO2 corresponding to the changes in the tissue oxygenation and the blood flow during the arm occlusion are shown in Fig. 5(b). When cuff was inflated, the tMRO2 instantaneously dropped to 500 from 1,200 and gradually increased to 700. After the release of the cuff, tMRO2 changes overshoot during initial post-occlusion and gradually recover to 1,000 which is close to the level of baseline. Table 1 presents the initial one-minute average of tMRO2 during the pre-occlusion, arm-occlusion, and post-occlusion for each of the four subjects. In general, the tMRO2 is reduced during the arm occlusion and showed higher tMRO2 when the cuff was released later.
Fig. 5.
The representative result from arm occlusion test. (a) The oxygenation and 1/Kt2 changes during the experiments, and (b) the calculated tMRO2 based on oxygenation and 1/Kt2 changes.
Table 1. The changes in tMRO2 from four subjects during the arm occlusion test. (mean ± standard deviation).
| Subject ID | Pre-occlusion (1~60 s) | Arm-occlusion (61~120 s) | Post-occlusion (161~220 s) |
|---|---|---|---|
| 1 |
1,140 ( ± 185) |
592 ( ± 146) |
1,244 ( ± 353) |
| 2 |
1,426 ( ± 363) |
542 ( ± 134) |
1,575 ( ± 329) |
| 3 |
641 ( ± 125) |
301 ( ± 69) |
732 ( ± 157) |
| 4 | 559 ( ± 99) | 451 ( ± 155) | 971 ( ± 216) |
4. Discussions and conclusion
To be valid, DSCA requires that speckle size must be smaller than pixel size. Even though the proposed system does not meet the requirement above, in this study, we demonstrated that measured 1/Kt2 is linearly proportional to the flow rate in the flow phantom experiments. The results are in accordance with the previous studies reported by Bi et al. [24,25]. To clarify our system response to flow, we applied ANOVA test to the data from the flow phantom experiment. The results of ANOVA test showed significant differences of 1/Kt2 between each flow rate (p < 0.05), which proved that our system could detect changes in flow in the range of 0 to 0.9 ml/ml at least with a resolution of 0.1 ml/min.
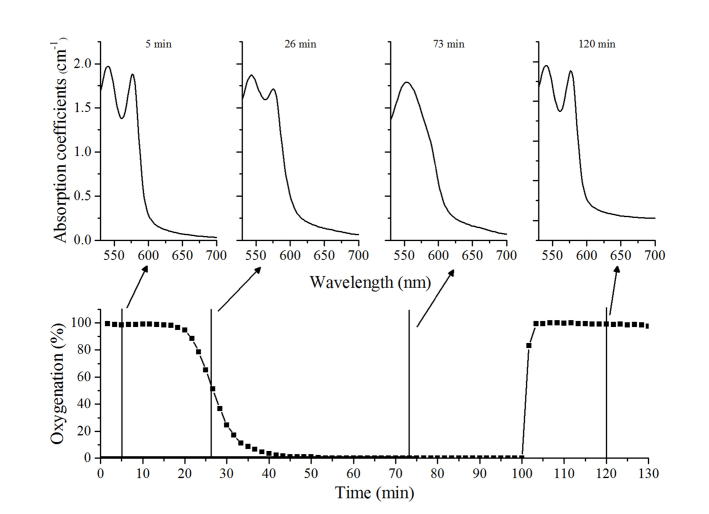
For the blood phantom experiment, there were several trial and errors to convert oxyhemoglobin to deoxyhemoglobin. Since hemoglobin has a high affinity to oxygen, to convert all oxyhemoglobin in the solution to deoxyhemoglobin, we had to evacuate all oxygen in the container. Therefore, we supplied nitrogen gas with a high flow rate to remove the previously supplied air in the container. After several trials, we found that it is not feasible to facilitate the total conversion of oxyhemoglobin to deoxyhemoglobin with a big container and a large volume of solution. Therefore, 500ml was chosen as a container volume and 300 ml for saline solution mixed with intralipid. In addition, the gas flow rate was maintained as 1,000 sccm during the experiments which is high enough to evacuate oxygen in the solution but not too high to disturb the detected light intensity during experiments. Under the described experimental conditions, deoxyhemoglobin absorption spectrum feature could be seen on the recovered absorption spectrum. The absorption spectrum was recovered by re-calculating Eq. (1) with the reduced scattering coefficients from the fitting results. (Fig. 6)
Fig. 6.
Oxygenation changes during the blood phantom experiments (bottom layer) and recovered absorption coefficients spectrum at the interval of 5, 26, 73 and 120 minutes later when oxygenation was 98%, 52%, 0.1%, and 98%, respectively (top layer).
When the cuff was inflated to the 240 mmHg pressure, arterial blood vessels were completely closed because the cuff pressure was higher than the normal cardiac output pressure. Therefore, the 1/Kt2 immediately decreased following cuff inflation and maintained until the cuff relaxation while oxygenation gradually decreased during the cuff inflation because the tissue continuously consumed residual oxygen in the blood even though oxygen supply was suspended. It is then immediately recovered to the baseline when the cuff was released. Unlike our expectation, the changes of oxygenation and 1/Kt2 show a different response after cuff release. A clear hyperemic peak can be observed in 1/Kt2, but not in the oxygenation change. It may be due to a short source-detector distance of our probe as Yu et al. reported [29]. They showed that the magnitude of reactive hyperemia became less as the source-detector separation gets shorter, and they also showed reactive hyperemia of blood flow is much stronger than those in oxygenation. According to their study, source-detector separation of our probe (3.15mm) can monitor the hyperemia response of blood flow but may not be enough to observe hyperemia response on oxygenation.
Tissue metabolic rate of oxygen consumption can be estimated by simultaneous monitoring of blood flow and oxygenation in tissue. Arm cuff experiment showed that tMRO2 quickly decreased after cuff inflation due to the decrease of blood flow, but then it gradually increased as oxygenation decreases during arm occlusion. These results are similar to the recent report by Ghijsen et al. [17] except that the indicated value of tMRO2 is different. The difference of tMRO2 value between theirs and us may come from the relative blood flow index calculation, which can be depending on the specification of detectors. However, our proposed system showed the ability to monitor changes in tMRO2 by monitoring blood flow and oxygenation simultaneously.
During arm cuff experiment, the tungsten halogen lamp and 852 nm laser were both kept on. Even though both light sources were turned on, the measurement of blood volume and oxygenation is not affected by the laser since 530-700nm wavelength spectrum were used for fitting into Eq. (1). For the blood flow calculation, a CCD pixel corresponding to 852 nm in spectrometer simultaneously collects the light from both laser and tungsten halogen lamp. However, with a 5 msec of an integration time, the intensity of 852nm from the laser (~35,000) is approximately 70 times stronger than broadband light from a tungsten halogen lamp (~500). Therefore, the influence of broadband light on flow measurement can be ignored.
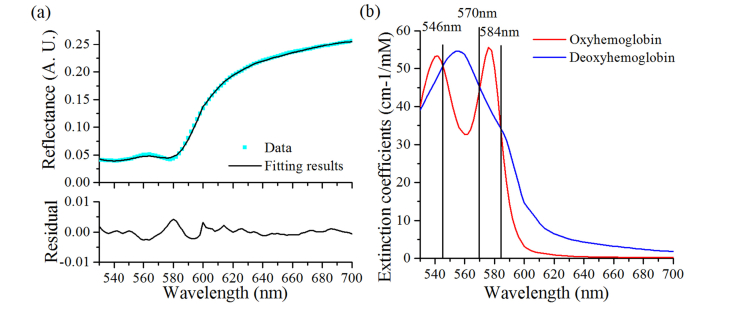
Our system has a limitation that the tissue volumes of light propagation in DOS and DSCA are not the same due to the difference of light wavelengths used. DOS system used the spectral range from 530nm to 700nm to achieve accurate fitting results since oxy- and deoxyhemoglobin have distinct absorption spectrum (Fig. 7). However, blood flow information from DSCA utilized the light intensity fluctuation at 852nm which has a deeper tissue penetration depth than the visible wavelengths. Therefore, it can cause a potential error in estimating the tMRO2 by using this combined system.
Fig. 7.
(a) The fitting results and residual on the first spectrum of subject 1, (b) Oxyhemoglobin and deoxyhemoglobin extinction coefficients spectrum by Scott Prahl [30], the black line represents an isosbestic point.
Another limitation comes from the short source-detector separation (3.15 mm) because the probe will collect information about blood flow and oxygenation only from the superficial region of tissue, not from the deep tissue. Currently, this limitation is due to the low fitting accuracy in the near-infrared wavelength range. Even though oxy- and deoxyhemoglobin have a different shape of the absorption spectrum in the near-infrared range, the fitting of the diffuse reflectance in the near-infrared wavelength does not produce accurate values of blood volume and oxygenation compared to those by using the absorption spectra of the hemoglobin in the 530-700nm range. A further study is required to overcome this limitation either by developing the calibration method based on the result of the blood phantom experiment or by the employment of a better fitting algorithm.
A high order P approximation of radiative transport equation or Monte Carlo simulation could offer better solutions to obtain the optical properties of tissue compared to the diffusion approximation, especially when the source-detector separation is short [31]. However, our measurements on the blood phantom and adductor pollicis muscle fulfill two assumptions of photon diffusion model as Nachabé et al. described [32], which are 1) the reduced scattering is much greater than the absorption, and 2) the source-detector separation is greater than the scattering length. The source-detector separation of our probe (3.15mm) is longer than Nachabé et al.’s study (2.48mm) [32]. Therefore, the results from our system are still valid with the photon diffusion model.
Regardless of a few limitations of our system, it has significant advantages compared to the other previously reported systems. This system is so simple that it can be constructed by the purchase of commercial light sources and a spectrometer, and thus can be a low-cost system. It also occupies little space which increases its portability. Especially, the probe which consists of three optical fibers provides easy access to measurement sites without complicated light alignments. It is believed that this convenience will play an important role in clinical applications.
In conclusion, we developed a simple diffuse optical metabolic spectroscopy system by combining the DOS and DSCA system to monitor tMRO2 changes. Flow phantom experiment showed that the system could measure the flow in the range of 0~0.9 ml/min with a resolution better than 0.1 ml/min. Blood phantom test proved that blood volume fraction increases linearly with an accumulation of bovine blood volume in the solution, and oxygenation value changes accordingly with modulation of supplied oxygen gas. Finally, tMRO2 changes were monitored during in vivo arm occlusion test and showed a decrease in tMRO2 during the occlusion and recovery with a release of cuff pressure. All of these results verified that this simple system could monitor the metabolic rate of oxygen consumption by having a simultaneous measurement of blood flow and tissue oxygenation. It is expected that this simple optical metabolic spectroscopy system can be effortlessly applied in the medical domain with advantages of its simplicity, low cost, and convenience.
Funding
Traditional Korean Medicine R&D Program funded by the Ministry of Health and Welfare through the Korea Health Industry Development Institute (HI15C0190), Brain Research Program (#2016M3C7A1905475) through the National Research Foundation of Korea, and GIST Research Institute (GRI) grant funded by GIST in 2019.
Disclosures
The authors declare that there are no conflicts of interest related to this article.
References
- 1.Armitage G. A., Todd K. G., Shuaib A., Winship I. R., “Laser speckle contrast imaging of collateral blood flow during acute ischemic stroke,” J. Cereb. Blood Flow Metab. 30(8), 1432–1436 (2010). 10.1038/jcbfm.2010.73 [DOI] [PMC free article] [PubMed] [Google Scholar]
- 2.Yu G., “Near-infrared diffuse correlation spectroscopy in cancer diagnosis and therapy monitoring,” J. Biomed. Opt. 17(1), 010901 (2012). 10.1117/1.JBO.17.1.010901 [DOI] [PMC free article] [PubMed] [Google Scholar]
- 3.Nachabé R., Evers D. J., Hendriks B. H., Lucassen G. W., van der Voort M., Rutgers E. J., Peeters M.-J. V., Van der Hage J. A., Oldenburg H. S., Wesseling J., Ruers T. J., “Diagnosis of breast cancer using diffuse optical spectroscopy from 500 to 1600 nm: comparison of classification methods,” J. Biomed. Opt. 16(8), 087010 (2011). 10.1117/1.3611010 [DOI] [PubMed] [Google Scholar]
- 4.Lee S., Jeong H., Seong M., Kim J. G., “Change of tumor vascular reactivity during tumor growth and postchemotherapy observed by near-infrared spectroscopy,” J. Biomed. Opt. 22(12), 121603 (2017). 10.1117/1.JBO.22.12.121603 [DOI] [PubMed] [Google Scholar]
- 5.Nachabé R., Evers D. J., Hendriks B. H., Lucassen G. W., van der Voort M., Wesseling J., Ruers T. J., “Effect of bile absorption coefficients on the estimation of liver tissue optical properties and related implications in discriminating healthy and tumorous samples,” Biomed. Opt. Express 2(3), 600–614 (2011). 10.1364/BOE.2.000600 [DOI] [PMC free article] [PubMed] [Google Scholar]
- 6.Kim E., Lee S., Phillips Z., 5th, Kim J. G., “A discrepancy of penile hemodynamics during visual sexual stimulation observed by near-infrared spectroscopy,” BMC Urol. 15(1), 11 (2015). 10.1186/s12894-015-0005-x [DOI] [PMC free article] [PubMed] [Google Scholar]
- 7.Boas D. A., Dunn A. K., “Laser speckle contrast imaging in biomedical optics,” J. Biomed. Opt. 15(1), 011109 (2010). 10.1117/1.3285504 [DOI] [PMC free article] [PubMed] [Google Scholar]
- 8.C. E. Elwell and C. E. Cooper, “Making light work: illuminating the future of biomedical optics,” (The Royal Society, 2011). [DOI] [PubMed] [Google Scholar]
- 9.Hillman E. M., “Optical brain imaging in vivo: techniques and applications from animal to man,” J. Biomed. Opt. 12(5), 051402 (2007). 10.1117/1.2789693 [DOI] [PMC free article] [PubMed] [Google Scholar]
- 10.Golub A. S., Pittman R. N., “A paradigm shift for local blood flow regulation,” Am. J. Appl. Physiol.. 116(6) 703–705 (2014). [DOI] [PMC free article] [PubMed] [Google Scholar]
- 11.Secomb T. W., “Theoretical models for regulation of blood flow,” Microcirculation 15(8), 765–775 (2008). 10.1080/10739680802350112 [DOI] [PMC free article] [PubMed] [Google Scholar]
- 12.Valabrègue R., Aubert A., Burger J., Bittoun J., Costalat R., “Relation between cerebral blood flow and metabolism explained by a model of oxygen exchange,” J. Cereb. Blood Flow Metab. 23(5), 536–545 (2003). 10.1097/01.WCB.0000055178.31872.38 [DOI] [PubMed] [Google Scholar]
- 13.Qin J., Shi L., Dziennis S., Reif R., Wang R. K., “Fast synchronized dual-wavelength laser speckle imaging system for monitoring hemodynamic changes in a stroke mouse model,” Opt. Lett. 37(19), 4005–4007 (2012). 10.1364/OL.37.004005 [DOI] [PMC free article] [PubMed] [Google Scholar]
- 14.Z. Luo, Z. Yuan, Y. Pan, and C. Du, “Simultaneous Imaging of Cortical Blood Flow and Oxygenation Change or Cellular Calcium Dynamics Using Dual-Wavelength Laser Speckle Contrast Imaging,” in Biomedical Optics, (Optical Society of America, 2010), BWA6. [Google Scholar]
- 15.Kim M. N., Durduran T., Frangos S., Edlow B. L., Buckley E. M., Moss H. E., Zhou C., Yu G., Choe R., Maloney-Wilensky E., Wolf R. L., Grady M. S., Greenberg J. H., Levine J. M., Yodh A. G., Detre J. A., Kofke W. A., “Noninvasive measurement of cerebral blood flow and blood oxygenation using near-infrared and diffuse correlation spectroscopies in critically brain-injured adults,” Neurocrit. Care 12(2), 173–180 (2010). 10.1007/s12028-009-9305-x [DOI] [PMC free article] [PubMed] [Google Scholar]
- 16.Seong M., Phillips Z., 5th, Mai P. M., Yeo C., Song C., Lee K., Kim J. G., “Simultaneous blood flow and blood oxygenation measurements using a combination of diffuse speckle contrast analysis and near-infrared spectroscopy,” J. Biomed. Opt. 21(2), 27001 (2016). 10.1117/1.JBO.21.2.027001 [DOI] [PubMed] [Google Scholar]
- 17.Ghijsen M., Lentsch G. R., Gioux S., Brenner M., Durkin A. J., Choi B., Tromberg B. J., “Quantitative real-time optical imaging of the tissue metabolic rate of oxygen consumption,” J. Biomed. Opt. 23(3), 1–12 (2018). 10.1117/1.JBO.23.3.036013 [DOI] [PMC free article] [PubMed] [Google Scholar]
- 18.Lu H., Li Y., Li H., Yuan L., Liu Q., Sun Y., Tong S., “Single-trial estimation of the cerebral metabolic rate of oxygen with imaging photoplethysmography and laser speckle contrast imaging,” Opt. Lett. 40(7), 1193–1196 (2015). 10.1364/OL.40.001193 [DOI] [PubMed] [Google Scholar]
- 19.Nachabé R., Hendriks B. H., van der Voort M., Desjardins A. E., Sterenborg H. J., “Estimation of biological chromophores using diffuse optical spectroscopy: benefit of extending the UV-VIS wavelength range to include 1000 to 1600 nm,” Biomed. Opt. Express 1(5), 1432–1442 (2010). 10.1364/BOE.1.001432 [DOI] [PMC free article] [PubMed] [Google Scholar]
- 20.Nguyen T., Kim S., Kim J. G., “Diffuse reflectance spectroscopy to quantify the met-myoglobin proportion and meat oxygenation inside of pork and beef,” Food Chem. 275, 369–376 (2019). 10.1016/j.foodchem.2018.09.121 [DOI] [PubMed] [Google Scholar]
- 21.Farrell T. J., Patterson M. S., Wilson B., “A diffusion theory model of spatially resolved, steady-state diffuse reflectance for the noninvasive determination of tissue optical properties in vivo,” Med. Phys. 19(4), 879–888 (1992). 10.1118/1.596777 [DOI] [PubMed] [Google Scholar]
- 22.Jacques S. L., “Optical properties of biological tissues: a review,” Phys. Med. Biol. 58(11), R37–R61 (2013). 10.1088/0031-9155/58/11/R37 [DOI] [PubMed] [Google Scholar]
- 23.Verkruysse W., Lucassen G. W., de Boer J. F., Smithies D. J., Nelson J. S., van Gemert M. J., “Modelling light distributions of homogeneous versus discrete absorbers in light irradiated turbid media,” Phys. Med. Biol. 42(1), 51–65 (1997). 10.1088/0031-9155/42/1/003 [DOI] [PubMed] [Google Scholar]
- 24.Bi R., Dong J., Lee K., “Deep tissue flowmetry based on diffuse speckle contrast analysis,” Opt. Lett. 38(9), 1401–1403 (2013). 10.1364/OL.38.001401 [DOI] [PubMed] [Google Scholar]
- 25.Bi R., Dong J., Lee K., “Multi-channel deep tissue flowmetry based on temporal diffuse speckle contrast analysis,” Opt. Express 21(19), 22854–22861 (2013). 10.1364/OE.21.022854 [DOI] [PubMed] [Google Scholar]
- 26.Hoge R. D., Atkinson J., Gill B., Crelier G. R., Marrett S., Pike G. B., “Investigation of BOLD signal dependence on cerebral blood flow and oxygen consumption: the deoxyhemoglobin dilution model,” Magn. Reson. Med. 42(5), 849–863 (1999). [DOI] [PubMed] [Google Scholar]
- 27.F. Ayers, A. Grant, D. Kuo, D. J. Cuccia, and A. J. Durkin, “Fabrication and characterization of silicone-based tissue phantoms with tunable optical properties in the visible and near infrared domain,” in Design and Performance Validation of Phantoms Used in Conjunction with Optical Measurements of Tissue, (International Society for Optics and Photonics, 2008), 687007. [Google Scholar]
- 28.Rowe P. I., Künnemeyer R., McGlone A., Talele S., Martinsen P., Seelye R., “Relationship between tissue firmness and optical properties of ‘Royal Gala’apples from 400 to 1050 nm,” Postharvest Biol. Technol. 94, 89–96 (2014). 10.1016/j.postharvbio.2014.03.007 [DOI] [Google Scholar]
- 29.Yu G., Durduran T., Lech G., Zhou C., Chance B., Mohler E. R., 3rd, Yodh A. G., “Time-dependent blood flow and oxygenation in human skeletal muscles measured with noninvasive near-infrared diffuse optical spectroscopies,” J. Biomed. Opt. 10(2), 024027 (2005). 10.1117/1.1884603 [DOI] [PubMed] [Google Scholar]
- 30.S. A. Prahl, Tabulated Molar Extinction Coefficient for Hemoglobin in Water” https://omlc.org/spectra/hemoglobin/summary.html
- 31.Hull E. L., Foster T. H., “Steady-state reflectance spectroscopy in the P 3 approximation,” J. Opt. Soc. Am. A 18(3), 584–599 (2001). 10.1364/JOSAA.18.000584 [DOI] [Google Scholar]
- 32.Nachabé R., Hendriks B. H., Desjardins A. E., van der Voort M., van der Mark M. B., Sterenborg H. J., “Estimation of lipid and water concentrations in scattering media with diffuse optical spectroscopy from 900 to 1,600 nm,” J. Biomed. Opt. 15(3), 037015 (2010). 10.1117/1.3454392 [DOI] [PubMed] [Google Scholar]


