Abstract
This study analyzes clinically indicated arterial blood gas values from patients with cyanotic congenital heart disease to determine whether oxyhemoglobin saturation or arterial oxygen tension provides a better measure of oxygenation.
In the modern era, 2 methods are available to assess oxygenation: arterial oxygen tension (Pao2) and oxyhemoglobin saturation (Sao2). Pao2 represents oxygen dissolved within the plasma and is measured amperometrically, whereas Sao2 represents hemoglobin-bound oxygen and is measured by absorbance spectroscopy (ie, co-oximetry). Assessment of the degree of hypoxemia in critically ill patients may influence medication or ventilator management, the use of extracorporeal life-support, or the need for catheterization or reoperation.1,2 Historically, the determination of hypoxemia was made using the Van Slyke apparatus manometric method3 or Pao2, as co-oximetry was not broadly available.4 However, Pao2 and Sao2 may yield disparate information, particularly in severely cyanotic patients.
Methods
This study was approved by the Institutional Review Board at Boston Children's Hospital under a waiver of informed consent. We extracted 70 743 time-stamped clinically indicated arterial blood gas (ABG; ABL800 FLEX Co-Ox, Radiometer America) values from 2163 admissions in patients with univentricular, cyanotic congenital heart disease who were treated at Boston Children’s Hospital between January 1, 2006, and December 31, 2016.
First, we studied the relationship between Pao2 and Sao2 using a generalized estimating equations model to account for the correlation among repeated measurements, hemoglobin, temperature, pH, and Paco2 (arterial partial pressure of carbon dioxide).
Second, we examined changes in Pao2 and Sao2 in sequential ABGs to determine the relationship of changes, stratified by degree of hypoxemia (lowest Pao2).
Third, we evaluated the precision of Pao2 and Sao2 measurements on 190 separate ABGs rerun within 5 minutes on different blood gas analyzers. All analyses were completed in SPSS (IBM).
Results
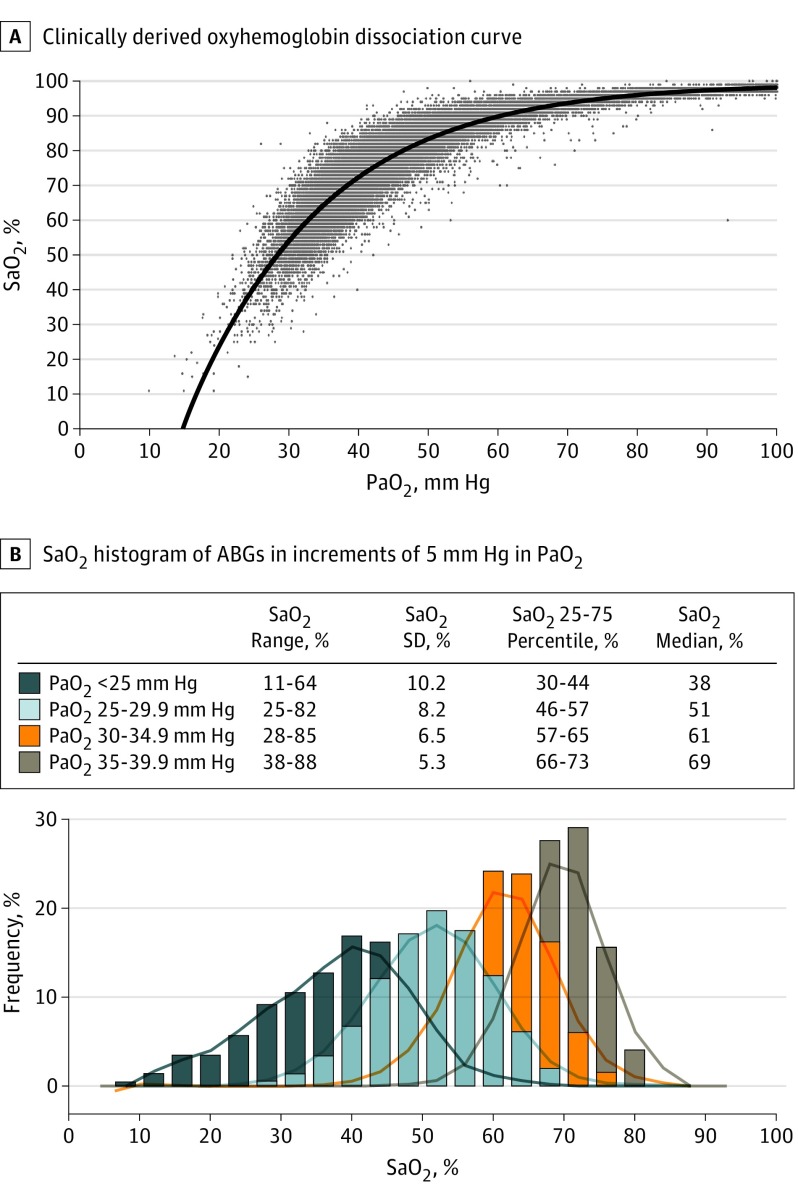
First, the relationship between Pao2 and Sao2 was nonlinear, as expected for the oxyhemoglobin dissociation curve (Figure 1A). Within the cyanotic range, a narrow range of Pao2 values corresponded with a wide range of Sao2 values; the more hypoxemic the patient, the wider the standard deviation in Sao2 (Figure 1B).
Figure 1. Clinically Derived Oxyhemoglobin Dissociation Curve and Variance of Oxyhemoglobin Saturation (Sao2) Within Narrow Arterial Oxygen Tension (Pao2) Increments.
A, Pao2 and Sao2 become increasingly variant as Pao2 decreases. B, Within the actionable range of hypoxemia, Sao2 correlates progressively less closely with Pao2 as Pao2 decreases. Note the increasingly broad ranges and SDs of Sao2 within progressively decreasing increments of 5 mm Hg in Pao2. ABGs indicates arterial blood gases.
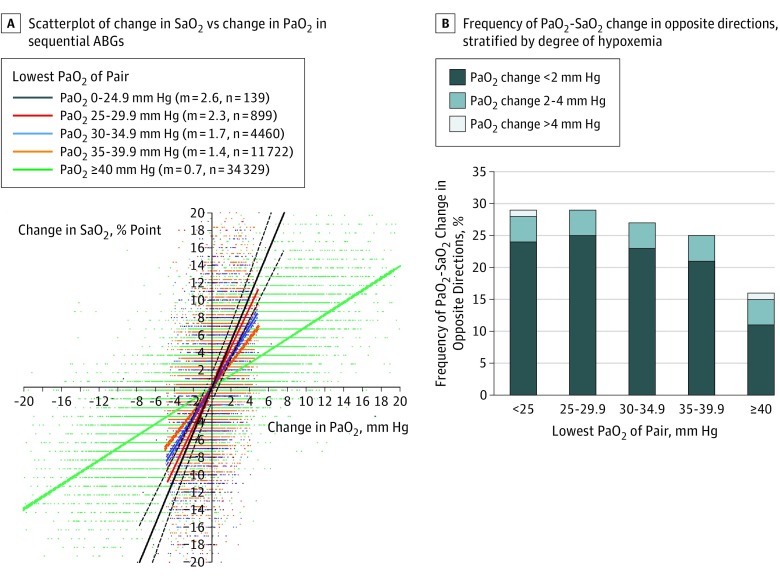
Second, among sequential ABGs, Sao2 exhibited a larger change per unit change in Pao2, moreso in severe cyanosis (Figure 2A). When controlling for temperature, hemoglobin, pH, and Paco2, every 1 mm Hg increase in Pao2 was associated with a 1.30 (95% CI, 1.27-1.33) percentage point increase in Sao2. In serial ABGs, Pao2 and Sao2 changed in opposite directions in more than 25% of ABGs, at times even when changes in Pao2 exceeded 4 mm Hg between sequential ABGs (Figure 2B).
Figure 2. Relationship Between Changes in Oxyhemoglobin Saturation (Sao2) and Changes in Arterial Oxygen Tension (Pao2) in Serial Arterial Blood Gases (ABGs).
A, The relationship between changes in Sao2 and Pao2 on sequential ABGs are shown, stratified by the lowest Pao2 of the pair. Slopes of linear regression lines (m) increase with increasing hypoxemia (P < .001). The lines indicate linear regression ±95% CI. B, The frequency of opposite changes in Pao2 and Sao2 was stratified by degree of hypoxemia.
Third, the precision of both Pao2 (interclass coefficient [ICC], 0.987; 95% CI, 0.980-0.991) and Sao2 (ICC, 0.982; 95% CI, 0.962-0.990) was excellent. The median (interquartile range) change in Pao2 between repeats was 0.5 (0.3-0.7) mm Hg and in Sao2 was 0.7 (0.6-1.2) percentage point.
Discussion
Within the clinical range that we studied, the correlation between Pao2 and SaO2 worsened with hypoxemia. Narrow ranges of Pao2 (eg, 30-35 mm Hg) were associated with wide ranges of Sao2 (eg, 28%-85%), with widely disparate prognostic and treatment implications. Because the magnitude of change in Sao2 in the cyanotic range was greater than that in Pao2, and because the precision of Pao2 and Sao2 measurements was similar, the two may trend in opposite directions; a patient believed to be worsening on the basis of Pao2 may frequently have improved based on Sao2, and vice versa.
The arterial Po2 range of many cyanotic patients is normally that of the tissues rather than arterial blood. In this range, the hemoglobin system is designed to be responsive to changes in surrounding temperature, pH, Pco2, and [2,3-diphosphoglycerate], optimizing oxygen release to tissues.5 However, in the arterial system, these factors create significant variance between Pao2 and Sao2, as does the concentration of hemoglobin F.6 Because (1) arterial oxygen content is predominantly determined by Sao2, (2) the magnitude of change in Sao2 is higher than that in Pao2 (particularly in profound hypoxemia), (3) Pao2 and Sao2 sometimes trend in opposite directions on the same AGBs, and (4) the precision of Sao2 by co-oximetry is excellent, we believe that measured Sao2 provides a superior assessment of oxygenation in cyanotic patients.
References
- 1.Strauss KM, Dongas A, Hein U, et al. Stage 1 palliation of hypoplastic left heart syndrome: implications of blood gases. J Cardiothorac Vasc Anesth. 2001;15(6):731-735. [DOI] [PubMed] [Google Scholar]
- 2.Pipeling MR, Fan E. Therapies for refractory hypoxemia in acute respiratory distress syndrome. JAMA. 2010;304(22):2521-2527. [DOI] [PubMed] [Google Scholar]
- 3.Van Slyke DD, Stadie WC. The determination of the gases of the blood. J Biol Chem. 1921;49(1):1-42.12091502 [Google Scholar]
- 4.Freed MD, Heymann MA, Lewis AB, Roehl SL, Kensey RC. Prostaglandin E1 infants with ductus arteriosus-dependent congenital heart disease. Circulation. 1981;64(5):899-905. [DOI] [PubMed] [Google Scholar]
- 5.Morse M, Cassels DE. Arterial blood gases and acid-base balance in cyanotic congenital heart disease. J Clin Invest. 1953;32(9):837-846. [DOI] [PMC free article] [PubMed] [Google Scholar]
- 6.Versmold HT, Linderkamp C, Döhlemann C, Riegel KP. Oxygen transport in congenital heart disease: influence of fetal hemoglobin, red cell pH, and 2,3-diphosphoglycerate. Pediatr Res. 1976;10(6):566-570. [DOI] [PubMed] [Google Scholar]


