Abstract
This study examines 42 years of National Highway Traffic Safety Administration data to establish whether Halloween is associated with an increased rate of pedestrian fatalities.
On October 31 each year, millions of children in the United States celebrate Halloween by walking door to door to collect candy from neighbors, while adults and adolescents engage in Halloween festivities. The holiday may heighten pedestrian traffic risk, because celebrations occur at dusk, masks restrict peripheral vision, costumes limit visibility, street-crossing safety is neglected, and some partygoers are impaired by alcohol.1 Mitigating factors include broad public awareness of Halloween, widespread parental supervision of younger children, and the potential for improved safety as pedestrian numbers increase. Prior studies of Halloween traffic risks have been limited to brief observations, failed to test for statistical significance, or lacked appropriate control groups.2,3 We therefore examined 4 decades of national data to systematically evaluate pedestrian fatality risks on Halloween and highlight opportunities for year-round injury prevention.
Methods
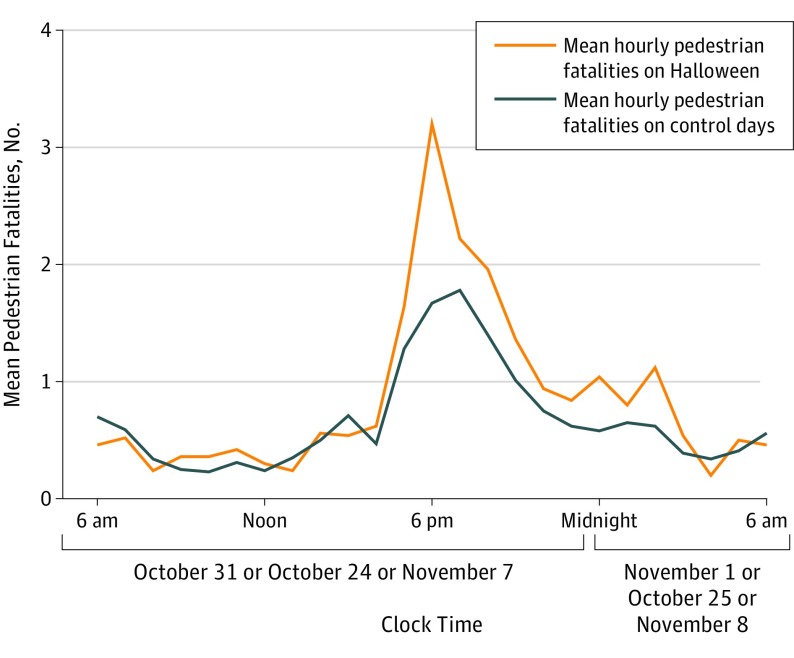
Data were obtained from the National Highway Traffic Safety Administration's Fatality Analysis Reporting System. The 42-year study interval extended from the first year that data were collected to the most recent year for which data were available (1975 to 2016). The primary analysis compared the number of pedestrian fatalities that occurred between 5 pm and 11:59 pm on October 31 each year with the number that occurred during the same hours on control evenings 1 week earlier (October 24) and 1 week later (November 7). As in prior research, exact binomial tests were used to examine the significance of deviations from the expected ratio of 1:2.4 Hourly variation in risk was evaluated by stratifying pedestrian fatalities by clock time.
This study received a waiver of approval from the University of British Columbia research ethics board. This included a waiver of the requirement for informed consent.
Statistical analyses used 2-sided tests and statistical significance was inferred from P values less than 0.05. Analyses were performed using R version 3.4 (R Foundation for Statistical Computing). Data analysis occurred from February to September 2018.
Results
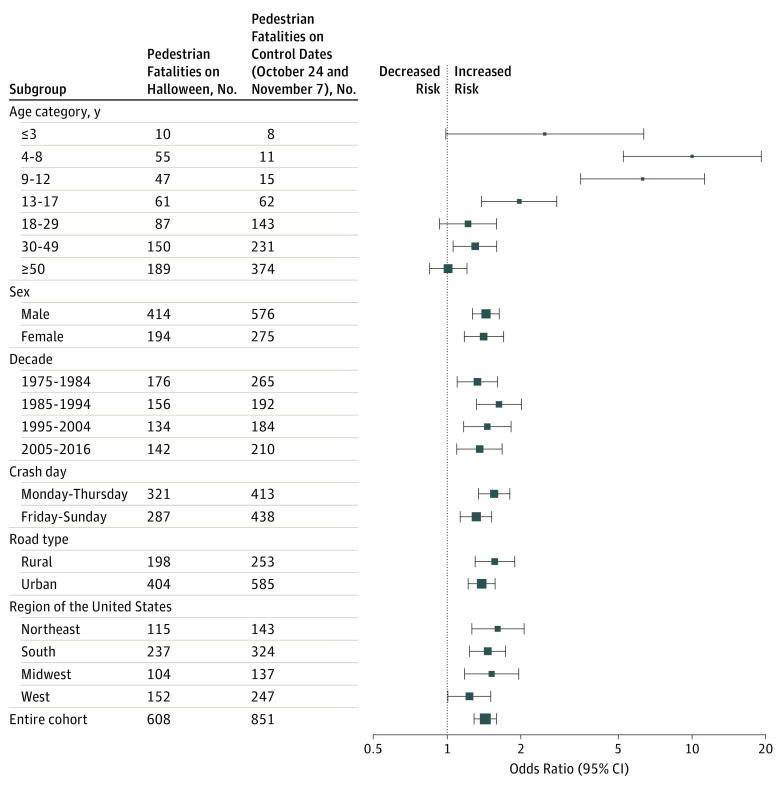
The entire study interval included 1 580 608 fatal traffic crashes involving 2 333 302 drivers and 268 468 pedestrians. A total of 608 pedestrian fatalities occurred on the 42 Halloween evenings, whereas 851 pedestrian fatalities occurred on the 84 control evenings. Absolute mortality rates averaged 2.07 and 1.45 pedestrian fatalities per hour, respectively. The relative risk of a pedestrian fatality was 43% higher on Halloween compared with control evenings (odds ratio, 1.43 [95% CI, 1.29-1.59]; P < .001). The average Halloween resulted in 4 additional pedestrian deaths.
Subgroup analysis revealed the highest relative risk increase was among children, with pedestrians aged 4 to 8 years exhibiting a 10-fold increase in pedestrian fatality risk on Halloween (odds ratio, 10.00 [95% CI, 5.23-19.11]; P < .001; Figure 1). Relative risks remained stable throughout the study interval, but the absolute risk per 100 million Americans was small and declined from 4.9 to 2.5 between the first and final study decades. Risks were highest around 6 pm (Figure 2). Sensitivity analyses adjusting for annual variability in the end date of Daylight Saving Time yielded similar results. Driver demographics, crash location, vehicle size, precrash maneuver, and police-reported alcohol involvement or excess speed did not differ between Halloween and control days.
Figure 1. Relative Risk of Pedestrian Fatality on Halloween Compared With Control Dates.
Forest plot showing the relative risk of pedestrian fatality between 5 pm and 11:59 pm on Halloween compared with the same time interval on control evenings exactly 1 week earlier and 1 week later. Solid squares indicate point estimate; relative dimensions, sample size; horizontal lines, 95% CIs.
Figure 2. Hourly Variation in Mean Pedestrian Fatalities.
Discussion
Halloween traffic fatalities are a tragic annual reminder of routine gaps in traffic safety. On Halloween and throughout the year, most childhood pedestrian deaths occur within residential neighborhoods.5 Such events highlight deficiencies of the built environment (eg, lack of sidewalks, unsafe street crossings), shortcomings in public policy (eg, insufficient space for play), and failures in traffic control (eg, excessive speed).
Event-specific interventions that may prevent Halloween child pedestrian fatalities include traffic calming and automated speed enforcement in residential neighborhoods. Pedestrian visibility could be improved by limiting on-street parking and incorporating reflective patches into clothing. But restricting these interventions to 1 night per year misses the point, since year-round application of effective traffic safety interventions will foster much greater progress toward eliminating pedestrian fatalities altogether.6
Conclusions
Halloween trick-or-treating encourages creativity, physical activity, and neighborhood engagement. Trick-or-treating should not be abolished in a misguided effort to eliminate Halloween-associated risk. Instead, policymakers, physicians, and parents should act to make residential streets safer for pedestrians on Halloween and throughout the year.
References
- 1.Tremblay PF, Graham K, Wells S, Harris R, Pulford R, Roberts SE. When do first-year college students drink most during the academic year? an internet-based study of daily and weekly drinking. J Am Coll Health. 2010;58(5):401-411. doi: 10.1080/07448480903540465 [DOI] [PubMed] [Google Scholar]
- 2.Centers for Disease Control and Prevention (CDC) Childhood pedestrian deaths during Halloween—United States, 1975-1996. MMWR Morb Mortal Wkly Rep. 1997;46(42):987-990. [PubMed] [Google Scholar]
- 3.Farmer CM, Williams AF. Temporal factors in motor vehicle crash deaths. Inj Prev. 2005;11(1):18-23. doi: 10.1136/ip.2004.005439 [DOI] [PMC free article] [PubMed] [Google Scholar]
- 4.Staples JA, Redelmeier DA. The April 20 cannabis celebration and fatal traffic crashes in the United States. JAMA Intern Med. 2018;178(4):569-572. doi: 10.1001/jamainternmed.2017.8298 [DOI] [PMC free article] [PubMed] [Google Scholar]
- 5.Stevenson M, Jamrozik K, Burton P. A case-control study of childhood pedestrian injuries in Perth, Western Australia. J Epidemiol Community Health. 1996;50(3):280-287. doi: 10.1136/jech.50.3.280 [DOI] [PMC free article] [PubMed] [Google Scholar]
- 6.Richard CM, Magee K, Bacon-Abdelmoteleb P, Brown JL; National Highway Traffic Safety Administration Countermeasures that work: a highway safety countermeasure guide for state highway safety offices, ninth edition, 2017; report No. DOT HS 812 478. https://www.nhtsa.gov/sites/nhtsa.dot.gov/files/documents/812478_countermeasures-that-work-a-highway-safety-countermeasures-guide-.pdf. Published 2018. Accessed September 27, 2018.


