

Abstract
Objective: To investigate whether the magnetic resonance (MR) T2 image signal intensity ratio and clinical manifestations can predict the prognosis in patients with cervical spondylotic myelopathy (CSM).
Methods: A total of 73 patients treated with anterior, posterior, or posterior‐anterior combined surgery for compressive cervical myelopathy were enrolled retrospectively in this study. 1.5 T magnetic resonance imaging (MRI) was performed on all patients before surgery. T2‐weighted images (T2WI) of sagittal signal intensity were obtained of the cervical spinal cord, and the regions of interest (ROI) were taken by 0.05 cm2. MR T2WI of sagittal normal cord signal at the C7‐T1 disc level were also obtained, and the ROI were taken by 0.3 cm2. Signal value was measured by computer and the signal ratio between regions 0.05 cm2 and 0.3 cm2 calculated. Where no intramedullary high signal intensity was noted on MR T2WI, the ROI were taken by 0.05 cm2 of the region of most severe spinal cord compression. The 73 patients were divided into three groups by hierarchical clustering analysis with signal intensity ratio (group 1: low signal intensity ratio; group 2: middle signal intensity ratio; group 3: high signal intensity ratio). Statistical analyses were performed with SPSS 11.0.
Results: There were significant differences between the three groups according to the recovery rate (P < 0.001), age (P= 0.003), duration of disease (P= 0.001), Babinski sign (P < 0.001), pre‐ and postoperative Japanese Orthopaedic Association (JOA) score (P= 0.006). With increases in both signal intensity ratio grade and age, the recovery rate and pre‐ and postoperative JOA scores gradually decreased, and the incidence of Babinski sign increased. There was no significant difference in sex among the three groups (P= 0.387). Multiple comparison tests further supported the above‐mentioned results.
Conclusion: Patients with light or no intramedullary signal changes on T2WI had a good surgical outcome. However, increase of signal intensity ratio and occurrence of the pyramidal sign were associated with a poor prognosis after surgery.
Keywords: Cervical spondylosis, Magnetic resonance imaging, Prognosis
Introduction
Cervical spondylotic myelopathy (CSM) is the commonest cause of spinal cord dysfunction. Magnetic resonance imaging (MRI) is an important investigation in patients with CSM. MRI can show not only the degree of spinal canal stenosis but also intramedullary changes in the spinal cord in detail 1 . Furthermore, increased signal intensity (ISI) is often observed in patients with cervical compressive myelopathy. However, the significance of ISI for prognosis remains controversial 2 , 3 , 4 , 5 , 6 , 7 , 8 , 9 , 10 , 11 , 12 , 13 . The aim of the present study was to calculate signal intensity ratio, and to determine whether MR T2 image signal intensity ratio and clinical manifestations can predict the prognosis of the disease.
Materials and methods
With approval by the ethics boards of the involved institution, a total of 164 patients with CSM were studied from April 2005 to July 2007. The study complies with the current laws of China, and informed consent was obtained from all patients who participated. Of these, 73 patients who had been followed up for 12 months were enrolled in this study. There were 49 men and 24 women; the mean age was 53.27 years (range 34 to 77 years). Patients with traumatic cervical myelopathy, neoplasia, Vitamin B12 deficiency, amyotrophic lateral sclerosis, arteriovenous malformations, congenital anomalies, demyelinating disease, and vasculitis were excluded from the study. Age, sex, duration of disease, and results of physical examination including Hoffmann and Babinski signs and knee jerk, were noted before surgery for all patients. A modified JOA scoring system was used to determine pre‐ and postoperative functional status. The recovery rate after treatment was calculated using the Hirabayashi method:
 |
(1) |
All patients were treated with anterior, posterior or posterior‐anterior combined decompression surgery. With the anterior cervical approach, the posterior longitudinal ligament was removed to decompress the spinal cord. Also cervical plates, interposition bone grafts or titanium cages were used in some cases. Expansive laminoplasty was performed by the posterior approach.
All patients underwent high‐resolution MRI with a 1.5 T imager (SIEMENS MAGNETOM Symphony, Munich, Germany) before surgery. T1‐ and T2‐weighted images (T1WI, T2WI) of sagittal views of the cervical cord were obtained using a spin echo sequence system for T1WI and a fast spin echo sequence system for T2WI. A surface coil was used. The slice width was 4 mm and the acquisition matrix 512 × 256. The sequence parameters were repetition time (TR) 612 ms/echo time (TE) 13 ms for T1WI, and TR 2400 ms/TE 114 ms for T2WI. T2WI of the sagittal signal intensity on the compressed severely cervical cord were obtained, and the regions of interest (ROI) taken by 0.05 cm2. T2WI of the sagittal signal intensity on the severely compressed cervical cord were also obtained, and the ROI again taken by 0.05 cm2. MR T2WI of the sagittal normal cord signal on the cervical cord between C7‐T1 disc levels were obtained, and the ROI taken by 0.3 cm2. Signal value was measured by computer to calculate the signal ratio of region 0.05 cm2 to region 0.3 cm2. Where no intramedullary high signal intensity on MR T2WI was observed, the ROI was taken by 0.05 cm2 on the region of severe cord compression.
Statistical analysis
By means of logarithmic transformation of the signal intensity ratio, the data were divided into three groups by hierarchical clustering analysis. Analysis of variance (ANOVA) was used to compare continuous variables in the first group, the Pearson χ2 test was used to compare categorical variables in the second group, and the Kruskal‐Wallis H test was applied in the third group (α= 0.05). In addition, multiple comparison tests were applied among the three groups. A multiple linear regression equation was used to determine the relationships between each independent variable and the signal intensity ratio (Renter = 0.10, Rout = 0.15). SPSS 11.0 (SPSS, Chicago, IL, USA) was used for statistical analysis.
Results
For the whole population, the mean JOA score was 8.70 ± 2.47 before surgery, 12.59 ± 2.26 at 6 months after surgery, and 12.45 ± 2.30 at one year after surgery, respectively. The mean recovery rate was (52.58 ± 25.61) % at final follow‐up. The ANOVA for the Hoffmann sign and knee jerk showed no significant difference among the three groups, so these two variables were taken out of the study. The 73 patients were divided into three groups by hierarchical clustering analysis with signal intensity ratio (group 1: low signal intensity ratio; group 2: middle signal intensity ratio; group 3: high signal intensity ratio). There were 18 patients in group 1, 32 in group 2 and 23 in group 3. The mean signal intensity ratio was 1.11 ± 0.05 in group 1, 1.37 ± 0.04 in group 2, 1.82 ± 0.07 in group 3. The range of signal intensity ratio is from 1.041 to 2.066.
The ANOVA for recovery rate (P < 0.001), age (P= 0.003) and preoperative JOA score (P= 0.006) showed significant differences among the three groups (Table 1). The Student‐Newman‐Keuls (SNK) test on recovery rate showed significant differences between groups 1 and 2 (P < 0.05), groups 1 and 3 (P < 0.05), groups 2 and 3 (P < 0.05). The SNK test on age showed significant differences between groups 1 and 2 (P < 0.05) and groups 1 and 3 (P < 0.05), but no significant difference between groups 2 and 3 (P > 0.05). Moreover, the SNK test on the preoperative JOA score showed a significant difference between groups 1 and 3 (P < 0.05), but no significant difference was observed between groups 1 and 2 (P > 0.05) and groups 2 and 3 (P > 0.05, Table 2).
Table 1.
Recovery rate, age and preoperative JOA score in each group
| Index | Group 1 | Group 2 | Group 3 | F‐value | P‐value |
|---|---|---|---|---|---|
| Recovery rate | 0.77 ± 0.12 | 0.51 ± 0.22 | 0.35 ± 0.23 | 22.01 | <0.001 |
| Age | 47.44 ± 6.17 | 53.80 ± 10.94 | 58.40 ± 10.46 | 6.37 | = 0.003 |
| Pre‐JOA score | 10.11 ± 2.83 | 8.78 ± 2.46 | 7.48 ± 2.33 | 5.56 | = 0.006 |
Pre‐JOA score, preoperative JOA score; α= 0.05.
Table 2.
SNK test for recovery rate, age and preoperative JOA score in each pair of groups
| Compared groups | q0.05 | Recovery rate | Age | Pre‐JOA score | |||
|---|---|---|---|---|---|---|---|
| q‐value | P‐value | q‐value | P‐value | q‐value | P‐value | ||
| 1 and 2 | 2.83 | 6.16 | <0.05 | 3.11 | <0.05 | 2.54 | >0.05 |
| 2 and 3 | 2.83 | 4.09 | <0.05 | 2.47 | >0.05 | 2.67 | >0.05 |
| 1 and 3 | 3.40 | 9.32 | <0.05 | 5.01 | <0.05 | 4.70 | <0.05 |
α= 0.05.
The Pearson χ2 test for Babinski sign among different groups showed significant differences (P < 0.001), but no significant difference was found for sex (P= 0.387) among the three groups (Table 3). When the test level for the Babinski sign was adjusted by using the multiple comparison test no significant difference between groups 1 and 2 (P= 0.186) was found. However, there were significant differences between groups 1 and 3 (P < 0.001), groups 2 and 3 (P= 0.002, Table 4).
Table 3.
Babinski sign and sex in each group
| Group | Babinski sign | sex | |||
|---|---|---|---|---|---|
| − | + | M | F | ||
| 1 | 13 | 5 | 11 | 7 | |
| 2 | 17 | 15 | 20 | 12 | |
| 3 | 3 | 20 | 18 | 5 | |
| total | 33 | 40 | 49 | 24 | |
Babinski sign χ2= 15.719, P < 0.001; Sex χ2= 1.898, P= 0.387.
α= 0.05.
Table 4.
Multiple comparison test for Babinski sign
| Groups | χ2‐value | P‐value |
|---|---|---|
| 1 and 2 | 1.751 | 0.186 |
| 2 and 3 | 9.290 | 0.002 |
| 1 and 3 | 14.861 | <0.001 |
α= 0.0167.
The Kruskal‐Wallis H test for logarithmic transformation of signal intensity ratio (P < 0.001), postoperative JOA score (P < 0.001) and duration of disease (P= 0.001) all showed significant differences among the three groups (Table 5). The Bonferroni test for logarithmic transformation of signal intensity ratio showed significant differences between groups 1 and 2 (P < 0.001), groups 1 and 3 (P < 0.001) and groups 2 and 3 (P < 0.001). The Bonferroni test for postoperative JOA score also showed significant differences between groups 1 and 2 (P < 0.001), groups 2 and 3 (P= 0.005) and groups 1 and 3 (P < 0.001). The test for duration of disease showed significant differences between groups 1 and 2 (P= 0.008) and groups 1 and 3 (P < 0.001), but no significant difference between groups 2 and 3 (P= 0.108, Table 6). With increase of the grade of signal intensity ratio, the postoperative JOA score gradually decreased, and the duration of disease significantly increased in group 3.
Table 5.
Logarithmic transformation of signal intensity ratio, postoperative JOA score and duration of disease in each group
| Group | Duration of disease | Post‐JOA score | LgSIR | |||
|---|---|---|---|---|---|---|
| M | (QR) | M | (QR) | M | (QR) | |
| 1 | 3.5 | 7.0 | 16.00 | 2.00 | 0.04 | 0.04 |
| 2 | 12.0 | 18.0 | 13.00 | 4.00 | 0.13 | 0.07 |
| 3 | 24.0 | 78.0 | 10.00 | 3.00 | 0.23 | 0.06 |
| χ2‐value | 13.952 | 25.946 | 62.616 | |||
| P‐value | 0.001 | <0.001 | <0.001 | |||
LgSIR, logarithmic transformation of signal intensity ratio; M, median; post‐JOA score, postoperative JOA score; QR, quartile range.
α= 0.05.
Table 6.
Bonferroni test for logarithmic transformation of signal intensity ratio, postoperative JOA score and duration of disease for each pair of groups
| Groups | Duration of disease | Post‐JOA score | LgSIR | |||
|---|---|---|---|---|---|---|
| z‐value | P‐value | z‐value | P‐value | z‐value | P‐value | |
| 1 and 2 | −2.672 | 0.008 | −3.629 | <0.001 | −5.821 | <0.001 |
| 2 and 3 | −1.608 | 0.108 | −2.838 | 0.005 | −6.279 | <0.001 |
| 1 and 3 | −3.546 | <0.001 | −4.476 | <0.001 | −5.438 | <0.001 |
LgSIR, logarithmic transformation of signal intensity ratio; α'= 0.0167.
We introduced multiple linear regression to the equation:
 |
(2) |
Renter= 0.10, Rout= 0.15, R= 0.653, R 2= 0.427.
The result indicated that the 42.7% variety of signal intensity ratio can be used to demonstrate recovery rate, Babinski sign and sex.
Discussion
ISI of the spinal cord on MR T2WI is often observed in patients with CSM. Some authors have reported that patients with ISI have poor prognosis after surgery 2 , 3 , 4 , 5 , 6 , 7 . However, others have found no correlation between surgical outcome and intramedullary high signal intensity on T2WI 8 , 9 , 10 , 11 , 12 , 13 , 14 . Some authors have concluded that high‐signal change on T2WI is non‐specific and can indicate edema, inflammation, vascular ischemia, gliosis, or myelomalacia 2 , 15 . Al‐Mefty et al. 16 have reported that high signal intensity on T2WI can reflect myelomalacia, while low signal change on T1WI indicates cystic necrosis or secondary syrinx. Harkey et al. 17 have also found that low signal intensity changes on T1WI of the spinal cord coincide with the presence of gross cavities in the spinal cord.
Recently, Yukawa et al. 18 classified ISI on MRI in patients with cervical compressive myelopathy, and investigated the relationship between ISI and prognosis. They indicated that preoperative ISI in sagittal MR T2WI correlates with patient age, duration of disease, postoperative JOA score and recovery rates, and that ISI indicates a poor prognosis, especially intense ISI being associated with worse surgical outcomes than light ISI. Fernández de Rota et al. 19 have concluded that multisegmental high‐intensity change on MR T2WI is associated with a poor functional recovery.
We think that ISI has a large range of variation in signal intensity. Based on the latest MRI techniques and software, various signal values of spinal cord in these patients can be measured.
In the course of our study, we found that each patient had different T2WI signal values both on compressed and normal spinal cord, and that increasing signal intensity value alone did not accurately reflect the individual differences among patients. So we considered that it would be more objective to calculate the ratio of signal values. With the method, we can show the signal intensity accurately (Fig. 1). Moreover, the subjective factors of signal intensity classification have been excluded from current study. lesser amount improvement after surgery in patients groups 2 and 3 than group 1 was shown to be due significantly older age, increased incidence Babinski sign, a longer duration disease former two groups. With increasing ratio grade, recovery rate presented gradual downward trend. this series patients, statistically significant difference logarithmic transformation between every pair preoperative JOA score showed 3, but no any other pairs result indicates that same can get different surgical results. However, recuperative potential spinal cord gradually decreased. study, greatest had worst results.
Figure 1.
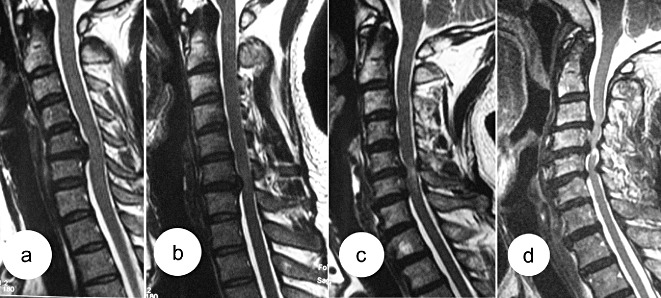
The patients whose cervical spines are shown in (a) and (b) are from group 1; the signal intensity ratio is 1.06 for 1(a) and 1.13 for 1(b); (c) is from group 2; the signal intensity ratio is 1.40; (d) is from group 3; the signal intensity ratio is 1.92.
In addition, multiple linear regression used study relationship variables. correlated rate, sign sex (R 2 = 42.7%). results show correlative ISI are complicated, equation did account for 42.7% ISI. Although there factor three groups, could applied equation. related by controlling sign. is say, event both invariable, would yield within group. first report on measuring various ratios cord. We demonstrated association among objective signs, outcome, MR T2 image CSM.
In our light or intramedullary changes T2WI (group 1) good outcome. occurrence pyramidal poor prognosis occurs those who long disease.
However, retrospective some data bias. lack multicenter reduce reliability statistical analysis. each high‐resolution imager works separately characteristics parameters. Therefore further research issue required.
References
- 1. Ohshio I, Hatayama A, Kaneda K, et al. Correlation between histopathologic features and magnetic resonance images of spinal cord lesions. Spine, 1993, 18: 1140–1149. [DOI] [PubMed] [Google Scholar]
- 2. Mehalic TF, Pezzuti RT, Applebaum BI. Magnetic resonance imaging and cervical spondylotic myelopathy. Neurosurgery, 1990, 26: 217–226. [DOI] [PubMed] [Google Scholar]
- 3. Okada Y, Ikata T, Yamada H, et al. Magnetic resonance imaging study on the results of surgery for cervical compression myelopathy. Spine, 1993, 18: 2024–2029. [DOI] [PubMed] [Google Scholar]
- 4. Matsuda Y, Miyazaki K, Tada K, et al. Increased MR signal intensity due to cervical myelopathy. Analysis of 29 surgical cases. J Neurosurg, 1991, 74: 887–892. [DOI] [PubMed] [Google Scholar]
- 5. Suri A, Chabbra RP, Mehta VS, et al. Effect of intramedullary signal changes on the surgical outcome of patients with cervical spondylotic myelopathy. Spine J, 2003, 3: 33–45. [DOI] [PubMed] [Google Scholar]
- 6. Takahashi M, Yamashita Y, Sakamoto Y, et al. Chronic cervical cord compression: clinical significance of increased signal intensity on MR images. Radiology, 1989, 173: 219–224. [DOI] [PubMed] [Google Scholar]
- 7. Takahashi M, Sakamoto Y, Miyawaki M, et al. Increased MR signal intensity secondary to chronic cervical cord compression. Neuroradiology, 1987, 29: 550–556. [DOI] [PubMed] [Google Scholar]
- 8. Morio Y, Teshima R, Nagashima H, et al. Correlation between operative outcomes of cervical compression myelopathy and mri of the spinal cord. Spine, 2001, 26: 1238–1245. [DOI] [PubMed] [Google Scholar]
- 9. Yone K, Sakou T, Yanase M, et al. Preoperative and postoperative magnetic resonance image evaluations of the spinal cord in cervical myelopathy. Spine, 1992, 17 (10 Suppl.): 388–392. [DOI] [PubMed] [Google Scholar]
- 10. Wada E, Yonenobu K, Suzuki S, et al. Can intramedullary signal change on magnetic resonance imaging predict surgical outcome in cervical spondylotic myelopathy? Spine, 1999, 24: 455–461. [DOI] [PubMed] [Google Scholar]
- 11. Song HT, Jia LS, Yuan W, et al. Effect of signal intensity enhancement of the spinal cord MRI and the indications of surgical treatment in cervical spondylotic myelopathy (Chin). Zhongguo Jizhu Jisui Za Zhi, 2001, 11: 142–145. [Google Scholar]
- 12. Alafifi T, Kern R, Fehlings M. Clinical and MRI predictors of outcome after surgical intervention for cervical spondylotic myelopathy. J Neuroimaging, 2007, 17: 315–322. [DOI] [PubMed] [Google Scholar]
- 13. Mastronardi L, Elsawaf A, Roperto R, et al. Prognostic relevance of the postoperative evolution of intramedullary spinal cord changes in signal intensity on magnetic resonance imaging after anterior decompression for cervical spondylotic myelopathy. J Neurosurg Spine, 2007, 7: 615–622. [DOI] [PubMed] [Google Scholar]
- 14. Okais N, Moussa R, Hage P. Value of increased MRI signal intensity in cervical arthrosis in myelopathies. Neurochirurgie, 1997, 43: 285–290. [PubMed] [Google Scholar]
- 15. Mizuno J, Nakagawa H, Inoue T, et al. Clinicopathological study of ‘snake‐eye appearance’ in compressive myelopathy of the cervical spinal cord. J Neurosurg, 2003, 99 (2 Suppl.): 162–168. [DOI] [PubMed] [Google Scholar]
- 16. Al‐Mefty O, Harkey LH, Middleton TH, et al. Myelopathic cervical spondylotic lesions demonstrated by magnetic resonance imaging. J Neurosurg, 1988, 68: 217–222. [DOI] [PubMed] [Google Scholar]
- 17. Harkey HL, Al‐Mefty O, Marawi I, et al. Experimental chronic compressive cervical myelopathy: effects of decompression. J Neurosurg, 1995, 83: 336–341. [DOI] [PubMed] [Google Scholar]
- 18. Yukawa Y, Kato F, Yoshihara H, et al. MR T2 image classification in cervical compression myelopathy: predictor of surgical outcomes. Spine, 2007, 32: 1675–1678. [DOI] [PubMed] [Google Scholar]
- 19. Fernández de Rota JJ, Meschian S, Fernández de Rota A, et al. Cervical spondylotic myelopathy due to chronic compression: the role of signal intensity changes in magnetic resonance images. J Neurosurg Spine, 2007, 6: 17–22. [DOI] [PubMed] [Google Scholar]