Abstract
Objective: To investigate the effects and possible mechanism of rifampicin on steroid‐induced osteonecrosis of the femoral head (ONFH).
Methods: Bone marrow stromal cells (BMSC) separated from male rats were cultured in vitro without any treatment (Group mA), exposed to dexamethasone (Group mB), treated with rifampicin (Group mC), and exposed to dexamethasone and rifampicin simultaneously (Group mD) respectively (n = 5 in each group). After 7 days, P‐glycoprotein (P‐gp) activity and adipogenesis of the BMSC were evaluated. In an in vivo experiment, 80 rats were randomly divided into 4 groups (n= 20 in each group). Group A received intragastric saline for 5 weeks. Group B received intragastric saline for one week, followed by subcutaneous methylprednisolone and saline for 4 weeks. Group C received intragastric rifampicin for 5 weeks. Group D received intragastric rifampicin for one week, followed by subcutaneous methylprednisolone and rifampicin for 4 weeks. At the end of the experiment, all rats underwent analysis of P‐gp activity of BMSC, P‐gp expression in the femoral heads, MRI and histomorphometry of the femoral heads.
Results: In vitro, the P‐gp activity of BMSC increased and lipid accumulation decreased significantly in Group mD, compared to Group mB. In vivo, P‐gp activity and P‐gp expression in Group D increased compared to Group B. The mean area of MRI abnormal signal, adipocytic variables and apoptotic cells in Group D decreased, mean percentage of the whole epiphysis made up by the epiphyseal ossification center and trabecular structure variables improved compared to those in Group B. The incidence of ONFH was lower in Group D (50%) than in Group B (80%).
Conclusion: Rifampicin may decrease the risk of steroid‐induced ONFH by enhancing P‐gp activity, thus preventing steroid‐induced BMSC adipogenesis.
Keywords: Adipogenesis, Osteonecrosis, P‐glycoprotein, Rifampin, Stromal cells
Introduction
Osteonecrosis of the femoral head (ONFH) is one of the most serious complications induced by high‐dose and (or) long‐term administration of steroid hormones 1 , 2 , 3 . Patients with ONFH often suffer from severe hip pain and impaired hip joint function. The mechanism of corticosteroid‐induced ONFH is still not clear no prophylactic measures to prevent its development have yet been identified.
Recently, P‐glycoprotein (P‐gp) has been reported to be linked to the development of steroid‐induced ONFH and increased P‐gp activity to be statistically correlated with a low risk of steroid‐induced ONFH 2 , 3 , 4 . P‐gp can change the pharmacokinetics of its substrates by pumping them out of cells. As glucocorticoid hormones are substrates of P‐gp, enhanced P‐gp activity can decrease the intracellular availability and accumulation of glucocorticoids, which may be helpful in decreasing the effects of steroids on cells 3 , 4 , 5 . Although P‐gp is expressed in normal tissues and rifampicin has been reported to be an attractive P‐gp activity enhancer, acting by inducing P‐gp expression in vitro and in vivo 6 , 7 , 8 , the effect of enhancement of P‐gp activity by rifampicin on steroid‐induced ONFH has not yet been determined.
Steroid‐induced ONFH is generally thought to be multifactorial, adipogenesis of bone marrow stromal cells (BMSC) being considered to be one of the important pathological mechanisms 9 , 10 . In this study, the effect of rifampicin on BMSC adipogenesis in vitro and the development of steroid‐induced ONFH in vivo was investigated. To our knowledge, this is the first report on preventing steroid‐induced ONFH development in Sprague‐Dawley (SD) rat by using rifampicin prophylactically.
Materials and methods
In vitro research
BMSC culture
BMSC were collected from male SD rats aged from 6 to 7 weeks (provided by the Experimental Animal Centre of the Public Health Clinical Center Affiliated to Fudan University, Shanghai, China). As described by Song et al. 11 , gelatinous marrow was extracted aseptically from the femora with Dulbecco's modification of Eagle's medium (DMEM, Gibco, Grand Island, NY, USA) containing 10% fetal bovine serum (FBS, Biochemical Industries, Beth‐Haemek, Israel), then dispersed mechanically and suspended in phosphate‐buffered saline (PBS). The cells were carefully poured over a Percoll gradient (d = 1.073 g/ml, Sigma, St Louis, MO, USA) and centrifuged for 20 min at 900 g. The intermediate zone, enriched in BMSC, was diluted with an equal volume of PBS and centrifuged at 900 g for 10 min. The resulting pellet was suspended in complete DMEM medium supplemented with 10% FBS, 100 U/ml penicillin and 100 U/ml streptomycin. The cell suspension was plated at a density of about 5 × 10⁸ nucleated cells per ml in complete medium and cultured in 95% humidified air and 5% CO2 at 37°C. Non‐adherent hematopoietic cells were removed by changing the medium. Thereafter, the medium was changed every 2–3 days. After three passages, the hematopoietic cells were discarded and the BMSC purified. BMSC from passages 4–6 were used for the experiments. The BMSC were plated in 24‐well plates at a density of 1 × 10⁵/ml. The BMSC in Group mA (n= 5) were cultured without any treatment, in Group mB (n= 5) they were exposed to 1 × 10⁻⁶ mol/L dexamethasone (DEX, Sigma), in Group mC (n= 5) to 5 µg/ml rifampicin (Sigma), and in Group mD (n= 5) to 5 µg/ml rifampicin and 1 × 10⁻⁶ mol/L DEX simultaneously. All groups were cultured for 7 days.
Assay of P‐gp activity of BMSC
P‐gp activity was detected as described by Feller et al. 12 . Retention of intracellular fluorescence was used to represent P‐gp activity. P‐gp activity increases when the mean fluorescent value decreases. The samples were digested with 0.05% trypsin‐0.02% ethylenediaminetetraacetic acid (EDTA, Gibco) and the BMSC suspended in DMEM containing 10% FBS and 2 µg/ml rhodamine 123. The samples were processed as follows: maintained in a humid atmosphere of 5% CO2 at 37°C for 10 min and centrifuged at 200 g for 10 min, washed twice with PBS containing 10% FBS, maintained in DMEM containing 10% FBS in a humid atmosphere of 5% CO2 at 37°C for 60 min, and assessed by the FACSAria flow cytometer (FCM, BD Biosciences, Franklin Lakes, NJ, USA) immediately after the processes. The excitation and emission wave lengths were 488/525 nm for rhodamine 123. A 50 µl sample without rhodamine 123 was analyzed by FCM as a control.
Adipogenesis of BMSC
After the BMSC had been cultured for 7 days, all groups were stained with Oil Red “O” (Sigma) to detect cytoplasmic lipid droplets. The number of adipocytes in a 100 mm2 area on each cover glass in 24‐well plates was counted under a light microscope. The average number of adipocytes in each group was calculated. Alkaline phosphatase (AKP) cytochemistry was performed using a diagnostic kit (Shanghai Hongqiao Chemical Reagent, Shanghai, China) according to the manufacturer's specifications. The BMSC in all groups were lysed by cell lysate (Sigma) for 10 min. Thereafter, the cells were centrifuged at 700 g for 10 min. The AKP activity and triglyceride of the supernatants were determined by a fully automatic biochemical analyzer (Roche Diagnostics, Mannheim, Germany).
In vivo research
Animals
The experimental protocol was approved by the Committee of Animal Experimentation of Fudan University. Eighty male SD rats (body weight 250–300 g) were raised in a standard manner under conditions of controlled temperature (24 ± 2°C) and humidity (55% ± 2%) at the Public Health Clinical Center Affiliated to Fudan University. The rats were randomly allocated to four equal groups. Group A (n= 20) received 2 ml of intragastric saline for 5 weeks. Group B (n= 20) received 2 ml of intragastric saline for 5 weeks and were co‐administered about 21 mg/kg/day of methylprednisolone sodium succinate (MPSL, Pfizer Manufacturing Belgium NV, Puurs, Belgium) subcutaneously in their backs from the second week. Group C (n= 20) received about 10 mg/kg/day of intragastric rifampicin for 5 weeks. Group D (n= 20) received about 10 mg/kg/day of intragastric rifampicin for 5 weeks and were co‐administered about 21 mg/kg/day of MPSL subcutaneously in their backs from the second week. The rats were weighed weekly. At the end of the fifth week, all rats were anesthetized and killed after magnetic resonance imaging (MRI) had been performed. Blood samples for subsequent testing were drawn by intracardiac aspiration. The right proximal femora and femoral heads were fixed in paraformaldehyde for 48 h, then prepared for paraffin embedding after decalcification with 10% EDTA (Sigma) solution. The femoral heads were cut into four‐micrometer sections along the coronal plane and parallel to the longitudinal axis of the femur. The sections were used for macropathological and histological studies.
MR scanning
MRI scanning was performed with a Philips Intera Achieva 1.5T MR imaging system (Philips Medical Systems, Best, the Netherlands) All rats were positioned in a stereotactic device and placed within a rat coil (Shanghai Chenguang Medical Technologies, Shanghai, China). All rats underwent T1‐weighted images (T1‐WI) (TR/TE, 500/20, FOV 80 mm) and T2‐weighted images (T2‐WI) (TR/TE, 1909/100, FOV 80 mm). The mean percentage area of abnormal signals in the femoral heads was analyzed using Image Pro Plus software 6.0 (Media Cybernetics, Bethesda, MD, USA).
Serum lipids analysis
The serum was separated from 2 ml blood samples. Serum concentrations of triglyceride (TG), high‐density lipoprotein (HDL), low‐density lipoprotein (LDL), and total cholesterol (TC) were measured with a Full Automatic Biochemical Analyzer (Roche Modular‐T, Roche).
Assay of P‐gp activity of BMSC
The BMSCs were collected from femurs by density gradient centrifugation. P‐gp activity was measured using the same procedure as in the in vitro studies.
Immunohistochemical staining for P‐gp in the femoral heads
Sections were immunostained with avidin‐biotin‐peroxidase procedure. After deparaffinization and rehydration, the sections were treated with 0.5% hydrogen peroxide to block endogenous peroxidase activity, incubated with normal rabbit serum (DAKO, Hamburg, Germany) for 30 min at 37°C and then incubated with mouse monoclonal antibody C219 (Abcam, Cambridge, UK) (diluted 1:20) overnight in a moist chamber at 4°C. During the following day, the tissue sections were incubated with a secondary rabbit anti‐mouse antibody (DAKO), and with horseradish peroxidase (HRP)‐labeled streptavidin (DAKO). The final reaction product was revealed by exposure to 0.03 per cent diaminobenzidine (Sigma), and the nuclei counterstained with hematoxylin. For each specimen, a negative control was obtained by staining a sample with the secondary antibody only.
Western blot for P‐gp expression in the femoral heads
The left femoral head was snap‐frozen in liquid nitrogen and crushed with a tissue grinder in radioimmunoprecipitation assay buffer and extracted at 4°C for 30 min. The lysate was subsequently centrifuged at 15 000 g for 10 min at 4°C. The protein concentration of the soluble fraction was measured with bicinchoninic acid Protein Assay reagent (Pierce, Rockford, IL, USA). Laemmli buffer (6×) was added to the sample to a final concentration of 1× and 50 µg of the preparation loaded on 10% sodium dodecyl sulfate polyacrylamide gels. After electrophoresis, the proteins were transferred onto a nitrocellulose membrane (Schleicher & Schuell, Dassel, Germany) and immunolabeled with mouse monoclonal antibody C219 (diluted 1:20) overnight at 4°C. HRP‐labeled goat anti‐mouse (Santa Cruz Biotechnology, Santa Cruz, CA, USA) was used as the secondary antibody. The proteins were detected with enhanced chemiluminescence (Amersham Life Sciences, Piscataway, NJ, USA). The membranes were exposed to autoradiographic films for 20 min (Eastman Kodak, Rochester, NY, USA). The relative expressions were quantified densitometrically using Quantity One software (Bio‐Rad Laboratories, Richmond, CA, USA) and calculated according to the density of the reference bands of β‐actin.
Histological examination
Macropathological findings were observed using a stereomicroscope. The percentage of the whole epiphysis made up by the epiphyseal ossification center (EOC) was measured using software Image Pro Plus software 6.0.
The femoral head sections were stained with hematoxylin‐eosin and their microphotos captured under a magnification of ×40. Image Pro Plus software 6.0 was used to calculate the three‐dimensional structural variables of the trabeculae (trabecular thickness [Tb.Th], trabecular number [Tb. N], and trabecular separation [Tb. Sp]) from two‐dimensional measurements of bone perimeter, bone area, and tissue area, according to Parfitt's “plate” model for cancellous bone structure 13 , 14 .
Using an in situ cell death detection kit (Roche Applied Science), a fluorescein TUNEL assay was performed according to the manufacturer's instructions. Green fluorescence images of the apoptotic cells could be seen under fluorescence microscopy. Five microphotos of slices of the femoral head under a magnification of ×200 were taken and the number of TUNEL positive cells in the photos counted.
In this series, a diagnosis of osteonecrosis was made where abnormalities on MRI and corresponding histological changes existed simultaneously.
Adipogenesis in the femoral heads
Adipogenesis was assessed by determining the adipose tissue area, number of adipocytes (number of adipocytes/bone marrow area), and adipocyte perimeter. The adipose tissue area was expressed as the percentage of the total bone marrow area occupied by adipocytes. The number of adipocytes was expressed as total adipocytes per bone marrow area, and adipocyte perimeter, as an indicator of cellular size, was expressed in microns.
Statistical analysis
All data except the incidence of ONFH were expressed as mean ± standard deviation (SD). All analyses were performed with Stata 7.0 software. Differences between the means were assessed by Student's t‐test, except for the evaluation of P‐gp activity without ONFH in Group B, which was assessed using the Mann‐Whitney U‐test. The difference in incidence of ONFH was analyzed using the χ2 test. P < 0.05 denoted a statistically significant difference.
Results
In vitro research
BMSC culture
BMSC were attached to the plates after 24 hours' culture. Most of the attached cells exhibited a fibroblast‐like spindle shape and began to proliferate. After seven days, these fibroblast‐like cells were confluent, became round or polygonal and integrated into a tightly packed monolayer.
Assay of P‐gp activity of BMSC
The mean fluorescent value in Group mA was higher than in Group mB (P < 0.01). No statistical difference between Groups mB and mC was detected for intracellular fluorescence. The mean fluorescent value in Group mD was the smallest of all the groups (P < 0.01, Fig. 1).
Figure 1.
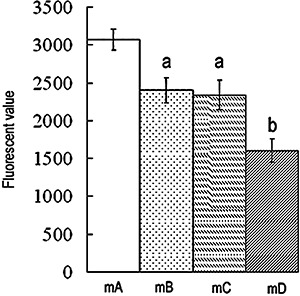
P‐gp activity of BMSC. Retention of intracellular fluorescence reflects P‐gp activity. Low intracellular fluorescence means enhanced P‐gp activity. Results are expressed as mean ± SD. A, P < 0.01 relative to Group mA; b, P < 0.01 relative to Groups mA, mB and mC.
Adipogenesis of BMSC
A few reddish lipid droplets stained by Oil Red “O” were observed in Group mB (Fig. 2A). The number of adipogenic BMSC was significantly decreased in Group mD compared to Group mB (P < 0.01). No statistical difference was found between Groups mA, mC, and mD (Table 1).
Figure 2.
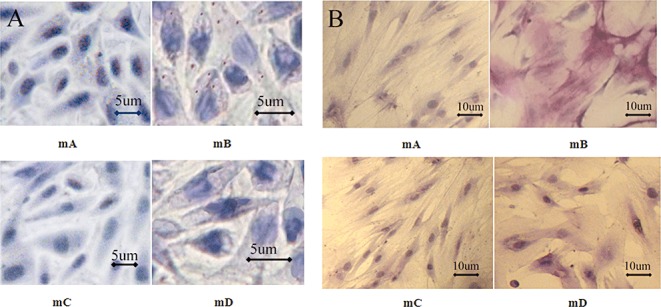
BMSC adipogenesis and AKP staining on the seventh day. (A) mA: BMSC in DMEM medium. No lipid droplets were found. mB: BMSC in medium containing 1 × 10⁻⁶ mol/L DEX. A few lipid droplets were found. mC: BMSC in medium containing 5 µg/ml rifampicin. No lipid droplets were found. mD: BMSC in medium containing 1 × 10⁻⁶ mol/L DEX and 5 µg/ml rifampicin. No lipid droplets were found. All cells cultured for 7 days. (B) mA: Negative AKP staining; mB: Positive AKP staining; mC: Negative AKP staining; mD: Negative AKP staining.
Table 1.
Number of adipogenic cells, TG and AKP quantitative determination in vitro ( )
)
| Groups | Number of adipogenic cells | TG (mmol/L) | AKP (U/L) |
|---|---|---|---|
| mA | 10.80 ± 5.17 | 12.24 ± 0.75 | 29.80 ± 10.33 |
| mB | 90.40 ± 9.02* | 14.03 ± 0.66* | 199.80 ± 68.75* |
| mC | 10.60 ± 3.36 | 12.26 ± 0.77 | 30.60 ± 9.40 |
| mD | 12.60 ± 5.41 | 12.50 ± 0.70 | 44.40 ± 13.78 |
P < 0.01 relative to Groups mA, mC, and mD.
Determination of TG concentration and AKP activity in vitro
The TG concentration (14.03 ± 0.66 mmol/L) was significantly greater in Group mB than in the other groups (P < 0.01). There was no statistical difference between Groups mD (12.50 ± 0.70 mmol/L), mA (12.24 ± 0.75 mmol/L) and mC (12.50 ± 0.70 mmol/L) in TG concentration.
In Group mB, most of the BMSC were positive, and AKP activity (199.80 ± 68.75 U/L) in this group was significantly greater than in the other groups (P < 0.01). AKP staining was negative in both Groups mA and mC, and they showed similarly low levels of AKP activity. The qualitative and quantitative analyses of AKP activity in Group mD were similar to those in Groups mA and mC (Fig. 2B, Table 1).
In vivo research
MR scanning
All femoral heads in Groups A and C were normal, showing homogeneously low to intermediate signal intensity on T1‐ and T2‐WI, respectively. The findings from the 52 femoral heads of Groups D and B were abnormal, with an inhomogeneous and high signal intensity area on T1‐ and T2‐WI, representing lipid deposition in the femoral heads (Fig. 3A). The mean percentage area of abnormal signals in Group D (8.93% ± 6.32%) was smaller than in Group B (17.22% ± 6.53%, P < 0.01). There were no abnormal signals in Groups A and C (Fig. 3B).
Figure 3.
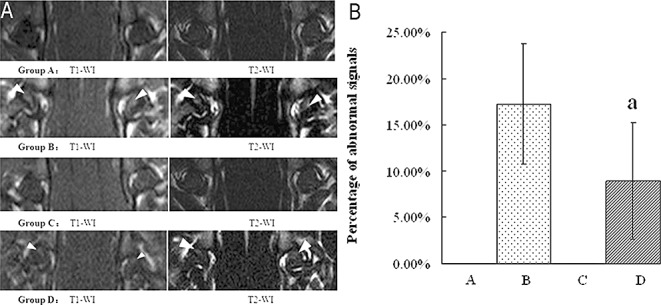
MRI images of the femoral heads, white arrows denote ONFH. (A) MRI images. Group A: abnormal signals were not detected on T1‐WI or on T2‐WI in any rats. Group B: the area of abnormal signals on T1‐WI and T2‐WI is clearer and larger than that in Group D. Group C: abnormal signals were not detected on T1‐WI or on T2‐WI in any rats. Group D: the area of abnormal signals on T1‐WI and T2‐WI in Group D is smaller than that in Group B. (B) Percentage area of abnormal signals. Abnormal signals were detected neither in Group A nor in Group C. Results are expressed as mean ± SD. a, P < 0.01 relative to Group B.
Serum lipid analysis
TG concentrations in Groups D, B, and C were higher than those in Group A (P < 0.01). There were no differences between Groups D, B, and C in TG concentrations. TG concentrations in both Groups D and B were lower than in Group A (P < 0.01). The concentration in Group A was lower than in Group C (P < 0.01). There were no differences between Groups D and B in TG concentration. HDL concentrations in Groups D and B were lower than those in Group A (P < 0.01). No differences were found between Groups A and C, nor between Groups D and B. LDL concentrations in Groups D and Group B were lower than those in Group A (P < 0.01). No differences in LDL concentrations were found between Groups A and C, nor between Groups D and B (Table 2).
Table 2.
Serum lipid analyses in vivo ( , mmol/L)
| Groups | TG | TC | HDL | LDL |
|---|---|---|---|---|
| A | 0.87 ± 0.30 | 1.48 ± 0.23 | 1.14 ± 0.20 | 0.35 ± 0.06 |
| B | 2.04 ± 0.93* | 1.21 ± 0.17* | 0.77 ± 0.15* | 0.12 ± 0.06* |
| C | 1.84 ± 0.11* | 1.66 ± 0.08* | 1.15 ± 0.08 | 0.31 ± 0.04 |
| D | 1.82 ± 1.02* | 1.13 ± 0.24* | 0.76 ± 0.05* | 0.09 ± 0.04* |
P < 0.01 relative to Group A.
Assay of P‐gp activity of BMSC
The mean fluorescent value in Group A was the highest of all groups. No statistical difference was observed between Groups B and C. The results in Group D were the lowest of all groups (P < 0.01, Fig. 4).
Figure 4.
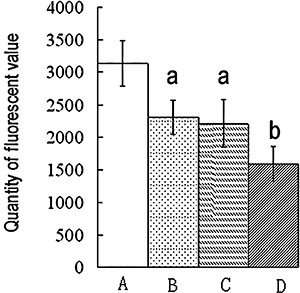
P‐gp activity of BMSC. Low intracellular fluorescence means enhanced P‐gp activity. Results are expressed as mean ± SD. a, P < 0.01 relative to Group A; b, P < 0.01 relative to Groups A, B, and C.
P‐gp expression in femoral heads using immunohistochemical staining and Western blotting
Positive immunohistochemical staining was observed in many bone marrow cells and in a few osteocytic and osteoblastic cells (Fig. 5A).
Figure 5.
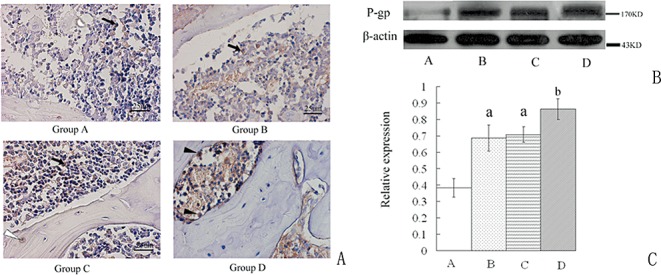
P‐gp expression in the femoral heads. (A) Immunohistochemical staining for P‐gp in the femoral heads. Positive staining shows mainly in the bone marrow cells (long thin arrow), a few osteocytes (black triangle), and osteoblastic cells (white triangle). (B) Western blot. (C) The amounts of the P‐gp were measured by densitometry and normalized to those of β‐actin. Results are expressed as mean ± SD. a, P < 0.01 relative to Group A; b, P < 0.01 relative to Groups A, B, and C.
P‐gp expression in the femoral heads in Group D was the greatest of all the groups (P < 0.01). No difference was found between Groups B and C. P‐gp expression in Group A was the lowest of all the groups (Fig. 5B,C).
Histological findings
In cross section, the EOC appeared to be smaller and the cartilage thicker in Group B compared with that in the other three groups (Fig. 6A,B). The mean percentage of the EOC in the epiphysis in Group B (27.05% ± 8.67%) was significantly smaller than that in Groups A (54.61% ± 5.79%), C (51.45% ± 4.76%), and D (39.02% ± 2.42%); these differences were statistically significant (P < 0.01). No difference was found between Groups A and C (Table 3).
Figure 6.
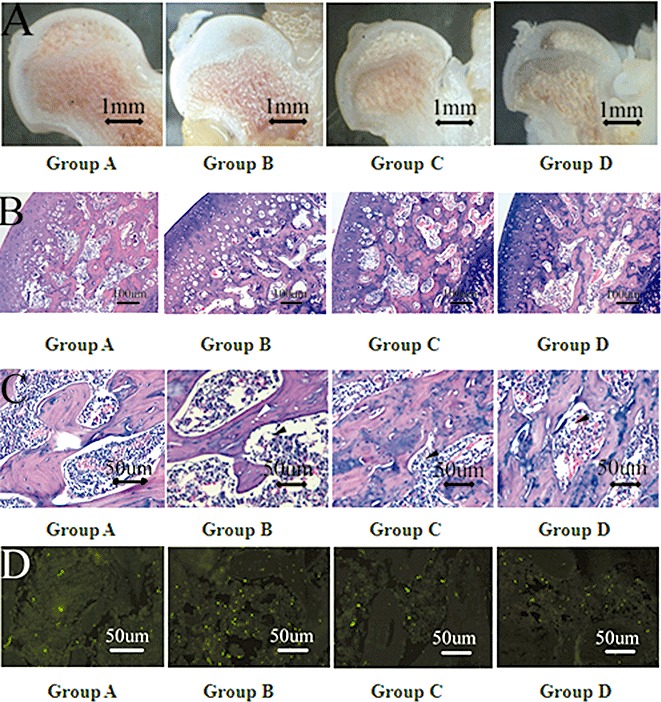
Coronal sections of femoral heads through the teres ligament. (A) Macropathology. Group A: Femoral heads without drug administration. Group B: The area of EOC is decreased compared to that in Groups A and C. Group C: The area of EOC is similar to that in Group A. Group D: The area of EOC is larger than that in Group B, but smaller than that in Groups A and C. (B) HE staining of EOC. Group A: Normal ossification center. Group B: Articular cartilage is thickened. Obvious lipid deposition is found in EOC. Group C: Histological changes are similar to Group A. Group D: Rifampicin has decreased the lipid deposition induced by MPSL. (C) Medullary cavity. Group A: Trabeculae are surrounded by normal marrow cells and a few adipocytes. Group B: Trabeculae are thinner and adipocytes are more numerous and larger compared to those in Group A. Empty lacunae (labeled with white arrow) exist in the trabeculae. Group C: Trabeculae and adipocytes are similar to Group A. Group D: Trabeculae are denser and adipocytes are less numerous and smaller than those in Group B. Adipocytes are labeled with black triangle. (D) TUNEL staining. Group A: A few apoptotic cells are visible in the marrow and in trabeculae. Group B: MPSL has induced significant apoptosis in the marrow and trabeculae. Group C: Apoptosis is similar to Group A. Group D: Rifampicin has decreased the number of apoptotic cells. Apoptosis mainly shows in the marrow. Microphotos are taken under ×200.
Table 3.
Effect of rifampicin on steroid‐induced ONFH assessed by histomorphometry ( )
)
| Groups | EOC (%) | Tb.Th (µm) | Tb.N (N/mm) | Tb.Sp (µm) | Apoptosis |
|---|---|---|---|---|---|
| A | 50.19 ± 6.14 | 59.05 ± 2.78 | 9.17 ± 1.42 | 110.87 ± 16.95 | 25.19 ± 6.97 |
| B | 27.05 ± 8.67* | 50.76 ± 4.65* | 7.83 ± 1.46* | 131.72 ± 25.37* | 83.34 ± 15.16* |
| C | 51.45 ± 4.76 | 59.00 ± 6.50 | 9.24 ± 1.65 | 110.69 ± 18.75 | 25.08 ± 7.36 |
| D | 39.02 ± 2.42*, † | 55.65 ± 7.14 | 9.24 ± 1.72 | 111.26 ± 20.65 | 38.87 ± 18.91*, † |
Quantification of apoptosis was expressed as the number of apoptotic cells in ×200.
P < 0.01 relative to Groups A and C.
P < 0.01 relative to Group B.
In Group B, Tb.Th and Tb.N were significantly smaller, and Tb.Sp was larger than in Group D (P < 0.01). No differences in Tb.Th, Tb.N and Tb.Sp were found between Groups A, C, and D (Fig. 6C and Table 3).
No difference was found between Groups A and C in the number of apoptotic cells. In Group B, MPSL induced the most significant apoptosis (P < 0.01). In Group D, the number of apoptotic cells was significantly decreased compared with that in Group B. The number was more than that in Groups A and C (P < 0.01; Fig. 6D and Table 3).
According to histological and MRI analysis, the incidence of ONFH in Group D (20/40, 50%) was significantly decreased compared to that in Group B (32/40, 80%, P < 0.05).
Adipogenesis in the femoral heads
The adipose tissue area and number and perimeter of adipocytes in Groups B and D were greater than those in Groups A and C (P < 0.01). These variables were smaller in Group D than in Group B. There was no difference between Groups A and C (P > 0.05, Fig. 7).
Figure 7.

Structural variables of fatty marrow in the femoral heads. (A) Adipose tissue area (B) Adipocyte number (C) Adipocyte perimeter. MPSL increased the structural variables of fatty marrow in the femoral heads in Group B. In Group D, rifampicin decreased these variables induced by MPSL which are still more than that in Group A and C. There is no statistical difference between Groups A and C. a, P < 0.01 relative to Groups A and C.
Discussion
Adipogenesis of BMSC is considered to be an important pathological mechanism for steroid‐induced osteonecrosis, which is regarded as a major cause of increasing fatty cells in the femoral head 9 , 10 , 15 .
Our study reveals that P‐gp activity is effectively enhanced and BMSC adipogenesis is inhibited by rifampicin in vitro. The incidence of steroid‐induced ONFH is successfully decreased by administration of rifampicin in vivo.
Induction of BMSC adipogenesis by 1 × 10⁻⁶ mol/L DEX has been confirmed by others 9 . Similar appearances were found in Group mB. However in Group mD, in which rifampicin and DEX were both administered, steroid‐induced BMSC adipogenesis was inhibited. Correspondingly, the mean fluorescence of rhodamine 123 was the smallest in Group mD. In the present study, the fluorescent value of rhodamine 123 was considered to represent the amount of P‐gp activity. Because rhodamine 123 is passively transported into cells, and can be pumped out by P‐gp, the smallest intracellular mean rhodamine 123 fluorescence represents the most significantly enhanced P‐gp activity 12 . Nishimura et al.and Barnes et al. have reported that intracellular accumulation of DEX can be reduced by enhanced P‐gp activity 6 , 16 . These findings suggest that the enhanced P‐gp activity induced by rifampicin in Group mD may possibly have prevented steroid induced adipogenesis of BMSC via reducing the intracellular availability of DEX. It should be noted that rifampicin alone, without DEX, had no effect on BMSC differentiation.
AKP, an early marker of BMSC osteogenesis, is also expressed in the adipogenic process 17 , 18 . Our results in Group mB support the above conclusion. However, when rifampicin and DEX were administered in Group mD, the AKP values suggested that rifampicin maintained BMSC in an undifferentiated state even in the presence of high concentrations of DEX.
In vivo, the large dose of MPSL administered in Group B induced excessive adipocyte proliferation in the femoral heads. Miyanishi et al. have reported that increased numbers of adipocytes in femoral heads increase the intraosseous pressure and decrease the blood supply, promoting apoptosis and eventually causing ONFH 19 . Steroid‐induced adipogenesis was defined as early osteonecrosis in previous published reports 20 . Our results in Group B support this previous study in that the most significant adipogenesis induced the most obvious apoptosis and the highest incidence of ONFH (80%). Cui et al. found that MPSL induces BMSC into adipocytes in vivo 10 . Our in vitro study demonstrates that rifampicin alleviates steroid‐induced adipogenesis. Excessive adipogenesis would decrease the stem pool of BMSC in the femoral head, causing decreased osteogenesis and leading to bone loss 15 , 21 . In the present study, decreased Tb.N and Tb.Th in Group B were associated with increased amounts of adipose tissue. However, where the P‐gp activity of bone marrow cells and their expression in the femoral heads were most significantly enhanced by rifampicin, the same dose of MPSL induced decreased apoptosis and a low incidence of ONFH (50%). The weakened role of MPSL under these circumstances was simultaneously verified by decreased adipocytic variables. Meanwhile, bone loss was avoided. These findings suggest that adipogenesis inducedby MPSL is attenuated by enhanced P‐gp activity, and that osteogenesis is improved accordingly.
In addition, cyclosporine A and tacrolimus, both P‐gp inhibitors, can increase the incidence of steroid‐induced ONFH 22 , 23 . Our preliminary results show that verapamil, another P‐gp inhibitor, also aggravates steroid‐induced ONFH.
Hyperlipidemia, resulting in lipid deposition in the femoral head, is frequently regarded as another cause of steroid‐induced ONFH. Kawai et al. and Maruno et al. have reported that high concentrations of TC and TG are induced by steroids 24 , 25 . Lipid clearing agents have been introduced to prevent steroid‐induced ONFH 25 , 26 , 27 . In the present study, although the TG concentration was increased by steroid administration in Groups B and D, similar high TG concentrations in Group C were not associated with ONFH. These findings do not support the hyperlipidemia theory.
Rifampicin is also an enhancer of cytochrome P450, a key metabolic enzyme of MPSL, which has recently been reported to reduce the risk of steroid‐induced ONFH 28 . However, rifampicin‐inducible CYP4503A expression depends on P‐gp activity 29 . It remains unclear whether rifampicin alleviates steroid‐induced osteonecrosis mainly through P‐gp in the femoral head or CYP4503A in the liver. The precise role of P‐gp should be further investigated.
In conclusion, rifampicin can effectively decrease the risk of steroid‐induced ONFH, which can be activated via enhanced P‐gp activity. BMSC adipogenesis plays an important role in the process. Rifampicin may be a potential prophylactic measure for preventing steroid‐induced ONFH.
Disclosure
The corresponding author, Zuo‐qin Yan, representing all authors, certifies that this research did not involve any financial and personal relationships with other people or organizations (such as employers, consultancies, stock ownership, honoraria, paid expert testimonies, patent applications/registrations, grants or other funding) that might pose potential conflicts of interest or bias the findings.
Acknowledgements
This work was supported by the Shanghai Natural Sciences Foundation (07ZR14023).
References
- 1. Murata M, Kumagai K, Miyata N, et al Osteonecrosis in stroke‐prone spontaneously hypertensive rats: effect of glucocorticoid. J Orthop Sci, 2007, 12: 289–295. [DOI] [PubMed] [Google Scholar]
- 2. Kuribayashi M, Fujioka M, Takahashi KA, et al Combination analysis of three polymorphisms for predicting the risk for steroid‐induced osteonecrosis of the femoral head. J Orthop Sci, 2008, 13: 297–303. [DOI] [PubMed] [Google Scholar]
- 3. Asano T, Takahashi KA, Fujioka M, et al ABCB1 C3435T and G2677T/A polymorphism decreased the risk for steroid‐induced osteonecrosis of the femoral head after kidney transplantation. Pharmacogenetics, 2003, 13: 675–682. [DOI] [PubMed] [Google Scholar]
- 4. Yang XY, Xu DH. MDR1(ABCB1) gene polymorphisms associated with steroid‐induced osteonecrosis of femoral head in systemic lupus erythematosus. Pharmazie, 2007, 62: 930–932. [PubMed] [Google Scholar]
- 5. Karssen AM, Meijer OC, Van Der Sandt IC, et al The role of the efflux transporter P‐glycoprotein in brain penetration of prednisolone. J Endocrinol, 2002, 175: 251–260. [DOI] [PubMed] [Google Scholar]
- 6. Nishimura M, Koeda A, Suzuki E, et al Regulation of mRNA expression of MDR1, MRP1, MRP2 and MRP3 by prototypical microsomal enzyme inducers in primary cultures of human and rat hepatocytes. Drug Metab Pharmacokinet, 2006, 21: 297–307. [DOI] [PubMed] [Google Scholar]
- 7. Vautier S, Lacomblez L, Chacun H, et al Interactions between the dopamine agonist, bromocriptine and the efflux protein, P‐glycoprotein at the blood‐brain barrier in the mouse. Eur J Pharm Sci, 2006, 27: 167–174. [DOI] [PubMed] [Google Scholar]
- 8. Machavaram KK, Gundu J, Yamsani MR. Effect of various cytochrome P450 3A and P‐glycoprotein modulators on the biliary clearance of bromosulphaphthalein in male Wistar rats. Pharmazie, 2004, 59: 957–960. [PubMed] [Google Scholar]
- 9. Yin L, Li YB, Wang YS. Dexamethasone‐induced adipogenesis in primary marrow stromal cell cultures: mechanism of steroid‐induced osteonecrosis. Chin Med J (Engl), 2006, 119: 581–588. [PubMed] [Google Scholar]
- 10. Cui Q, Wang GJ, Balian G. Pluripotential marrow cells produce adipocytes when transplanted into steroid‐treated mice. Connect Tissue Res, 2000, 41: 45–56. [DOI] [PubMed] [Google Scholar]
- 11. Song G, Ju Y, Shen X, et al Mechanical stretch promotes proliferation of rat bone marrow mesenchymal stem cells. Colloids Surf B Biointerfaces, 2007, 58: 271–277. [DOI] [PubMed] [Google Scholar]
- 12. Feller N, Kuiper CM, Lankelma J, et al Functional detection of MDR1/P170 and MRP/P190‐mediated multidrug resistance in tumour cells by flow cytometry. Br J Cancer, 1995, 72: 543–549. [DOI] [PMC free article] [PubMed] [Google Scholar]
- 13. Parkinson IH, Fazzalari NL. Interrelationships between structural parameters of cancellous bone reveal accelerated structural change at low bone volume. J Bone Miner Res, 2003, 18: 2200–2205. [DOI] [PubMed] [Google Scholar]
- 14. Parfitt AM, Drezner MK, Glorieux FH, et al Bone histomorphometry: standardization of nomenclature, symbols, and units. Report of the ASBMR Histomorphometry Nomenclature Committee. J Bone Miner Res, 1997, 2: 595–610. [DOI] [PubMed] [Google Scholar]
- 15. Hernigou P, Beaujean F, Lambotte JC. Decrease in the mesenchymal stem‐cell pool in the proximal femur in corticosteroid‐induced osteonecrosis. J Bone Joint Surg Br, 1999, 81: 349–355. [DOI] [PubMed] [Google Scholar]
- 16. Barnes KM, Dickstein B, Cutler GB Jr, et al Steroid treatment, accumulation, and antagonism of P‐glycoprotein in multidrug‐resistant cells. Biochemistry, 1996, 35: 4820–4827. [DOI] [PubMed] [Google Scholar]
- 17. Justesen J, Stenderup K, Eriksen EF, et al Maintenance of osteoblastic and adipocytic differentiation potential with age and osteoporosis in human marrow stromal cell cultures. Calcif Tissue Int, 2002, 71: 36–44. [DOI] [PubMed] [Google Scholar]
- 18. Hanada K, Dennis JE, Caplan AI. Stimulatory effects of basic fibroblast growth factor and bone morphogenetic protein‐2 on osteogenic differentiation of rat bone marrow‐derived mesenchymal stem cells. J Bone Miner Res, 1997, 12: 1606–1614. [DOI] [PubMed] [Google Scholar]
- 19. Miyanishi K, Yamamoto T, Irisa T, et al Bone marrow fat cell enlargement and a rise in intraosseous pressure in steroid‐treated rabbits with osteonecrosis. Bone, 2002, 30: 185–190. [DOI] [PubMed] [Google Scholar]
- 20. Ficat RP. Idiopathic bone necrosis of the femoral head. Early diagnosis and treatment. J Bone Joint Surg Br, 1985, 67: 3–9. [DOI] [PubMed] [Google Scholar]
- 21. Justesen J, Stenderup K, Ebbesen EN, et al Adipocyte tissue volume in bone marrow is increased with aging and in patients with osteoporosis. Biogerontology, 2001, 2: 165–171. [DOI] [PubMed] [Google Scholar]
- 22. Miyanishi K, Yamamoto T, Irisa T, et al Effects of cyclosporin A on the development of osteonecrosis in rabbits. Acta Orthop, 2006, 77: 813–819. [DOI] [PubMed] [Google Scholar]
- 23. Miyanishi K, Yamamoto T, Irisa T, et al Effects of tacrolimus (FK506) on the development of osteonecrosis in a rabbit model. Immunopharmacol Immunotoxicol, 2008, 30: 79–90. [DOI] [PubMed] [Google Scholar]
- 24. Kawai K, Tamaki A, Hirohata K. Steroid‐induced accumulation of lipid in the osteocytes of the rabbit femoral head. A histochemical and electron microscopic study. J Bone Joint Surg Am, 1985, 67: 755–763. [PubMed] [Google Scholar]
- 25. Maruno H, Shimizu T, Kawai K, et al The response of osteocytes to a lipid clearing agent in steroid‐treated rabbits. J Bone Joint Surg Br, 1991, 73: 911–915. [DOI] [PubMed] [Google Scholar]
- 26. Pritchett JW. Statin therapy decreases the risk of osteonecrosis in patients receiving steroids. Clin Orthop Relat Res, 2001, 386: 173–178. [DOI] [PubMed] [Google Scholar]
- 27. Cui Q, Wang GJ, Su CC, et al The Otto Aufranc Award. Lovastatin prevents steroid induced adipogenesis and osteonecrosis. Clin Orthop Relat Res, 1997, 344: 8–19. [PubMed] [Google Scholar]
- 28. Masada T, Iwakiri K, Oda Y, et al Increased hepatic cytochrome P4503A activity decreases the risk of developing steroid‐induced osteonecrosis in a rabbit model. J Orthop Res, 2008, 26: 91–95. [DOI] [PubMed] [Google Scholar]
- 29. Schuetz EG, Schinkel AH, Relling MV, et al P‐glycoprotein: a major determinant of rifampicin‐inducible expression of cytochrome P4503A in mice and humans. Proc Natl Acad Sci USA, 1996, 93: 4001–4005. [DOI] [PMC free article] [PubMed] [Google Scholar]


