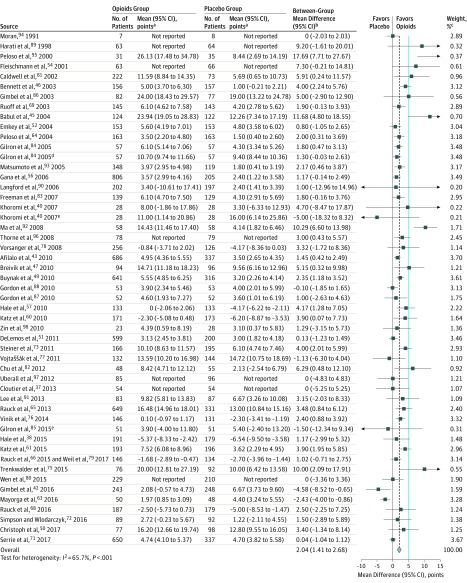
Figure 3. Physical Functioning Assessed by the 100-Point 36-Item Short Form Physical Component Score Among Patients With Chronic Noncancer Pain Who Received Opioids vs Placebo in 51 High-Quality Randomized Clinical Trials.
The blue line represents the minimally important difference of 5 points on the 100-point 36-item Short Form physical component score. The dashed vertical line represents the overall pooled measure of association.
aWithin-group change from baseline data.
bBetween-group differences in change from baseline data.
cWeights are from random-effects analyses.
dComparison was morphine plus gabapentin vs gabapentin alone.
eComparison was morphine plus nortriptyline vs nortriptyline alone.

