

Abstract
High rates of APOBEC-signature mutations are found in many tumors, but factors affecting this mutation pattern are not well understood. Here, we explored the contribution of two common germline variants in the APOBEC3 region. A single nucleotide polymorphism, rs1014971, was associated with bladder cancer risk, increased APOBEC3B expression, and enrichment with APOBEC-signature mutations in bladder tumors. In contrast, a 30 Kb deletion that eliminates APOBEC3B and creates APOBEC3AB chimera, was not important in bladder cancer, while being associated with breast cancer risk and enrichment with APOBEC-signature mutations in breast tumors. In vitro, APOBEC3B was predominantly induced by treatment with a DNA-damaging drug in bladder cancer cell lines and APOBEC3A was induced as part of antiviral interferon-stimulated response in breast cancer cell lines. These findings suggest a tissue-specific role of environmental oncogenic triggers, particularly in individuals with germline APOBEC3 risk variants.
Somatic mutations of a specific type (C to T or G substitutions in the TCA or TCT motifs) have been described in many tumors as APOBEC-signature mutations1–5. These mutations are generated by cytidine deaminase activity of proteins belonging to the apolipoprotein B mRNA-editing enzyme, catalytic polypeptide-like (APOBEC) family6,7. APOBEC-signature mutagenesis has been linked with activity of two members of the APOBEC3 subfamily - APOBEC3B (A3B) and APOBEC3A (A3A)3,8,9. All APOBEC3 proteins (A3A, A3B, A3C, A3D, A3F, A3G, and A3H) are encoded by genes located within a 200 Kb APOBEC3 genomic cluster on chromosome 22q13.1.
Two common germline variants in this region have been associated with cancer risk. The first variant is a single nucleotide polymorphism (SNP), rs1014971, which is located upstream of the APOBEC3 cluster10. This SNP has been associated with risk for bladder cancer in a genome-wide association study (GWAS) in individuals of European ancestry10, and replicated in a Japanese study11. The second variant is a 30 Kb deletion, which fuses the coding region of A3A with the 3’ untranslated region (3’UTR) of A3B, resulting in the loss of A3B and the gain of chimeric transcript A3AB that encodes A3A12. Both A3A and A3AB transcripts encode A3A enzyme, but the presence of the 3’UTR from A3B increases the stability of the A3AB transcript and A3A levels in vitro13. The deletion has been associated with increased risk for breast and ovarian cancers14–16, as well as enrichment with APOBEC-signature mutations in breast tumors8,17.
Since APOBEC-signature mutations have been described in both bladder and breast tumors2,3, and associations with germline variants within the APOBEC3 region have been reported for these cancers, we explored whether germline variants in this region are associated with APOBEC-mutagenesis. We also tested some environmental exposures that may induce A3A and A3B expression and contribute to APOBEC-signature mutation pattern.
RESULTS
Fine-mapping and association analysis of the APOBEC3 region
SNP rs1014971 is the original GWAS signal within the 22q13.1 region detected for bladder cancer risk at a genome-wide significance level (p=8.4E-12)10. This SNP is located in an intergenic region, 66 Kb upstream of CBX6 and 20 Kb upstream of A3A, which is the first gene in the APOBEC3 gene cluster. We performed fine-mapping analysis of the region based on 3,125 imputed and 137 genotyped SNPs in the combined bladder cancer NCI-GWAS set of individuals of European ancestry (5,832 cases/10,721 controls)10,18. The strongest associations were detected for three correlated SNPs (all in r2 = 1.0) - the original GWAS SNP, rs1014971, and two additional SNPs, rs1004748 and rs17000526 (Fig. 1, Supplementary Table 1). There was no evidence for a significant independent signal after adjusting for rs1014971 (Supplementary Table 1). Based on data generated by the Breast Cancer Association Consortium (BCAC)19, these three SNPs were also associated with breast cancer risk in the same direction as in bladder cancer, albeit weaker, and only in women with ER+ breast tumors (in Europeans, OR = 1.03, P = 0.0072 for rs1014971-T allele, Supplementary Note).
Figure 1. Fine-mapping analysis of the 22q13.1 region for association with bladder cancer risk.
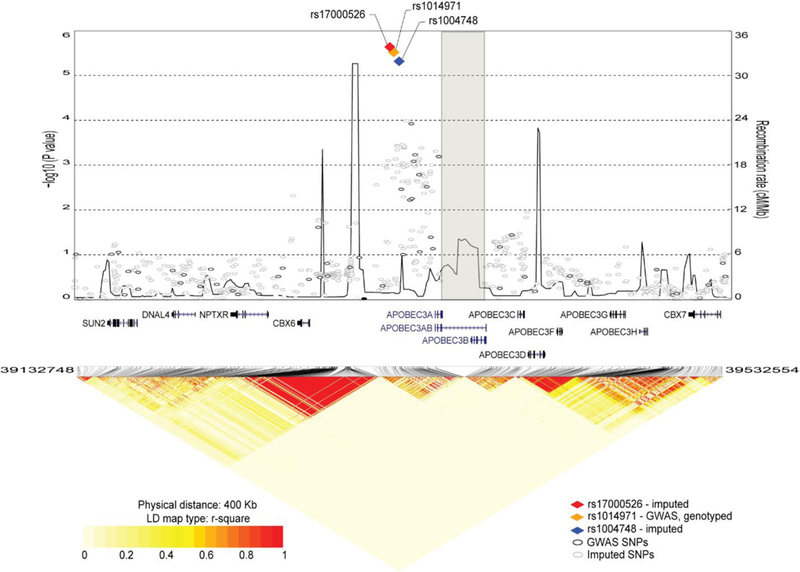
The plot is based on the combined NCI-GWAS1 and NCI-GWAS2 set, which includes 2,301 imputed and 142 genotyped SNPs for 5,832 bladder cancer cases and 10,721 controls of European ancestry. The results are shown for a 400 Kb region centered on GWAS SNP rs1014971, the same region as was used for the eQTL analyses of TCGA data. Left y-axis represents the -log10 (P-values) for association with bladder cancer risk; right y-axis represents the recombination map of the region (cM/Mb), recombination hot spots are connected by line. The SNPs with the strongest signals are presented as colored diamonds; all other SNPs are presented as circles. The position of the deletion is marked by a grey rectangle; APOBEC3AB (A3AB) deletion isoform is labeled within gene track.
The A3AB deletion has been significantly associated with increased breast cancer risk14–16; thus we tested its association with bladder cancer risk. The deletion status was determined directly, by a copy number variation (CNV) assay or indirectly, by TaqMan genotyping of SNP rs12628403 (Supplementary Note, Supplementary Table 2), which has been strongly associated with breast cancer risk in a Chinese population16. We confirmed rs12628403 to be the only available proxy for the CNV with D’ = 1.0, r2 = 1.0 in Europeans and Japanese, D’ = 1.0, r2 = 0.95 in Chinese, but not in Africans where the CNV has 4.2% frequency while rs12628403 is monomorphic (in 1000 Genomes Project populations, Supplementary Fig. 1). Both the CNV and rs12628403 cannot be imputed based on existing 1000 Genomes Project data (Supplementary Fig. 2) and thus require genotyping.
The deletion was more common in controls than in cases both in individuals of European ancestry and Japanese (Table 1); the meta-analysis results showed a significantly reduced bladder cancer risk in carriers of the deletion (OR = 0.85, 95% CI 0.74–0.97, P = 0.013, Table 1). However, association for the deletion disappeared after adjustment for the effect of rs1014971 (Supplementary Table 3); haplotype analysis of the two variants also showed that association was driven by rs1014971 (Table 2). Thus, the effect of the deletion on bladder cancer risk seems to be subsumed by rs1014971.
Table 1.
Association of A3AB deletion with bladder cancer risk in individuals of European ancestry, a Japanese population, and the combined set
| Deletion genotype |
European ancestry 1,719 cases and 2,566 controls |
Japanese 1,116 cases and 945 controls |
Meta-analysis 2,835 cases and 3,511 controls |
Heterogeneity | |||||||
|---|---|---|---|---|---|---|---|---|---|---|---|
| Cases, N (%) |
Controls, N (%) |
OR (CI)* |
P-val* | Cases, N (%) |
Controls, N (%) |
OR (CI) | P-val | OR (CI) | P-val | P-val | |
| I/I | 1,531 (89.06) | 2,221 (86.55) | ref | - | 622 (55.73) | 495 (52.38) |
Ref | - | ref | - | - |
| I/D or D/D | 188 (10.94) | 345 (13.45) | 0.78 | 0.044 | 494 (44.27) |
450 (47.62) |
0.87 (0.73 – 1.04) | 0.128 | 0.85 (0.74 – 0.97) | 0.013 | 0.66 |
A3AB deletion alleles: I - insertion, D –deletion; A3AB deletion genotypes: deletion absence (I/I) vs. deletion presence (I/D or D/D);
ORs and p-values are adjusted for age, sex, smoking status, and study site (SBCS, Spain and PLCO, USA). Ref. – reference group.
Table 2.
Association of SNP rs1014971 and A3AB deletion haplotypes with bladder cancer risk in individuals of European ancestry, a Japanese population, and the combined set
| Haplotype SNP-deletion | Haplotype effect |
European ancestry 1,717 cases and 2,525 controls |
Japanese 1,097 cases and 898 controls |
Meta-analysis 2,814 cases and 3,423 controls |
||||||||
|---|---|---|---|---|---|---|---|---|---|---|---|---|
| Cases, N (%) |
Controls, N (%) |
OR (CI)* | P-val* | Cases, N (%) |
Controls, N (%) |
OR (CI) | P-val | OR (CI)* | P-val | |||
| 1 | T_I | R_R | 2,393 (69.69) |
3,261 (64.49) |
ref | - | 954 (43.48) | 707 (39.37) | ref | - | ref | - |
| 2 | C_I | P_R | 843 (24.55) |
1,446 (28.63) |
0.85 (0.76–0.94) |
0.001 | 674 (30.72) | 595 (33.13) | 0.83 (0.70–0.97) |
0.023 | 0.84 (0.77–0.92) |
3.6 ×10⁻⁵ |
| 3 | C_D | P_P | 147 (4.28) |
275 (5.45) | 0.78 (0.63–0.97) |
0.024 | 544 (24.79) | 477 (26.56) | 0.82 (0.69–0.98) |
0.033 | 0.8 (0.70–0.92) |
0.002 |
| 4 | T_D | R_P | 51 (1.49) |
68 (1.35) | 1.01 (0.69–1.48) |
0.963 | 22 (1.0) |
17 (0.95) |
1.08 (0.69–1.48) |
0.835 | 1.03 (0.73–1.44) |
0.89 |
Haplotypes include SNP rs1014971 with alleles T and C and the A3AB deletion with alleles I – insertion and D - deletion;
Haplotype effect: P - protective, R – risk, based on association with bladder cancer risk;
ORs and p-values are adjusted for age, sex, smoking, and study site (SBCS, Spain and PLCO, USA). N – number of chromosomes. The haplotype in which the risk effect of rs1014971-T allele could be neutralized by the deletion allele (haplotype 4) is uncommon in both populations (~1–1.5% in Europeans and Japanese). The haplotype with the protective rs1014971-C allele and the deletion allele (haplotype 3) is uncommon in Europeans (~5%) and common in the Japanese (~25%), but the protective effect of this haplotype is similar to that of the haplotype with the protective allele of rs1014971 alone (haplotype 2). Ref. - reference group.
SNP rs17000526 is associated with A3B expression in tumors
We analyzed data generated by The Cancer Genome Atlas (TCGA)20,21 focusing on a 400 Kb region that included the APOBEC3 gene cluster and flanking genes. We evaluated expression of each gene isoform within this region in relation to SNP rs17000526 (a TCGA-genotyped proxy for rs1014971, r2 = 1.0). Only expression of the major A3B isoform (uc003awo.1, further referred to as A3B) was significantly associated with rs17000526 in bladder and breast tumors, with higher expression observed in carriers of the risk allele A (Supplementary Tables 4 and 5 for exploratory analysis adjusting only for age, sex, and race). In an expanded multivariate linear regression analysis of A3B expression we evaluated effects of SNP rs17000526, age, sex, race, DNA methylation of a CpG site found to be significantly associated with A3B expression (Supplementary Table 6), and somatic copy number alterations (CNA). This analysis showed significant association of SNP rs17000526 with A3B expression, with per-allele beta-coefficients = 0.25, P = 5.37E-04 for bladder tumors (Fig. 2A, B) and 0.19, P = 5.99E-03 for breast tumors (Fig. 2C, D).
Figure 2. Analysis of factors contributing to APOBEC mutagenesis in bladder and breast tumors in TCGA.
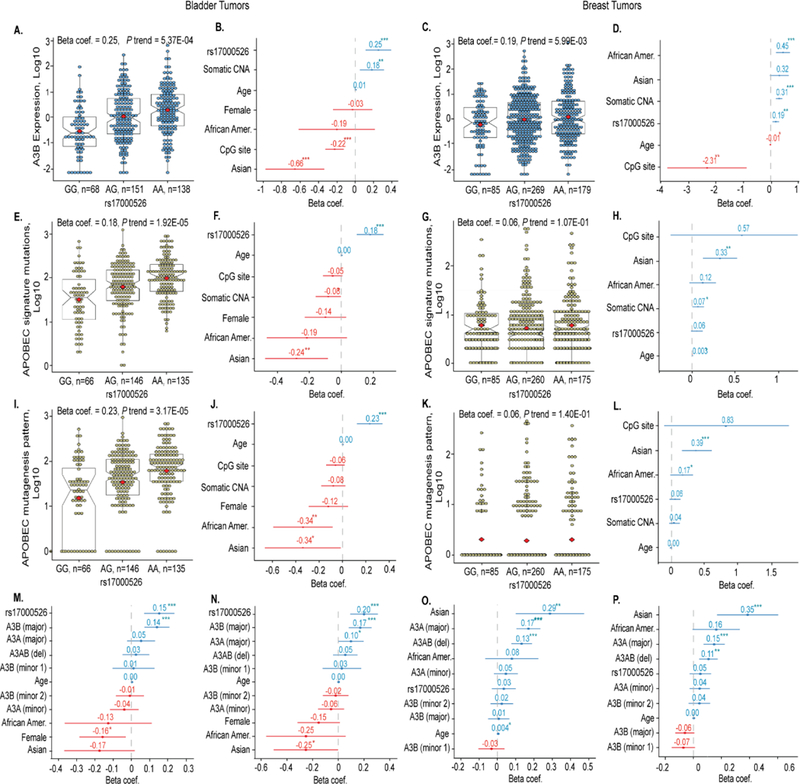
(A-D). Quantile-normalized log10 values of A3B mRNA expression in relation to rs17000526 genotypes and corresponding beta-coefficients for each variable. In box plots, whiskers indicate minimum and maximum range, box overlays indicate first and third quartiles, notches refer to medians, and square overlays (in red) mark the means. (E-H). Log10 values of the APOBEC-signature mutations in relation to rs17000526 genotypes and corresponding beta-coefficients for each variable. (I-L). Log10 values of the APOBEC mutagenesis pattern in relation to rs17000526 genotypes and corresponding beta-coefficients for each variable. (M and O). Beta-coefficients for variables contributing to APOBEC-signature mutations. (N and P). Beta-coefficients for variables contributing to APOBEC mutagenesis pattern. Isoforms are annotated as the major, minor, or deletion (A3AB) transcripts as presented in Supplementary Table 4. Beta-coefficients labeled in blue and red indicate positive and negative correlations, respectively. Male gender and European ancestry are used as reference groups. The CNA represents somatic copy number alterations of A3B. P-values are based on multivariate linear regression analysis: *<0.05; **<0.005, ***<0.0005. Data used for this analysis is presented in Supplementary Data Set 1.
SNP and A3A/A3B expression predict APOBEC mutagenesis
Next, we analyzed APOBEC mutagenesis using two variables - total counts of APOBEC-signature mutations and APOBEC mutagenesis pattern using public datasets available through Firehose portal (Materials and Methods and Supplementary Data Set 1). APOBEC mutagenesis pattern is a more stringent definition that represents statistically significant enrichment with APOBEC-signature mutations over random mutagenesis3,22. Most of TCGA bladder tumors with APOBEC-signature mutations (347/395) but only a quarter of breast tumors (224/977) show APOBEC mutagenesis pattern. Although analysis of both metrics generated very similar results, we provide them side by side for comparison. In bladder tumors SNP rs17000526 was strongly associated with APOBEC-signature mutations (beta-coefficient = 0.18, P = 1.92E-05, Fig. 2E, F) and APOBEC mutagenesis pattern (beta-coefficient = 0.23, P = 3.17E-05, Fig. 2I,J). Among the 14 known bladder cancer GWAS signals, the association with APOBEC-signature mutations was specific to rs17000526 (Supplementary Table 7). However, rs17000526 was not associated with APOBEC mutagenesis in breast tumors (Fig. 2G, H, K, L). In bladder tumors, rs17000526 and expression of major isoforms of A3B and A3A were significant independent predictors of both metrics of APOBEC mutagenesis – with beta-coefficients of 0.15 and 0.20 for the SNP, 0.14 and 0.17 for A3B expression and 0.05 and 0.10 for A3A (Fig. 2M, N). In breast tumors, Asian ancestry, expression of major A3A isoform and A3AB deletion isoform (corresponds to A3AB germline deletion) were significant independent predictors of both metrics of APOBEC mutagenesis with beta-coefficients of 0.29 and 0.35 for Asian ancestry, 0.17 and 0.15 for A3A expression and 0.13 and 0.11 for A3AB deletion (Fig. 2O, P). Expression levels of A3C, A3F and A3H isoforms were less predictive and all other APOBEC3 isoforms were not predictive of APOBEC mutagenesis in bladder and breast tumors (Supplementary Tables 8 and 9).
SNP rs1014971 shows allele-specific protein binding
The three linked SNPs associated with bladder and breast cancer risk, rs1014971, rs17000526, and rs1004748, are located within a 2 Kb genomic region 20 Kb upstream of A3A. Previously, this region has been reported as a putative long-distance enhancer that interacts with the A3B promoter in lymphoblastoid and bone marrow (CD34+) cells23. Since variants within the A3B promoter were not associated with breast cancer24, mRNA expression and cancer risk could be affected by variation within the long-distance enhancer region. In silico functional annotation of the 2 Kb region showed an enrichment of functional marks characteristic of an enhancer activity around rs17000526 (Fig. 3A).
Figure 3. In silico and experimental analysis of the 2 Kb region that includes GWAS SNP rs1014971 and its two proxy SNPs (r2 ≥ 0.8, in Europeans).
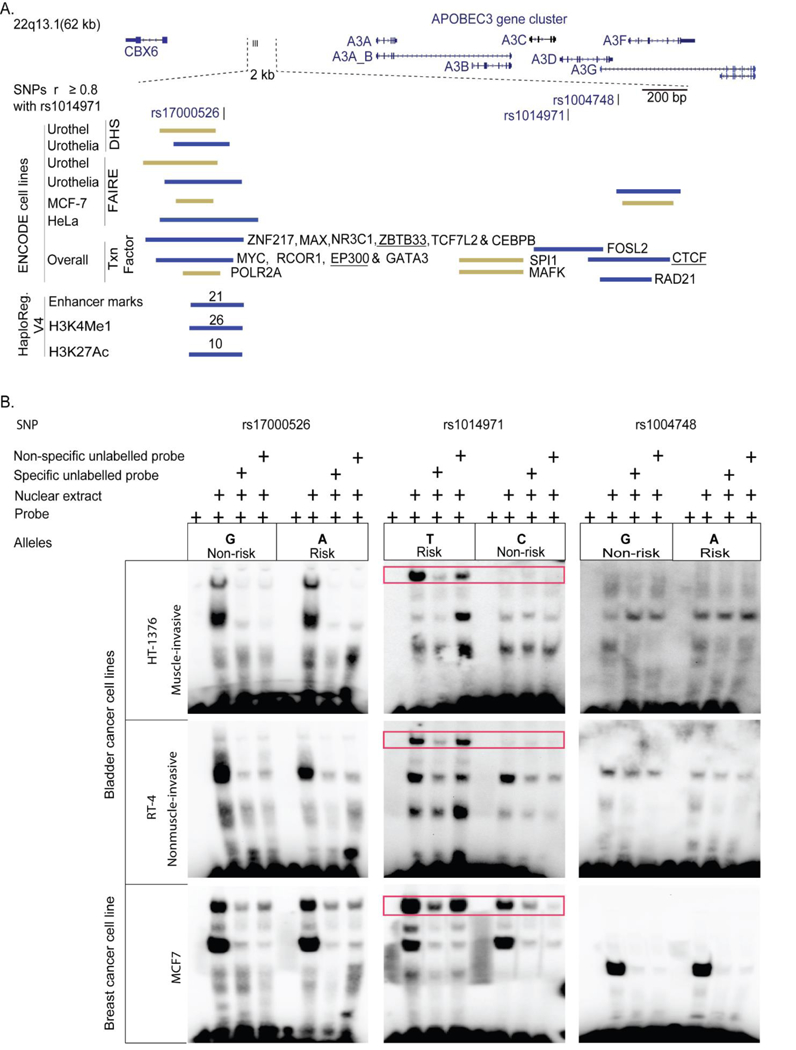
(A). In silico functional analysis based on ENCODE and HaploReg.v4 resources. The plot shows signals detected by chromatin immunoprecipitation and sequencing (ChIP-seq) for different histone marks, CTCF motifs (insulators), DNase hypersensitivity sites (DHS), formaldehyde-assisted isolation of regulatory elements (FAIRE-seq), transcription factor binding sites (Txn Factor), and enhancers from cell lines. Red bars represent signals which overlay the SNPs and green bars represent signals adjacent to SNPs. Numbers on red bars for HaploReg data mark numbers of tissues/cell lines positive for the indicated marks; underlined are weak signals. Enrichment of putative functional signals is observed around SNP rs17000526. (B). Experimental analysis with electrophoretic mobility shift assays (EMSA) for the three associated APOBEC3 SNPs. Red boxes mark allele-specific differences for interaction of SNP rs1014971 with nuclear cell extracts from bladder and breast cancer cell lines. Competition assays were performed with 100-fold excess of unlabeled specific (self) and non-specific (opposite allele) probes. In both bladder cancer cell lines binding was observed only for the risk rs1014971-T allele, while in breast cancer cell line binding was also detected for the non-risk rs1014971-C allele, although it was weaker than for the risk rs1014971-T allele. For SNPs rs17000526 and rs1004748 no distinct allele-specific pattern of binding was observed.
However, electrophoretic mobility shift assays (EMSA) did not show allele-specific binding patterns for rs1004748 and rs17000526 with nuclear protein extracts from two bladder cancer cell lines (HT-1376 and RT-4) and breast cancer cell line MCF-7 (Fig. 3B). In contrast, in bladder cancer cell lines the binding was exclusive for the rs1014971-T risk allele, while in the breast cancer cell lines some binding was also observed for the rs1014971-C non-risk allele (Fig. 3B). This binding pattern for rs1014971 was validated in three additional cell lines (Supplementary Fig. 3). This is in line with the stronger association of this SNP with A3B expression in bladder compared to breast tumors (beta-coefficient = 0.25 vs. 0.19, respectively, Fig. 2A, C) and stronger estimated effect of this SNP for bladder (OR = 1.13)18 compared to ER+ breast cancer risk (OR = 1.03, Supplementary Note).
APOBEC3s can be induced by environmental factors
APOBEC3s are ubiquitously expressed in many human tissues and cell types25 (Supplementary Fig. 4), but their endogenous baseline expression levels are likely to be non-genotoxic, as has been demonstrated for A3A26. APOBEC3s are mutagenic when overexpressed in vitro26–28, but it is unclear what induces their endogenous expression under physiological conditions. Some APOBECs can be induced as part of interferon-driven innate immune response to viral pathogens, e.g. induction of A3G that restricts human immunodeficiency virus (HIV)29. Induction of A3A and A3B by interferons has also been demonstrated30,31.
To test if A3A, A3B and A3G (used as a control) can be induced as a part of interferon response, we infected three bladder (HT-1376, HTB-9 and RT-4) and three breast cancer cell lines (MCF-7, MDA-MB-231 and T-47D) with Sendai virus (SeV), which is a model non-lytic RNA-virus that induces robust interferon response in diverse human cells32. These cell lines were chosen because they represent some of the major clinical subtypes of bladder and breast tumors (Materials and Methods). As expected for response to an RNA virus33,34, we observed strong induction of many known interferon-stimulated genes (ISGs), including A3G (Supplementary Table 10). There was striking induction of A3A (by 32, 51 and 12,000 fold) in the three breast cancer cell lines, in contrast to a more moderate induction (4, 5 and 167 fold) in the three bladder cancer cell lines (Fig. 4, Supplementary Fig. 5, 6). However, A3B was induced only by 0.84 – 1.75 fold in SeV- infected bladder cancer cells and by 0.15 – 4.89 fold in breast cancer cells, which could be due to relatively high A3B expression already at baseline (Fig. 4, Supplementary Fig. 5, 6).
Figure 4. Expression of APOBEC3s in HT-1376 bladder and MCF-7 breast cancer cell lines infected with Sendai virus (SeV) or treated with DNA-damaging drug bleomycin (Bleo).

(A and C). Increased viral load shows that cells were successfully infected with SeV based on qRT-PCR for a viral-specific transcript; data is presented on log2 scale compared to non-infected samples. (B and D). Expression of A3A, A3B, and A3G in untreated HT-1376 and MCF-7 cells –A3A is expressed significantly lower than A3B; A3G is not detectable in MCF-7 cells. (E and G). A3A, A3B and A3G are significantly induced by SeV infection in both cell lines. (F and H). mRNA expression analysis of A3A, A3B, and A3G in cells untreated (UT) or treated with bleomycin for 5 and 24 hours. Expression of A3B and A3G was significantly induced after 24 hours of treatment in HT-1376 but not in MCF-7 cells. P-values are calculated between control and experiment groups using two-sided T-test. Shown are values for individual biological replicates and means, normalized to endogenous controls and presented on log2 scale. Data used for this analysis is presented in Supplementary Data Set 2.
APOBEC3s introduce mutations by editing single-stranded DNA (ssDNA), which is abundant in conditions associated with DNA damage, repair and replication35, but it is unknown if DNA damage can induce expression of APOBEC3s. To test this, we treated cells with bleomycin, a DNA-damaging drug known to induce DNA breaks36; expression analysis confirmed that interferon response was not induced by this treatment (Supplementary Table 10). Both A3A and A3B were induced in all cell lines but the effect was more robust for A3B, especially in bladder cancer cell lines (Fig. 4, Supplementary Fig. 5 and 6). In all cell lines A3A expression was much lower than A3B at baseline (Fig. 4). However, viral infection in breast cancer cells strongly induced A3A, up and above A3B expression levels. A3G was induced in some cell lines by both treatments (Fig. 4, Supplementary Fig. 5, 6), but A3G is a cytoplasmic enzyme that does not edit TC motifs3 and thus is not expected to generate APOBEC-signature mutations.
APOBEC mutagenesis is the best predictor of survival
Multivariate analysis showed that survival of TCGA bladder cancer patients was most significantly predicted by tumor stage and APOBEC mutagenesis, while treatment (Yes/No) was not a significant predictor (Supplementary Table 11). Survival was improved by more than 2-fold (P = 2.41E-04) in patients with mutation counts above vs. below median levels (73 for APOBEC-signature mutations and 49 for mutagenesis pattern mutations, Fig. 5A, B). Significant correlation of survival with APOBEC mutagenesis is also presented in Firehose (Materials and Methods). The effect of the SNP was in the same direction, with individuals homozygous for the bladder cancer risk allele having longer survival (p=0.067, Fig. 5, Supplementary Table 11). Association of rs17000526 with survival was fully explained by APOBEC mutagenesis, although adjustment for rs17000526 had only moderate effect (Supplementary Table 11), suggesting that many factors, including rs17000526 contribute to APOBEC mutagenesis.
Figure 5. Overall survival of TCGA bladder cancer patients is improved with increased APOBEC mutagenesis and in carriers of bladder cancer risk genotype rs17000526-AA.
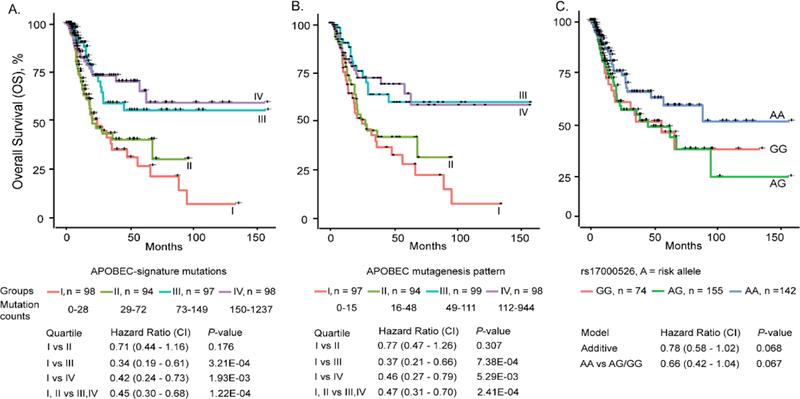
(A and B). APOBEC-signature mutations and APOBEC mutagenesis pattern were divided into quartiles (I - lowest and IV - highest mutation loads) and plotted against months of overall survival (OS). Multivariate Cox regression models were used to calculate hazards ratios (HR) with 95% confidence intervals (CI) and p-values for quartiles II, III, or IV vs. I (reference) as well as III and IV vs I and II. (C). Hazards ratios for SNP rs17000526 were calculated by comparing the AA or AG vs. GG genotype (reference) or AA vs. AG and GG genotypes (reference). Multivariate models included age, gender, and tumor stage. Data used for this analysis is presented in Supplementary Data Set 1.
We also evaluated effects of all APOBEC3 isoforms on survival. The effect of A3B expression was comparable to that of rs17000526 and similar in treated and untreated patients (beta-coefficients = −0.26 and −0.27), while the effect of A3A expression was much stronger in treated compared to untreated patients (beta-coefficients = −0.41 vs. 0.05, Supplementary Table 11). This suggests that mutagenesis caused by A3B may represent genetically-regulated mechanism contributing to cancer initiation, while mutagenesis caused by A3A may represent events occurring in tumors and influenced by tumor-specific environment, including treatment. Some isoforms of A3D and A3H significantly predicted survival but only in treated patients, in line with a recent analysis of survival in 73 bladder cancer patients treated with adjuvant platinum-based therapy37. It is unclear whether these effects are related to APOBEC mutagenesis or inflammatory microenvironment and infiltration with PD-L1 expressing mononuclear cells observed in these tumors37.
For breast cancer there was a similar but non-significant trend for better survival in patients with ER+ tumors and high APOBEC-signature mutation counts; there was also association between survival and rs17000526, but only in ER- breast tumors (Supplementary Fig. 7). Of A3A and A3B transcripts only expression of A3AB was significantly associated with survival, with ER+ carriers of this germline deletion having significantly worse survival (beta-coefficient = 0.64, p = 0.006, Supplementary Fig. 7).
Increased A3B expression has been observed in breast tumors with somatic mutations in the tumor suppressor TP53 gene and this was explained by improved survival of cells with high APOBEC-signature mutation loads when TP53 is inactivated4. TP53 is the most commonly mutated gene in bladder tumors and we observed that TP53 mutations were significantly enriched in the rs17000526-AA genotype group (Supplementary Table 12). The same trend was observed for mutations in PIK3CA, the 5th most commonly mutated gene in bladder tumors (Supplementary Table 13), and TP53 mutations in ER- breast tumors (Supplementary Table 14). However, adjustment for presence of TP53 mutations did not significantly affect the association between rs17000526, APOBEC-signature mutations, and survival of bladder and breast cancer patients (Supplementary Table 12 and 14).
DISCUSSION
Although somatic mutations emerge on the background of germline variants, some of which are associated with increased predisposition to cancer, the relationships between germline and somatic mutations are largely unknown. Mutation profiles within genomic regions harboring GWAS signals have been explored for a range of cancers, but genes with common germline risk variants are not enriched for somatic mutations38, unlike the highly penetrant familial cancer genes39. However, our study shows that common germline variants within the APOBEC3 region that affect expression of APOBEC3s, the mutation-causing enzymes, are associated both with cancer predisposition and global somatic mutation profiles.
Bladder cancer risk is increased in carriers of SNP rs1014971-T allele and we suggest this could be because of its association with increased expression of A3B and generation of APOBEC-signature mutations in bladder tissue. Although the functional effect of the A3AB deletion that eliminates A3B and creates the A3A-encoding A3AB transcript could be substantial, its genetic association with bladder cancer risk was subsumed by SNP rs1014971. In contrast, breast cancer risk is only moderately associated with SNP rs1014971 but strongly with the A3AB deletion, and the enrichment with APOBEC-signature mutations is strongly associated with expression of A3A and A3AB, but not A3B.
We also show that expression of A3A and A3B is inducible by environmental exposures. Treatment with a DNA-damaging drug, bleomycin, induced A3B in all cell lines tested, with the effect being most robust in bladder cancer cell lines. DNA damage as a result of exposure to environmental carcinogens is specifically important for bladder cancer because of direct contact of bladder epithelium with bioactive metabolites that accumulate in urine. Exposures to occupational and environmental carcinogens strongly increase the risk for bladder cancer, and germline susceptibility variants may modify this risk40. SNP rs1014971 has already been shown to significantly modify bladder cancer risk caused by tobacco smoking, the most known environmental risk factor41, and our results suggest this could be through regulation of A3B expression by this SNP contributing to APOBEC-signature mutagenesis.
In contrast, A3A expression was uniformly induced by viral infection, with 30–12,000-fold induction in breast cancer cell lines, and 4–167 fold in bladder cancer cell lines. This range of induction suggest additional cell-type specific factors that may affect sensitivity to different environmental exposures. A3AB deletion has been associated with interferon-induced inflammatory gene expression profile in breast tumors42, supporting our conclusions that A3A (and A3AB) is part of this profile. Although in our experiments this expression was induced by an RNA virus, in vivo it might be induced by diverse stimuli that result in activation of interferon response.
APOBEC3 activity has been also associated with hypermutation of some carcinogenic DNA viruses, such as human papillomavirus (HPV)30,31,43 and hepatitis B virus (HBV)30,44. APOBEC mutagenesis contributes to noncytolytic clearance of these viruses but can also result in increased viral diversity and APOBEC-signature mutagenesis in surrounding tissues, contributing to tumorigenesis. Response to DNA viruses might depend on tissue-specific repertoire of APOBECs and cellular mechanisms induced by particular infections, such as interferon-stimulated antiviral response, virally-induced DNA damage or some other specific mechanisms that need to be explored for each tissue and viral infection individually.
We found that in bladder tumors SNP rs17000526, A3B and A3A expression, while in breast tumors A3AB deletion and A3A expression are significant independent predictors of APOBEC mutagenesis. We speculate that mRNA expression may capture both the germline-regulated and environmentally-inducible components that contribute (or have contributed in the past) to accumulation of APOBEC-signature mutations through the tumor history. At the same time, the SNP may represent germline-regulated expression levels that would be relevant at the time of mutagenesis but might not be detectable by the snapshot expression analysis in excised tumors. Some other factors that might be relevant for APOBEC mutagenesis, such as environmental exposures, are impossible to quantify (both the magnitude and timing) and other factors are unknown. Based on currently available data we suggest that a combination of germline variants rs17000526 and A3AB deletion and mRNA expression of A3B and A3A in tumors may provide better prediction of APOBEC mutagenesis than each of these variables alone.
Although expression of APOBEC3s (A3A, A3B and A3AB, specifically) is a likely prerequisite for APOBEC-signature mutagenesis, some factors may modify the outcome of this expression. For example, loss of FHIT protein was shown to create DNA breaks that provide substrate for APOBEC mutagenesis; TCGA lung adenocarcinoma tumors with high A3B expression and FHIT loss had higher APOBEC mutagenesis compared to tumors with high A3B expression but without FHIT loss45.
Interestingly, TCGA bladder cancer patients with increased APOBEC mutagenesis (more than 73 APOBEC-signature mutations or more than 49 APOBEC-mutagenesis pattern mutations) had significantly improved survival. The SNP rs17000526 showed a similar although less significant trend with each risk allele. Considering that all bladder tumors in TCGA are of the most aggressive, muscle-invasive type, this might be a clinically significant finding that requires careful follow-up. Increased mutation loads, especially in DNA repair genes, were associated with response to neoadjuvant cisplatin-based treatment of muscle-invasive bladder cancer; this was attributed to inability of cancer cells to recover after treatment-induced DNA damage46. We observed higher TP53 and PIK3CA mutation rates in bladder tumors from patients homozygous for the rs17000526-A allele. Tumors with higher mutation burden are also more likely to be targeted by immune surveillance47 and respond to PD-1 checkpoint inhibitors48. SNP (rs1014971 or its proxy rs17000526) by itself might not be informative enough for clinical use but it should be combined with other clinical, genetic and molecular markers and tested for clinical utility for management of bladder cancer. The current analysis in TCGA samples is based on whole-exome sequencing and it remains to be seen if targeted exome sequencing that is becoming common in the clinic, can provide sufficient and clinically relevant information about APOBEC mutagenesis.
In conclusion, our work shows how functional germline variants and environmental exposures may affect somatic mutations and clinical outcomes. We propose (Figure 6) that even transient exposures to relevant environmental factors might induce A3A or A3B expression above the genotoxic levels and initiate tumorigenesis in tissue-specific manner in the right cellular environment where ssDNA is available; germline APOBEC3 variants might affect both the baseline and threshold levels of A3A and A3B expression. Genomic instability and DNA breaks acquired during tumor development could provide source of ssDNA independent of external environmental exposures, further stimulate APOBEC3 expression and fuel APOBEC-mediated mutagenesis and tumor evolution. On the other hand, more efficient immune surveillance due to neoantigens and synthetic lethality of tumor cells can contribute to improved survival for patients with higher APOBEC mutagenesis. Since APOBEC-signature mutagenesis has been reported in 16 of 30 tumor types analyzed by TCGA2, further work is needed to explore the relationships between germline variants and environmental factors that can affect the activity of APOBEC enzymes, patterns of somatic mutations, cancer risk, and outcomes across cancer types.
Figure 6. APOBEC mutagenesis in cancer.
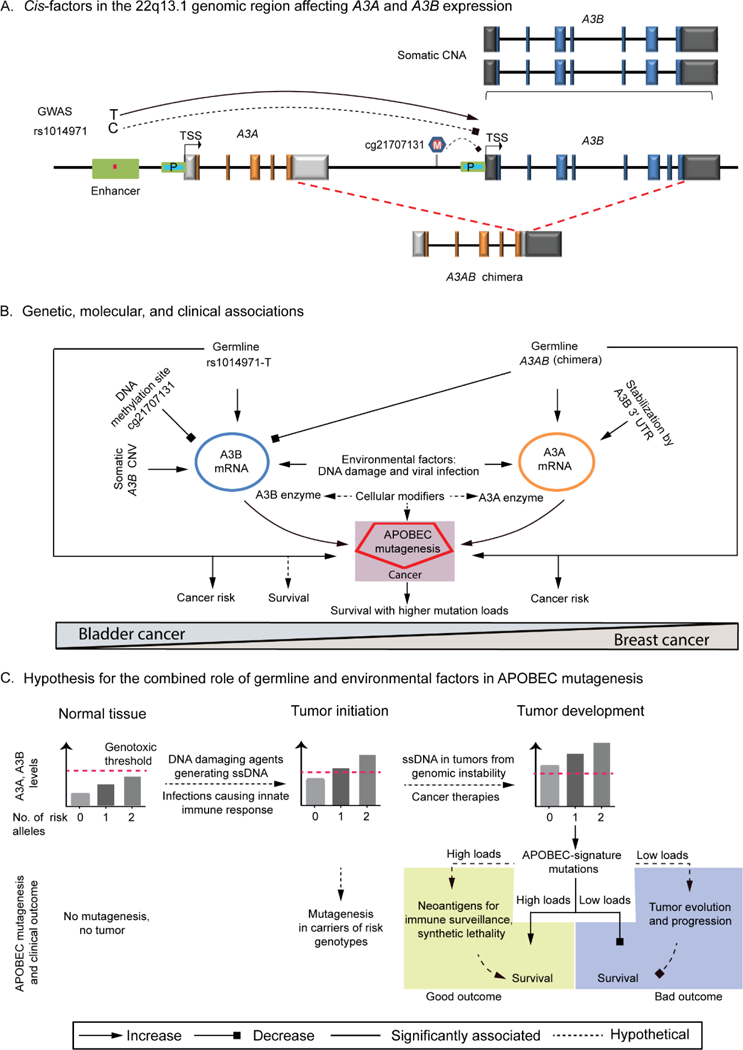
(A). Cis-factors in the 22q13.1 region affecting A3A and A3B expression. Expression can be modified by germline variants SNP rs1014971 located within A3B enhancer and a 30 Kb deletion A3AB, DNA methylation (marked as M) at a CpG site cg21707131 within the A3B promoter, and somatic CNA. (B). Genetic, molecular and clinical associations. Expression of A3A, A3AB and A3B transcripts generating A3A and A3B enzymes can be induced by environmental factors such as DNA-damaging agents, and viral infections that activate interferon-stimulated innate immune response. SNP rs1014971 shows important associations predominantly for bladder cancer - with increased cancer risk, A3B expression, APOBEC mutagenesis and survival, while A3AB deletion shows associations with breast cancer. (C). Hypothesis for the combined role of germline and environmental factors in APOBEC mutagenesis. In normal tissues A3A/A3B levels increase with the number of risk alleles of germline variants (SNP rs1014971 or A3AB deletion) but are still below the genotoxic threshold. Exposures to DNA-damaging agents or viral infections can induce A3A/A3B levels above the genotoxic threshold, especially in individuals with germline risk variants. Mutagenesis and tumor initiation can occur if ssDNA is available endogenously (DNA replication and repair) or generated by DNA-damaging exposures. In the tumor microenvironment ssDNA can be available from DNA damage due to genomic instability and cancer therapies; continuous DNA damage maintains high A3B/A3A levels above genotoxic levels. Depending on cancer and treatment type, high APOBEC mutagenesis may be associated with improved or decreased survival.
ONLINE MATERIALS AND METHODS
Samples
Genotypes for 5,832 bladder cancer cases and 10,721 controls of European ancestry were generated by NCI-GWAS110 and NCI-GWAS218. Additional genotyping was performed for A3AB deletion in a subset of 4,285 NCI-GWAS1 samples – 1,996 samples from the Spanish Bladder Cancer Study (SBCS) and 2,289 samples from the Prostate, Lung, Colorectal, and Ovarian (PLCO) Cancer Screening Trial, USA. Additionally, 2,061 samples from controls participating in the Biobank Japan project and bladder cancer patients recruited from 11 hospitals in Japan11 were genotyped for deletion and SNP rs1014971. Samples from HapMap and the 1000 Genomes Project were genotyped for deletion and SNP rs12628403. Bladder cancer NCI-GWAS is covered by the NIH Office of Human Subjects Research Protections (OHSRP) exemption (#13076). Each participating study/institution obtained informed consent from study participants and their corresponding IRBs. Specifically, active National Cancer Institute Special Studies Institutional Review Board (NCI-SSIRB) approvals cover SPBC (#OH99CN038) and PLCO (#OH97CN041). Analysis in samples from Japan was approved by IRB of the Institute of Medical Science, the University of Tokyo (#23–43-0130).
Cell lines
Bladder cancer cell lines (muscle-invasive HT-1376 and HTB-9 and non-muscle-invasive RT-4) and breast cancer cell lines (MCF-7 (ER+/PR+/HER2-/TP53WT), MDA-MB-231 (ER-/PR-/HER2-/TP53mut) and T-47D (ER+/PR+/HER2-/TP53mut)) were purchased from the American Type Culture Collection (Manassas, VA). Cell lines were either purchased from ATCC specifically for this project within last 4 months or authenticated by genotyping of a panel of microsatellite markers through DDC Medical service in 2016. All cell lines in the lab are regularly tested for Mycoplasma contamination using MycoAlert Mycoplasma Detection Kit (Lonza).
Genotyping
A3AB deletion was genotyped with a multiplexed CNV assay that included individual assays for A3B and RNAseP (Hs04504055 with FAM-fluorophore and 4403328 with VIC-fluorophore, respectively, both from Life Technologies), 2x TaqMan Expression Master Mix (Life Technologies) and 5 ng of genomic DNA. The 5-ul reactions were run in technical quadruplicates, in 384-well plates using QuantStudio 7 under standard conditions. The A3AB genotypes were scored as insertion (I/I), heterozygotes (I/D), or deletion (D/D). The assay was first tested on DNA of HapMap samples (CEU, YRI, CHB/JPT) and genotypes were found to be 97.03 % concordant with those reported based on long-range PCR and gel electrophoresis12 (8 of 270 samples were discordant, Supplementary Table 2). Selected HapMap samples representing all genotype groups were included as positive controls and water as a negative control on each PCR plate. A3B copy number status was calculated using Ct values (PCR cycle at threshold) after normalization by Ct values of RNAseP gene which has 2 copies in the human genome. dCt values were calculated as Ct (RNAseP)-Ct (A3B). Scoring was done manually after reviewing dCt plots and blinded to sample information; 403 samples were genotyped for CNV in duplicates with 99.7% concordance. Distributions of deletion genotypes in controls from Europe and Japan did not deviate from Hardy-Weinberg equilibrium (HWE) and were comparable to those expected based on data in corresponding HapMap populations (Supplementary Tables 15 and 16). Deletion was also genotyped through a proxy SNP rs12628403, using a custom-designed TaqMan genotyping assay (Supplementary Note).
Fine-mapping analyses
Additional genotypes in the 22q13.1 region were inferred with IMPUTE2 software using data from the bladder cancer NCI-GWAS1 and NCI-GWAS2 datasets10,18 and the 1000 Genomes Project phase 3 reference set (October 2014 release), which contains data for 2,504 individuals from 21 populations. Imputation was performed within a 1 Mb window centered on bladder cancer GWAS SNP rs1014971. Imputation quality was assessed based on overall concordance, which indicates how well the known SNPs were imputed across samples (a threshold of 0.95 was used), the average posterior probability and the IMPUTE2-info score of individual SNPs, which indicate how well individual SNPs were imputed across a data set (a threshold of 0.9 was used). Imputation quality for SNP rs17000526 was confirmed by TaqMan genotyping of 681 samples with 99.6% concordance with imputation results. Hardy-Weinberg equilibrium and minor allele frequencies were calculated with PLINK version 1.07 (August 10, 2009) and linkage disequilibrium values (D’ and r2) were calculated with PLINK version 1.90 beta (June 10, 2014). GTOOL was used for all file conversions between pedigree and genotype file formats.
Association testing was performed in the combined NCI-GWAS1 and NCI-GWAS2 dataset that included genotyped and imputed markers using PLINK version 1.07 with logistic regression models and adjusting for relevant variables: age, gender, eigenvectors 1, 5, and 6, study sites, and smoking history (ever/never smoker), as previously described10,18. To test for any additional SNPs independently associated with bladder cancer risk, models were also adjusted for bladder cancer GWAS SNP rs1014971. Association analysis for the deletion was performed in R version 3.2.1 using logistic regression models. Because of the low frequency of the deletion in individuals of European ancestry (~6%), analysis was done using a dominant genetic model (absence or presence of deletion). Models were adjusted for relevant variables as indicated. Random effects meta-analysis of Odds Ratios (ORs) between the European and the Japanese datasets was performed in STATA 13.0. All Odds Ratios are reported with 95% confidence intervals. Recombination plots were generated using R shiny app at National Cancer Institute, National Institutes of Health (see URL provided). Recombination hot spots are informative because they disrupt linkage disequilibrium blocks. It is expected that genetic markers that represent the same association signal should be scattered within a region uninterrupted by recombination hotspots.
The Cancer Genome Atlas (TCGA) data
Open access data for previously described TCGA data sets20,21 and preliminary data for additional samples were downloaded on February 2, 2015 from TCGA Data portal (see URL provided). Downloaded sets included demographic (age, sex, race) and clinical variables (tumor stage, treatment, survival, etc), mRNA expression (Illumina HiSeq RNASeqV2) and DNA methylation of CpG sites (Human Methylation 450). Data for somatic CNVs for TCGA samples were downloaded from cBioPortal49 (see URL provided), selecting Bladder Urothelial Carcinoma set (TCGA, provisional for 413 samples) or Breast Invasive Carcinoma set (TCGA, provisional for 1105 samples) through Query mode. CNVs were downloaded by selecting Putative copy-number alterations (CNAs) from GISTIC53 in Select Genomic Profiles section. Germline genotypes are classified as controlled access data and they were acquired from TCGA upon approval by the data access committees of dbGAP and TCGA. Genotypes of germline variants were generated by TCGA with Affymetrix SNP 6 arrays for blood-derived DNA of patients. TCGA samples are described in Supplementary Table 17 and full dataset is provided as Supplementary Data Set 1.
Expression analysis in TCGA
Analysis was performed with R package version 3.2.1 using multivariate linear regression models to calculate beta-coefficients, which represent the increase in the value of the dependent variable for every unit increase in the predictor variable, adjusting for effects of other variables. The RNA-seq mRNA expression levels for TCGA samples are presented as RNA-seq by expectation maximum (RSEM) values. These values were log10-transformed (this is an optional step) and quantile-normalized50, 51 according to a standard procedure of handling mRNA expression data; the resulting values were normally distributed based on a Shapiro-Wilks test. We analyzed expression of all individual transcripts for all genes in the region of interest because gene-level expression analysis may miss specific effects of isoforms.
Specifically, analysis at the isoform level allowed us to assess the effects of the A3A deletion isoform (A3AB). We used linear regression for expression of A3A, A3B and A3AB with deletion genotypes (0, 1, or 2 deletion alleles), which were scored in a subset of TCGA samples in a previous report17 and observed strong correlations (Supplementary Table 18) confirming that expression of A3AB isoform could be used as a proxy for germline A3AB deletion. We also confirmed that the distribution of the A3AB deletion genotypes in subsets of bladder and breast tumors in TCGA was similar to that of HapMap samples (Supplementary Table 19).
For the isoform-specific expression exploratory analysis, we first performed a regression analysis evaluating effects of rs17000526 genotype (coded as 0, 1, and 2 risk alleles), age, gender (excluded from the breast cancer analysis as 99% of the participants were female), and race (Caucasian, African American, or Asian) on expression levels (Supplementary Tables 4 and S5). For more detailed analyses of those isoforms that were significantly correlated with rs17000526 genotypes in the initial analysis, we incorporated additional information that can be relevant for mRNA expression.
Somatic changes in tumor tissue might have resulted in aberrant DNA methylation or CNA52, thus we additionally adjusted for the effects of these factors on expression levels. DNA methylation levels for CpG sites upstream of A3B were log10-transformed (this is an optional step), quantile-normalized50, 51 and tested for correlation with A3B expression. The CpG site with the strongest effect on expression, as measured by the beta-coefficients and p-values, was used for adjustment in subsequent analyses (Supplementary Table 6).
Analysis of APOBEC mutagenesis
APOBEC-signature mutation data for TCGA samples were acquired from the Broad Institute Genome Data Analysis Center (GDAC)53 Firehose portal (April 15, 2015, stamp analyses_2015_04_02) through Firebrowse (see URL provided) using “firehose_get” option. Specific updated details of datasets, analyses and data sources (doi:10.7908/C1NP23KG and doi:10.7908/C1ZS2VN9) are available at Firebrowse. For the APOBEC signature mutation analyses we used a file *_sorted_sum_all_fisher_Pcorr.txt” (provided in Supplementary Date Set 1). In this file we used two variables: the “tCw_to_G+tCw_to_T” variable, which represents total counts of APOBEC-signature mutations and the “APOBEC_MutLoad_MinEstimate“variable, which accounts for statistical significance of enrichment and represents APOBEC-mutagenesis pattern per sample. This variable is more stringent as many samples were not enriched at a statistically significant level and were classified as negative for APOBEC-signature mutations. Mutation counts were log10-transformed to improve normality of distribution. A p-value of 0.05 was used as a threshold for significance, unless specified otherwise and all tests were two-sided. The Bonferroni multiple comparisons significance level is reported where appropriate. We also downloaded from Firehose and analyzed an updated dataset for APOBEC mutagenesis (stamp analyses__2016_01_28); the results were very similar (data not shown) compared to those generated for the April 2015 dataset and reported here.
Mutation analysis of selected genes in TCGA
Data for functionally relevant somatic mutations54 in some frequently mutated genes and generated using MutSig2CV was downloaded from the Broad Institute Firebrowse. The mutation data for each gene was obtained from “Aggregate Analysis Features” tab from file “_-TP.samplefeatures.txt” using column “SMG_mutsig.2CV_gene” (provided in Supplementary Data Set 1). We evaluated distribution of mutations in bladder tumors in a panel of genes - TP53, RB1, ELF3, TSC1, PIK3CA, RHOB, CDKN2A, ARID1A, ZFP36L1, CDKN1A, ATM and FGFR3 and for TP53 in breast tumors in relation to rs17000526 genotype groups. Statistical significance was evaluated based on 2x3 Chi-Square test, without adjustment for any other variables.
Survival analysis
Survival analysis was performed using TCGA data. Overall survival (OS) was defined as either months until patient death or last follow-up. The p-values and hazards ratios (HR) were derived from a multivariate Cox regression models that included age, gender (excluded in breast cancer analysis), tumor stage as core variables and additional variables such as SNP rs17000526, APOBEC mutagenesis or mRNA expression of APOBEC3s. For APOBEC mutagenesis survival analysis was performed using mutation counts as continuous variable or in groups - quartiles or custom-defined. Treatment information (YES/NO any neoadjuvant or adjuvant treatment) was used in additional analyses. Univariate survival analysis in relation to APOBEC mutagenesis is also presented in Firehose doi:10.7908/C1G44PGV and later version doi:10.7908/C15T3JTD (see URLs provided).
In silico functional annotation
Annotation was performed using resources of ENCODE (available from UCSC genome Browser) and HaploReg.v4. Analysis included data for chromatin immunoprecipitation and sequencing (ChIP-seq) for different histone marks, CTCF motifs, DNase hypersensitivity sites (DHS), formaldehyde-assisted isolation of regulatory elements (FAIRE-seq), and transcription factor binding sites (Txn Factor) from different cell lines. HaploReg analysis was performed using default settings for a European population and included annotation for enhancers, H3K4Me1 and H3K27Ac histone modification marks.
Electrophoretic mobility shift assays (EMSA)
Oligos (primers) for the three SNPs were designed based on reference genomic sequences from dbSNP (see URL provided) and purchased from Life Technologies (Supplementary Table 20). Primers were biotin-labelled using a 3’-end labelling kit (Pierce) and corresponding labelled forward and reverse primers were annealed to generate double-stranded allele-specific probes. Efficiency of biotin labelling was confirmed to be similar for each probe pair based on dot blot tests with serial dilutions. EMSA reactions were performed with a LightShift Chemiluminescent EMSA Kit (Thermo Scientific). Nuclear extracts were prepared from three bladder cancer cell lines (HT-1376, RT-4 and HTB-9) using a nuclear extraction kit (Active Motif) and commercial nuclear cell extracts were purchased from Active Motif for breast cancer cell lines (MCF-7, MDA-MB-231 and T-47D). Similar amounts of all nuclear extracts (10 μg) were used for reactions. For competition assays, unlabeled specific (self) and non-specific (opposite allele) probes were used at a 100-fold excess. Glycerol, NP-40, and MgCl2 were used to optimize the reactions. The reactions were incubated for 30 minutes at room temperature and protein complexes were immediately resolved on 6% DNA retardation gels (Invitrogen) for 1.5 h at 100 V and transferred to Biodyne B Nylon Membranes (Pierce) for 40 min at 380 mA. Crosslinking was performed using Stratagene Stratalinker UV Crosslinker 2400 and membranes were probed using Chemiluminescent Nucleic Acid Detection Module (Pierce).
Treatment with DNA-damaging drug and viral infection
Bleomycin (sulfate) was purchased from Cayman Chemicals (Ann Arbor, Michigan). Bladder and breast cancer cells grown in 6-well plates were treated in triplicates or quadruplicates with bleomycin (25 ug/ml) for 5 or 24 hours. Stocks of Sendai virus (SeV) strain Cantell were purchased from Charles River Laboratories (Wilmington, MA). SeV is a single-strand RNA murine parainfluenza virus which infects human cells and induces a robust antiviral interferon response that quickly controls infection32. Bladder and breast cancer cells were infected in triplicates or quadruplicates with SeV (7.5x10⁵ CEID50/ml Chicken Embryo Infectious Dose 50%) for 1 hour, washed with PBS and then collected at 0, 3, 6, and 12 hours post-infection.
qRT-PCR analysis
Total RNA for all experiments was isolated with an RNeasy kit with on-column DNase I treatment (Qiagen). RNA quantity and quality were evaluated by NanoDrop 8000 (Thermo Scientific). cDNA was prepared from equal amounts of total RNA per sample (10 ng per 5 ul reaction) with the RT2 first-strand cDNA kit and random hexamers with an additional DNA-removal step (Qiagen). SeV loads were evaluated by qRT-PCR with virus-specific primers for SeV defective-interfering (SeV-DI) RNA (Supplementary Table 20). Expression of A3A, A3B, and A3G and endogenous controls GAPDH, ATCB, and PPIA was measured in the same cDNA with TaqMan expression assays – Hs00377444_m1 for A3A, Hs02564469_s1 for A3B, Hs01043989_m1 for A3G, and 4326317E for GAPDH, 4352935 for ATCB and 4326316E for PPIA (Life Technologies). Reactions were performed in four technical replicates on QuantStudio 7 (Life Technologies) using SYBR Green Rox qPCR Mastermix (Qiagen) or TaqMan Gene Expression buffer (Life Technologies); water and genomic DNA were used as negative controls for all assays. For antiviral pathway expression analysis, qRT-PCR mRNA expression analysis was performed using SYBR Green Antiviral Response qRT-PCR array (Qiagen). The plates included 88 expression assays for target genes, as well as positive, negative, and endogenous normalization controls (Supplementary Table 10). Reactions included 10 ng of total DNAse-treated RNA in 10 ul volume and were done for two biological replicates from each experimental condition. Expression was measured in Ct values (PCR cycle at detection threshold), which are distributed on log2 scale. Expression of APOBEC3s was normalized by the mean of endogenous controls (GAPDH, ACTB, and PPIA). Differences in expression were calculated according to the relative quantification method, as dCt = Ct (control)−Ct (target).
Supplementary Material
ACKNOWLEDGEMENTS
We thank the Breast Cancer Association Consortium (BCAC) for access to summary results for the association between rs1014971 and breast cancer risk. The results presented here are in part based upon data generated by the TCGA Research Network.
FUNDING
The study was supported by federal funds from the Intramural Research Program (IRP), Division of Cancer Epidemiology and Genetics, National Cancer Institute, NIH (contract no. HHSN261200800001E). Prostate, Lung, Colorectal, and Ovarian (PLCO) Cancer Screening Trial was funded with the NIH Genes, Environment and Health Initiative (GEI) grants HG-06–033-NCI-01 and RO1HL091172–01, U01HG004438, and NIH HHSN268200782096C. Spanish Bladder Cancer Study (SBCS) was funded with intramural contract NCI N02-CP-11015. FIS/Spain 98/1274, FIS/Spain 00/0745, PI061614, and G03/174, Fundació Marató TV3, Red Temática Investigación Cooperativa en Cáncer (RTICC), Consolíder ONCOBIO, EU-FP7–201663; and RO1-CA089715 and CA34627. The BioBank Japan Project was supported by the Ministry of Education, Culture, Sports, Science and Technology of the Japanese government. The funders did not play a role in the study design, data collection analysis, writing, or submission of the manuscript.
Footnotes
URLs:
TCGA Data portal: https://tcga-data.nci.nih.gov/tcga/dataAccessMatrix.htm
dbGAP and TCGA classified access: (https://tcga-data.nci.nih.gov/tcga/tcgaAccessTiers.jsp).
cBioPortal: http://www.cbioportal.org/index.do
Firebrowse: https://gdac.broadinstitute.org/; http://firebrowse.org/#
Firebrowse APOBEC analysis in bladder tumors: http://gdac.broadinstitute.org/runs/analyses__latest/reports/cancer/BLCA/Mutation_APOBEC/nozzle.html;
Firebrowse APOBEC analysis in breast tumors: http://gdac.broadinstitute.org/runs/analyses__latest/reports/cancer/BRCA-TP/Mutation_APOBEC/nozzle.html.
Firehose survival analysis in relation to APOBEC mutagenesis in bladder tumors: http://gdac.broadinstitute.org/runs/analyses__2016_01_28/reports/cancer/BLCA-TP/Correlate_Clinical_vs_Mutation_APOBEC_Continuous/V1–2.ex.pdf
HaploReg.v4: http://www.broadinstitute.org/mammals/haploreg/haploreg.php
ENCODE: https://genome.ucsc.edu/ENCODE/)
Recombination hot spot analysis: http://ccad.nci.nih.gov:3838/users/zhangt8/1kginfo/
ACCESSION CODES
dbGaP Study Accession for Bladder Cancer GWAS data: phs000346.v2. p2
Note: Supplementary Information and Source Data files are available in the online version of the paper.
METHODS
Methods and any associated references are available in the online version of the paper.
Conflict of Interest statement. None declared.
REFERENCES
- 1.Alexandrov LB, Nik-Zainal S, Wedge DC, Campbell PJ & Stratton MR Deciphering signatures of mutational processes operative in human cancer. Cell Rep 3, 246–59 (2013). [DOI] [PMC free article] [PubMed] [Google Scholar]
- 2.Alexandrov LB et al. Signatures of mutational processes in human cancer. Nature 500, 415–21 (2013). [DOI] [PMC free article] [PubMed] [Google Scholar]
- 3.Roberts SA et al. An APOBEC cytidine deaminase mutagenesis pattern is widespread in human cancers. Nat Genet 45, 970–6 (2013). [DOI] [PMC free article] [PubMed] [Google Scholar]
- 4.Burns MB et al. APOBEC3B is an enzymatic source of mutation in breast cancer. Nature 494, 366–70 (2013). [DOI] [PMC free article] [PubMed] [Google Scholar]
- 5.Nik-Zainal S et al. Mutational processes molding the genomes of 21 breast cancers. Cell 149, 979–93 (2012). [DOI] [PMC free article] [PubMed] [Google Scholar]
- 6.Saraconi G, Severi F, Sala C, Mattiuz G & Conticello SG The RNA editing enzyme APOBEC1 induces somatic mutations and a compatible mutational signature is present in esophageal adenocarcinomas. Genome Biol 15, 417 (2014). [DOI] [PMC free article] [PubMed] [Google Scholar]
- 7.Swanton C, McGranahan N, Starrett GJ & Harris RS APOBEC Enzymes: Mutagenic Fuel for Cancer Evolution and Heterogeneity. Cancer Discov 5, 704–12 (2015). [DOI] [PMC free article] [PubMed] [Google Scholar]
- 8.Chan K et al. An APOBEC3A hypermutation signature is distinguishable from the signature of background mutagenesis by APOBEC3B in human cancers. Nat Genet 47, 1067–72 (2015). [DOI] [PMC free article] [PubMed] [Google Scholar]
- 9.Burns MB, Temiz NA & Harris RS Evidence for APOBEC3B mutagenesis in multiple human cancers. Nat Genet 45, 977–83 (2013). [DOI] [PMC free article] [PubMed] [Google Scholar]
- 10.Rothman N et al. A multi-stage genome-wide association study of bladder cancer identifies multiple susceptibility loci. Nat Genet 42, 978–84 (2010). [DOI] [PMC free article] [PubMed] [Google Scholar]
- 11.Matsuda K et al. Genome-wide association study identified SNP on 15q24 associated with bladder cancer risk in Japanese population. Hum Mol Genet 24, 1177–84 (2015). [DOI] [PMC free article] [PubMed] [Google Scholar]
- 12.Kidd JM, Newman TL, Tuzun E, Kaul R & Eichler EE Population stratification of a common APOBEC gene deletion polymorphism. PLoS Genet 3, e63 (2007). [DOI] [PMC free article] [PubMed] [Google Scholar]
- 13.Caval V, Suspene R, Shapira M, Vartanian JP & Wain-Hobson S A prevalent cancer susceptibility APOBEC3A hybrid allele bearing APOBEC3B 3’UTR enhances chromosomal DNA damage. Nat Commun 5, 5129 (2014). [DOI] [PubMed] [Google Scholar]
- 14.Qi G, Xiong H & Zhou C APOBEC3 deletion polymorphism is associated with epithelial ovarian cancer risk among Chinese women. Tumour Biol 35, 5723–6 (2014). [DOI] [PubMed] [Google Scholar]
- 15.Xuan D et al. APOBEC3 deletion polymorphism is associated with breast cancer risk among women of European ancestry. Carcinogenesis 34, 2240–3 (2013). [DOI] [PMC free article] [PubMed] [Google Scholar]
- 16.Long J et al. A common deletion in the APOBEC3 genes and breast cancer risk. J Natl Cancer Inst 105, 573–9 (2013). [DOI] [PMC free article] [PubMed] [Google Scholar]
- 17.Nik-Zainal S et al. Association of a germline copy number polymorphism of APOBEC3A and APOBEC3B with burden of putative APOBEC-dependent mutations in breast cancer. Nat Genet 46, 487–91 (2014). [DOI] [PMC free article] [PubMed] [Google Scholar]
- 18.Figueroa JD et al. Genome-wide association study identifies multiple loci associated with bladder cancer risk. Hum Mol Genet 23, 1387–98 (2014). [DOI] [PMC free article] [PubMed] [Google Scholar]
- 19.Michailidou K et al. Large-scale genotyping identifies 41 new loci associated with breast cancer risk. Nat Genet 45, 353–61, 361e1–2 (2013). [DOI] [PMC free article] [PubMed] [Google Scholar]
- 20.Cancer Genome Atlas Research, N. Comprehensive molecular characterization of urothelial bladder carcinoma. Nature 507, 315–22 (2014). [DOI] [PMC free article] [PubMed] [Google Scholar]
- 21.Cancer Genome Atlas, N. Comprehensive molecular portraits of human breast tumours. Nature 490, 61–70 (2012). [DOI] [PMC free article] [PubMed] [Google Scholar]
- 22.Roberts SA & Gordenin DA Hypermutation in human cancer genomes: footprints and mechanisms. Nat Rev Cancer 14, 786–800 (2014). [DOI] [PMC free article] [PubMed] [Google Scholar]
- 23.Mifsud B et al. Mapping long-range promoter contacts in human cells with high-resolution capture Hi-C. Nat Genet 47, 598–606 (2015). [DOI] [PubMed] [Google Scholar]
- 24.Gohler S et al. Impact of functional germline variants and a deletion polymorphism in APOBEC3A and APOBEC3B on breast cancer risk and survival in a Swedish study population. J Cancer Res Clin Oncol 142, 273–6 (2016). [DOI] [PubMed] [Google Scholar]
- 25.Refsland EW et al. Quantitative profiling of the full APOBEC3 mRNA repertoire in lymphocytes and tissues: implications for HIV-1 restriction. Nucleic Acids Res 38, 4274–84 (2010). [DOI] [PMC free article] [PubMed] [Google Scholar]
- 26.Land AM et al. Endogenous APOBEC3A DNA cytosine deaminase is cytoplasmic and nongenotoxic. J Biol Chem 288, 17253–60 (2013). [DOI] [PMC free article] [PubMed] [Google Scholar]
- 27.Mussil B et al. Human APOBEC3A isoforms translocate to the nucleus and induce DNA double strand breaks leading to cell stress and death. PLoS One 8, e73641 (2013). [DOI] [PMC free article] [PubMed] [Google Scholar]
- 28.Akre MK et al. Mutation Processes in 293-Based Clones Overexpressing the DNA Cytosine Deaminase APOBEC3B. PLoS One 11, e0155391 (2016). [DOI] [PMC free article] [PubMed] [Google Scholar]
- 29.Sheehy AM, Gaddis NC, Choi JD & Malim MH Isolation of a human gene that inhibits HIV-1 infection and is suppressed by the viral Vif protein. Nature 418, 646–50 (2002). [DOI] [PubMed] [Google Scholar]
- 30.Bonvin M et al. Interferon-inducible expression of APOBEC3 editing enzymes in human hepatocytes and inhibition of hepatitis B virus replication. Hepatology 43, 1364–74 (2006). [DOI] [PubMed] [Google Scholar]
- 31.Wang Z et al. APOBEC3 deaminases induce hypermutation in human papillomavirus 16 DNA upon beta interferon stimulation. J Virol 88, 1308–17 (2014). [DOI] [PMC free article] [PubMed] [Google Scholar]
- 32.Strander H & Cantell K Production of interferon by human leukocytes in vitro. Ann Med Exp Biol Fenn 44, 265–73 (1966). [PubMed] [Google Scholar]
- 33.Sen GC Viruses and interferons. Annu Rev Microbiol 55, 255–81 (2001). [DOI] [PubMed] [Google Scholar]
- 34.Reid E & Charleston B Type I and III interferon production in response to RNA viruses. J Interferon Cytokine Res 34, 649–58 (2014). [DOI] [PubMed] [Google Scholar]
- 35.Nowarski R & Kotler M APOBEC3 cytidine deaminases in double-strand DNA break repair and cancer promotion. Cancer Res 73, 3494–8 (2013). [DOI] [PMC free article] [PubMed] [Google Scholar]
- 36.Dziegielewski J, Melendy T & Beerman TA Bleomycin-induced alterations in DNA replication: relationship to DNA damage. Biochemistry 40, 704–11 (2001). [DOI] [PubMed] [Google Scholar]
- 37.Mullane SA et al. Correlation of Apobec Mrna Expression with overall Survival and pd-l1 Expression in Urothelial Carcinoma. Sci Rep 6, 27702 (2016). [DOI] [PMC free article] [PubMed] [Google Scholar]
- 38.Machiela MJ, Ho BM, Fisher VA, Hua X & Chanock SJ Limited evidence that cancer susceptibility regions are preferential targets for somatic mutation. Genome Biol 16, 193 (2015). [DOI] [PMC free article] [PubMed] [Google Scholar]
- 39.Rahman N Realizing the promise of cancer predisposition genes. Nature 505, 302–8 (2014). [DOI] [PMC free article] [PubMed] [Google Scholar]
- 40.Burger M et al. Epidemiology and risk factors of urothelial bladder cancer. Eur Urol 63, 234–41 (2013). [DOI] [PubMed] [Google Scholar]
- 41.Garcia-Closas M et al. Common genetic polymorphisms modify the effect of smoking on absolute risk of bladder cancer. Cancer Res 73, 2211–20 (2013). [DOI] [PMC free article] [PubMed] [Google Scholar]
- 42.Cescon DW, Haibe-Kains B & Mak TW APOBEC3B expression in breast cancer reflects cellular proliferation, while a deletion polymorphism is associated with immune activation. Proc Natl Acad Sci U S A 112, 2841–6 (2015). [DOI] [PMC free article] [PubMed] [Google Scholar]
- 43.Vartanian JP, Guetard D, Henry M & Wain-Hobson S Evidence for editing of human papillomavirus DNA by APOBEC3 in benign and precancerous lesions. Science 320, 230–3 (2008). [DOI] [PubMed] [Google Scholar]
- 44.Suspene R et al. Extensive editing of both hepatitis B virus DNA strands by APOBEC3 cytidine deaminases in vitro and in vivo. Proc Natl Acad Sci U S A 102, 8321–6 (2005). [DOI] [PMC free article] [PubMed] [Google Scholar]
- 45.Waters CE, Saldivar JC, Amin ZA, Schrock MS & Huebner K FHIT loss-induced DNA damage creates optimal APOBEC substrates: Insights into APOBEC-mediated mutagenesis. Oncotarget 6, 3409–19 (2015). [DOI] [PMC free article] [PubMed] [Google Scholar]
- 46.Plimack ER et al. Defects in DNA Repair Genes Predict Response to Neoadjuvant Cisplatin-based Chemotherapy in Muscle-invasive Bladder Cancer. Eur Urol 68, 959–67 (2015). [DOI] [PMC free article] [PubMed] [Google Scholar]
- 47.Kim R, Emi M & Tanabe K Cancer immunoediting from immune surveillance to immune escape. Immunology 121, 1–14 (2007). [DOI] [PMC free article] [PubMed] [Google Scholar]
- 48.Rizvi NA et al. Cancer immunology. Mutational landscape determines sensitivity to PD-1 blockade in non-small cell lung cancer. Science 348, 124–8 (2015). [DOI] [PMC free article] [PubMed] [Google Scholar]
Supplementary references:
- 49.Cerami E et al. The cBio cancer genomics portal: an open platform for exploring multidimensional cancer genomics data. Cancer Discov 2, 401–4 (2012). [DOI] [PMC free article] [PubMed] [Google Scholar]
- 50.Bullard JH, Purdom E, Hansen KD & Dudoit S Evaluation of statistical methods for normalization and differential expression in mRNA-Seq experiments. BMC Bioinformatics 11, 94 (2010). [DOI] [PMC free article] [PubMed] [Google Scholar]
- 51.Shabalin AA Matrix eQTL: ultra fast eQTL analysis via large matrix operations. Bioinformatics 28, 1353–8 (2012). [DOI] [PMC free article] [PubMed] [Google Scholar]
- 52.Li Q et al. Integrative eQTL-based analyses reveal the biology of breast cancer risk loci. Cell 152, 633–41 (2013). [DOI] [PMC free article] [PubMed] [Google Scholar]
- 53.Marx V Drilling into big cancer-genome data. Nat Meth 10, 293–297 (2013). [DOI] [PubMed] [Google Scholar]
- 54.Reva B, Antipin Y & Sander C Predicting the functional impact of protein mutations: application to cancer genomics. Nucleic Acids Res 39, e118 (2011). [DOI] [PMC free article] [PubMed] [Google Scholar]
Associated Data
This section collects any data citations, data availability statements, or supplementary materials included in this article.