Abstract
Aneuploidy, referring to unbalanced chromosome numbers, represents a class of genetic variation associated with cancer, birth defects and eukaryotic microbes1–4. Whereas it is known that each aneuploid chromosome stoichiometry can give rise to a distinct pattern of gene expression and phenotypic profile4,5, it has remained a fundamental question as to whether there are common cellular defects associated with aneuploidy. In this study, we designed a unique strategy that allowed for the observation of common transcriptome changes of aneuploidy by averaging out karyotype-specific dosage effects using aneuploid yeast cell populations with random and diverse chromosome stoichiometry. This analysis uncovered a common aneuploidy gene-expression (CAGE) signature suggestive of hypo-osmotic stress. Consistently, aneuploid yeast exhibited increased plasma membrane (PM) stress leading to impaired endocytosis, and this defect was also observed in aneuploid human cells. Thermodynamic modeling showed that hypo-osmotic-like stress is a general outcome of proteome imbalance caused by aneuploidy and predicted a ploidy-cell size relationship observed in yeast and aneuploid cancer cells. A genome-wide screen further uncovered a general dependency of aneuploid cells on a pathway of ubiquitin-mediated endocytic recycling of nutrient transporters. Loss of this pathway coupled with the aneuploidy-inherent endocytic defect leads to marked alteration of intracellular nutrient homeostasis.
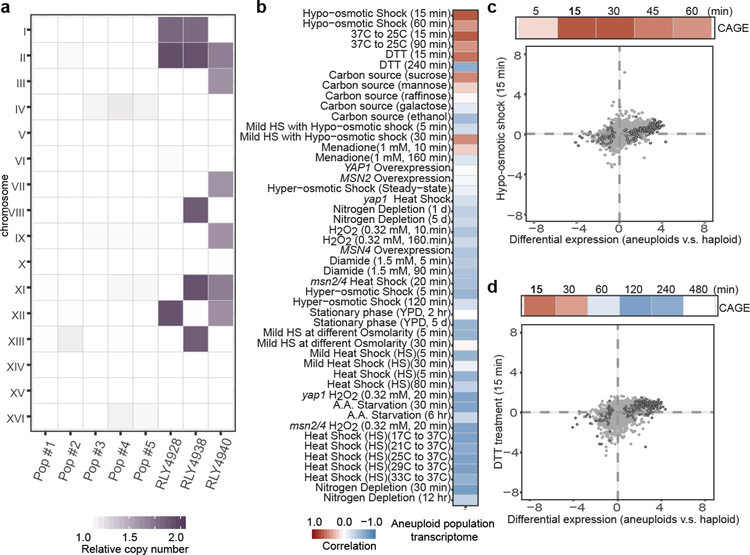
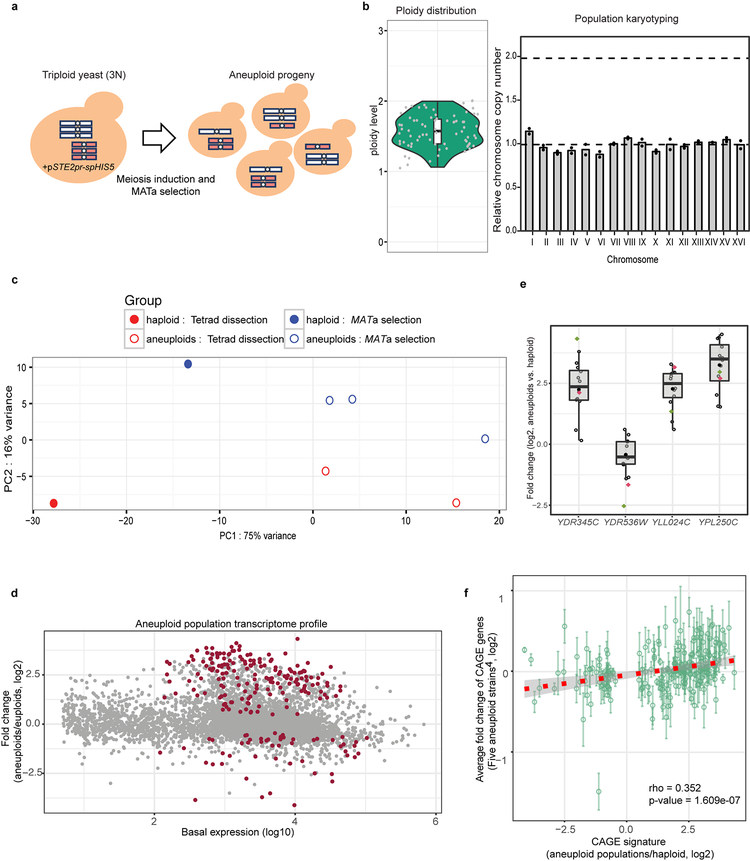
Aneuploidy causes chromosome dosage-dependent changes in the expression of many genes, resulting in phenotypic diversity1,2. Whereas most aneuploid cells exhibit reduced fitness3,4, karyotypically diverse populations exhibit high evolutionary adaptability5–10. Extensive studies have revealed stress responses and genetic pathways in specific aneuploid strains or cell lines1,4,11–20, but the unique transcriptomic patterns and phenotypic profiles associated with individual karyotypes make it difficult to discern the general consequence of aneuploidy5,11. We therefore designed a scheme to analyze aneuploid populations harboring random karyotypes diverse enough to cancel out dosage effects from specific karyotypes within the population (Extended Data Fig. 1a–b, Fig. 1a and Supplementary Methods). RNAseq analysis was performed on five such aneuploid populations in comparison with reference haploid. Despite having euploid-like chromosome stoichiometry, the heterogeneous aneuploid populations exhibited transcriptomic patterns different from that of haploid (Extended Data Fig. 1c). 222 genes, termed common aneuploidy gene expression (CAGE), displaying significantly differential expression relative to haploid, were identified across all five aneuploid populations (Supplementary Table 1; Extended Data Fig. 1d). The expression changes of several CAGE genes in individual aneuploid clones were consistent with those in aneuploid populations. Moreover, the average expression changes of CAGE genes among five stable aneuploid strains5 were positively correlated with the changes in heterogenous aneuploid populations (Extended Data Fig. 1e–f).
Figure 1 |. Karyotype-independent transcriptomic response in heterogeneous aneuploid populations.
a. Relative copy numbers of chromosomes (aneuploid to haploid) in different populations are represented with color gradient in the heat map. Pop #1–2 and #3–5 are heterogeneous populations generated from tetrad dissections or by using the MATa-selection method, respectively. Three aneuploid strains with stable gain of specific chromosomes are shown for comparison5. b. Correlation of differential gene expression patterns between CAGE genes and those in cells under diverse stress conditions21 (compared to stress free conditions). c. and d. Top strips: Positive correlations between CAGE and gene expression changes of cells exposed to hypo-osmotic shock (c) and short-term DTT treatment (d). Color gradient is the same as in (b). Bottom graphs: Correlations of gene expression patterns between aneuploid population (x-axis) and cells exposed to the specified stress for 15 min (y-axis). Grey dots: comparisons of all genes in both transcriptome analyses. Black circles: CAGE genes. Correlations were determined by Spearman’s rank correlation coefficient. Correlation scores and exact p-values (b-d) are shown in Supplementary Table 2; sample sizes (b-d) in Source data.
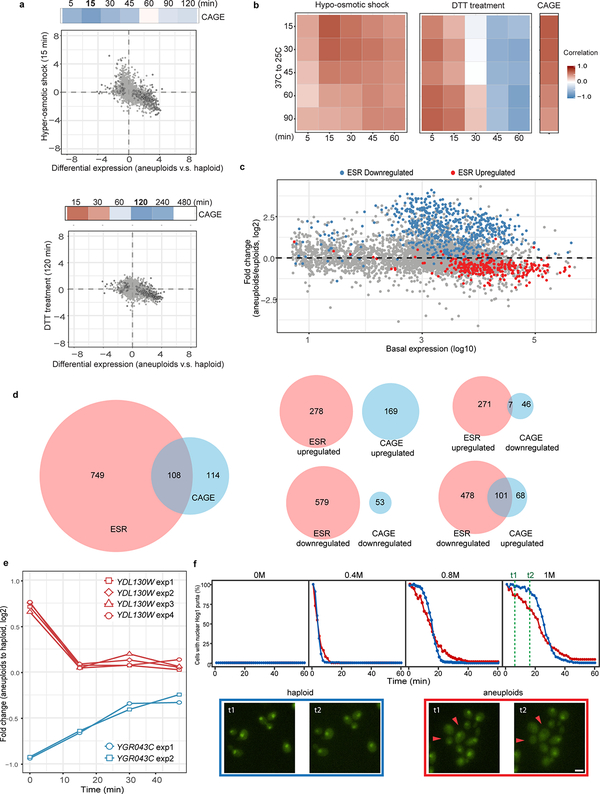
We next compared CAGE with specific transcriptomic patterns in yeast subjected to diverse stress (Fig. 1b; Supplementary Table 2)21. The transcriptional response under hypo-osmotic shock was the most positively correlated expression pattern with the CAGE signature (Fig. 1c), while hyper-osmotic shock was negatively correlated (Extended Data Fig. 2a). Cells under acute treatment with the reducing agent dithiothreitol (DTT), which weakens the cell wall and leads to cell surface stress, also exhibited a similar transcriptomic pattern with CAGE (Fig. 1d). CAGE also positively correlated with transcriptomic changes due to temperature down-shift or switching to sucrose, whose physiological effects are unclear, but all signatures positively correlated with CAGE were themselves correlated (Extended Data Fig. 2b). CAGE genes and environmental stress response (ESR)21 genes showed minor overlap and with opposite expression changes (Extended Data Fig. 2c–d). Notably, CAGE negatively correlated with gene expression changes of heat-shock response or long term DTT treatment (ER stress) (Fig. 1b; Extended Data Fig. 2a).
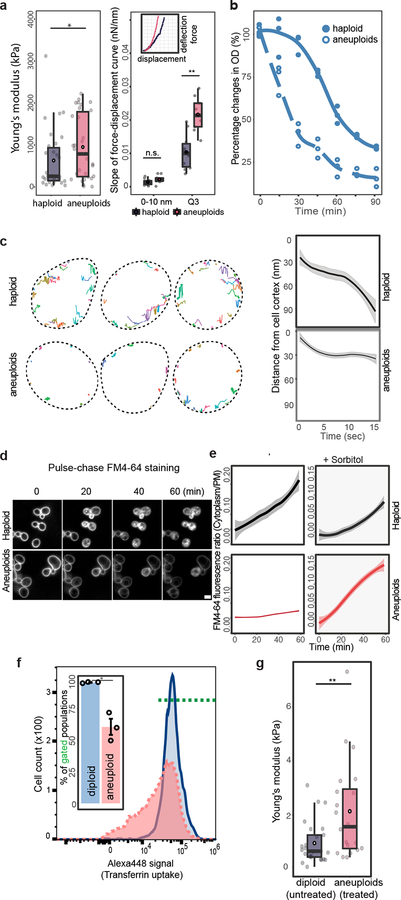
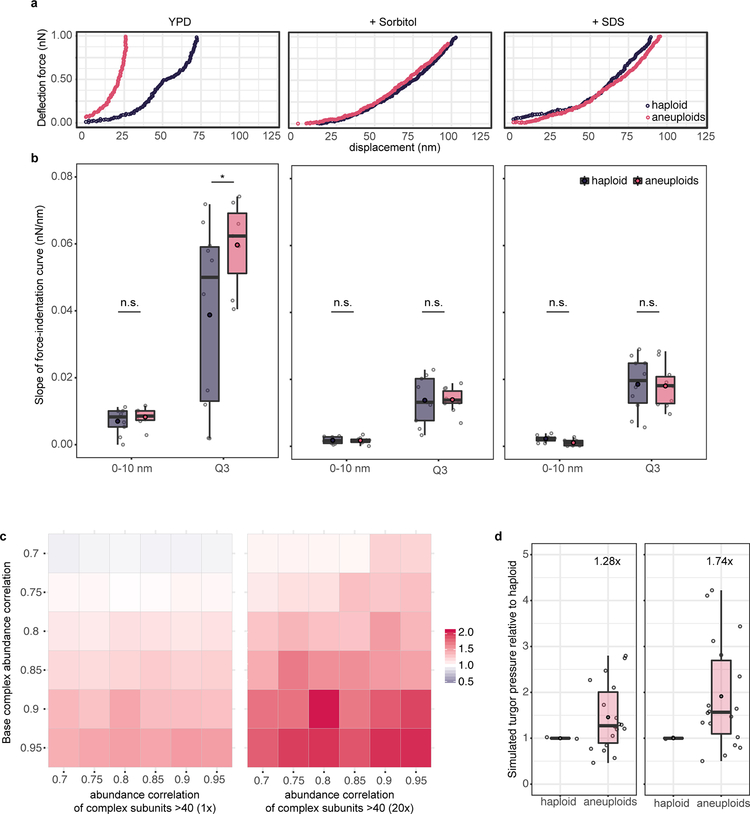
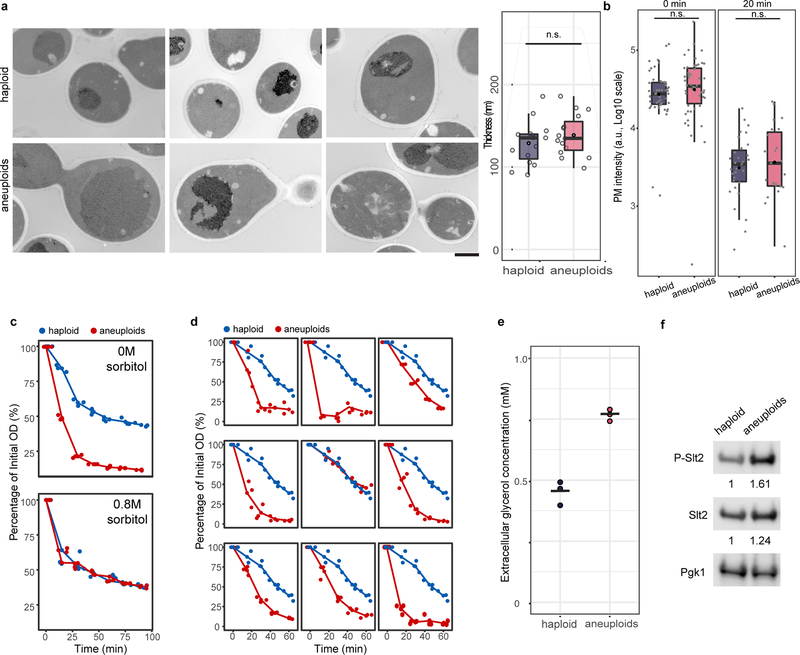
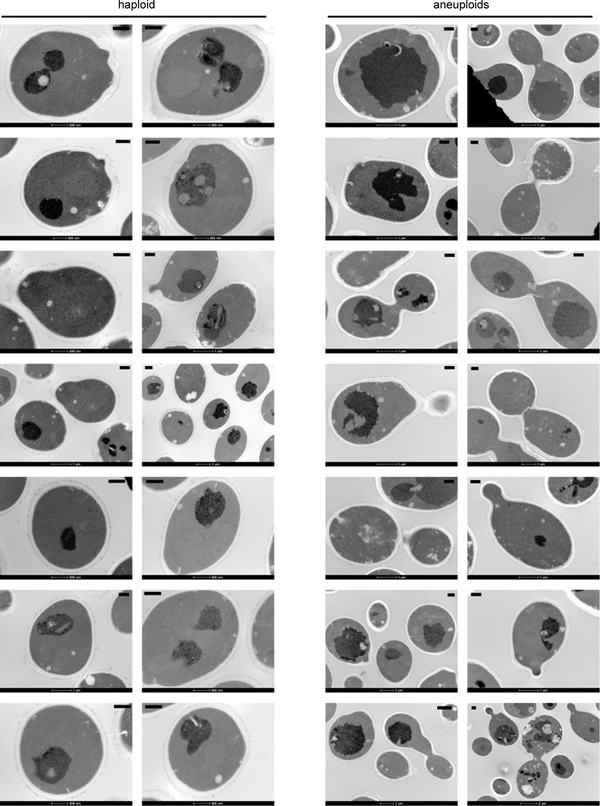
We next investigated the general presence of hypo-osmotic stress in aneuploid populations encompassing diverse random karyotypes. Acute exposure of aneuploid cells to 1M sorbitol (increasing environmental osmolarity) diminished the differential expression of genes shared between CAGE and hypo-osmotic stress signature compared to haploid (Extended Data Fig. 2e). Faster nuclear export of Hog1 in aneuploid after hyper-osmotic shock than that in haploid cells was also consistent with a higher osmolarity in aneuploid cytoplasm (Extended Data Fig. 2f). Water influx in response to hypo-osmotic environments causes an increased intracellular turgor pressure against plasma membrane (PM) and cell wall22. Atomic force microscopy (AFM) measurements showed significantly higher stiffness of aneuploid cells than haploid, which was due to higher intracellular turgor as indicated by the slopes of force-displacement curves at high indentations that are grossly reduced by increasing media osmolarity or cell membrane permeabilization (Fig. 2a; Extended Data Fig. 3a–b). Consistent with an increased turgor, cell lysis occurred faster in aneuploid populations than in haploid after cell wall weakening by zymolyase treatment (Fig. 2b). This was not due to a thinner or faster removal of cell wall and could be alleviated by sorbitol addition; the faster lysis was also observed in individual aneuploid clones (Extended Data Fig. 4a–d and 5). Moreover, aneuploid cells excreted more glycerol within a unit length of time than haploid and exhibited hyper-phosphorylation of Slt2/Mpk1, suggesting a continuous hypo-osmotic stress response in aneuploid cells22,23 (Extended Data Fig. 4e–f).
Figure 2 |. Membrane stress and impaired endocytosis in aneuploid cells.
a. Cell stiffness measured by using AFM in haploid and aneuploid populations. Left: dots represent the mean of measurements on each cell (n=30). Right: example force-displacement plots of haploid and aneuploid cells (inset), and slopes in the lower region of the curves (0–10 nm) and in the third quartile of displacement (Q3) (Boxplots). One curve (chosen randomly out of 4) for each of haploid or aneuploid cells with Young’s modulus close to the mean was analyzed (n=10). b. Changes in optical density (OD) in haploid and aneuploid populations treated with zymolyase (n=3). c. Left: representative tracks of Abp1 foci during endocytosis. Dotted lines outline PM. Right: average travel distance away from PM (y-axis) over time, with ribbons: 95% confidence intervals (CI) (haploid: n=158, aneuploids: n=255). d. Images from time-lapse movies of FM4–64 internalization in haploid and aneuploid cells (representative of three biological repeats, scale bar: 5 μm). e. Average ratios (centre) of FM4–64 intensity in the cytoplasm versus at PM from movies in (d) (left) or immediately after addition of 0.4M sorbitol (right) over time (ribbons: 95% CI, haploid: n=205 and 206; aneuploids: n=200 and 205, respectively). f. FACS profiles for transferrin uptake showing less efficient endocytosis in MPS1inhibitor-treated aneuploid Nalm6 cells (red), compared to the untreated diploid population (blue). Inset bar-plot represents the percentages of cells possessing positive Alexa488-labeled transferrin signal within gated populations (green dotted line) (n=3). g. Cell surface stiffness (y-axis) was measured with AFM in diploid and aneuploid Nalm6 cells induced as in (f) (n =25 and 20, respectively). Box-plots: mean and median are indicated by black circle and centre bar; upper/lower limits and whiskers are quartiles and 1.5× interquartile range. One-tailed Mann-Whitney U-tests for (a, left) and g; one-tailed t tests for (a, right) and f (* p<0.05, ** p<0.005, *** p<0.0001; see Source data for exact p-values).
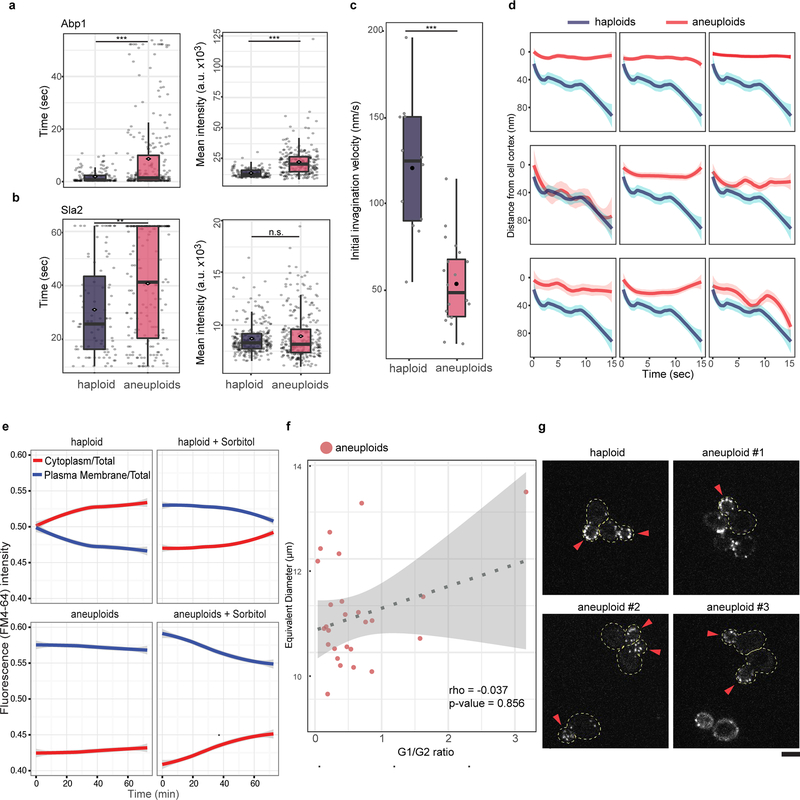
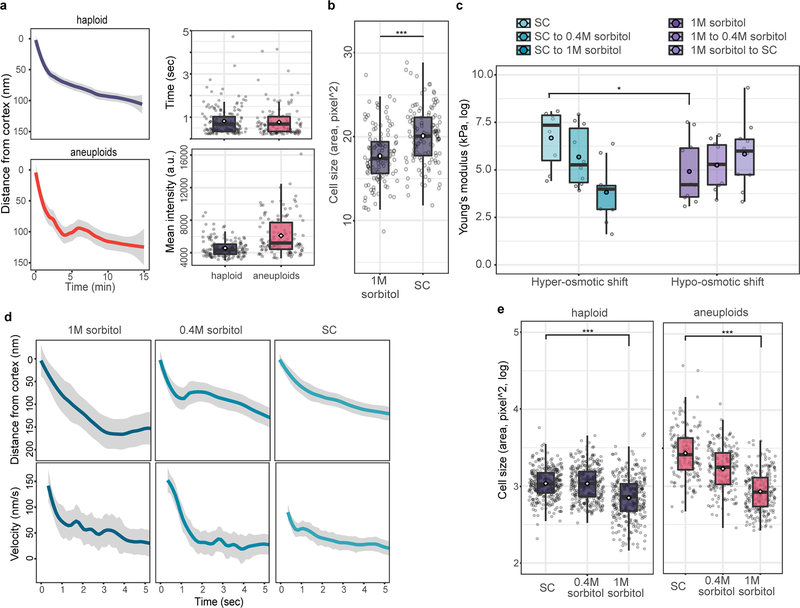
Turgor pressure is expected to counter membrane invagination during endocytosis24,25. Indeed, unlike the fast inward movement of endocytic foci marked by Abp1-GFP in haploid cells, Abp1-GFP in aneuploid cells mostly moved along the cortex, and the duration of both Abp1 and another endocytic patch protein Sla2 were significantly longer in aneuploid cells than in haploids, while no defective recruitment of these proteins was detected (Fig. 2c; Extended Data Fig. 6a–d). The loss of inward movement and the longer cortex duration of Abp1 in aneuploid cells were rescued upon acute increase in environmental osmolarity (Extended data Fig. 7a). The bulk PM turnover monitored through the internalization of FM4–64, a lipophilic dye, was also significantly slowed in aneuploid cells, compared to haploid cells (Fig. 2d–e; Extended Data Fig. 6e). Overall, phenotypes associated with aneuploidy are qualitatively consistent with those observed when haploid cells experienced hypo-osmotic shock and could be alleviated by increasing the external osmolarity (Fig. 2e; Extended Data Fig. 7).
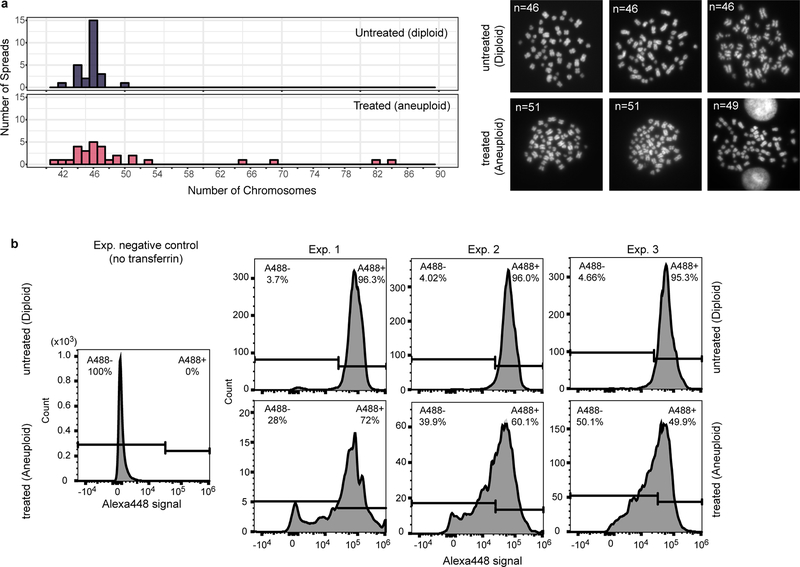
To investigate whether human aneuploid cells also experience hypo-osmotic stress, we induced aneuploidy with random chromosome gains or losses from the mostly diploid Nalm6 leukemia cell line by inhibiting the MPS1 spindle assembly checkpoint kinase followed by 40-hour recovery. Transferrin uptake assay showed impaired endocytosis, and AFM measurements showed a higher average cell stiffness, in the induced aneuploid population than in the control population (Fig. 2f–g; Extended Data Fig. 8). Furthermore, in NCI-60 cancer cell lines, “plasma membrane” was among the top significantly enriched gene ontology (GO) terms of those genes upregulated with increasing CIN levels, defined by chromosomal numerical heterogeneity14,25, while the same GO term (PM) was also significantly enriched among yeast CAGE genes (Supplementary Table 3).
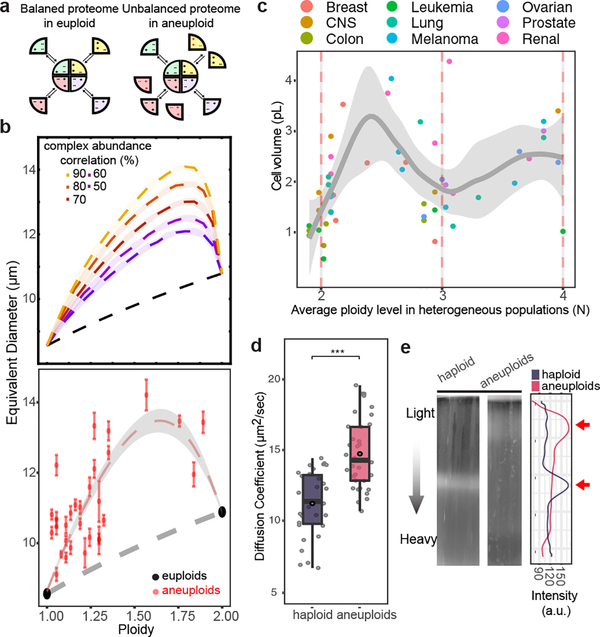
Chromosome gain or loss leads to scaled changes in average protein levels encoded by aneuploid chromosomes5,12,16. The disrupted proteome balance elevates the amount of free proteins that normally participate in protein complex formation, which would result in an increased intracellular solute concentration, leading to high cytoplasmic osmolarity in aneuploid cells (Fig. 3a). We modeled the effect of proteome imbalance based on thermodynamics principles (Supplementary Methods). Simulations showed that the osmotic pressure increase due to proteome imbalance leads to cell swelling, the degree of which is a non-linear function of the DNA content and beyond that predicted by linear scaling with the genome size, a trend consistent with experimental measurements (Fig. 3b; Supplementary Methods). The cell swelling phenotype could not be attributed to misregulation of cell cycle or cell polarity (Extended Data Fig. 6f–g), although these defects could affect cell size in specific aneuploids. Strikingly, this non-linear cell-genome size scaling was also observed in the NCI-60 panel of cancer cells (Fig. 3c). Simulation of the turgor pressure also showed higher values in aneuploid than in haploid cells across a reasonable parameter range (Extended Data Fig. 3c–d). Additionally, the theory predicts increased diffusion of cytosolic proteins and a decreased cell density for aneuploid compared to euploid cells, which are also validated experimentally (Fig. 3d–e).
Figure 3 |. Hypo-osmotic stress is a biophysical outcome of proteome imbalance.
a. Schematic representation of proteome imbalance. Left: the euploid state with roughly balanced stoichiometry of proteins that form a multi-subunit complex. Right: the aneuploid state: gene dosage imbalance leads to additional unassembled proteins that cannot form complex due to missing partners. b. Top: cell volume (represented as equivalent diameter) as a function of ploidy levels in aneuploids between 1N and 2N, simulated by assuming different degrees of correlation of the levels of proteins that form complexes. Bottom: cell volume vs ploidy level, measured by using microscopy and FACS, respectively, of euploids and aneuploids (n=30, see Source data for detailed sample size in individual populations; error bars: SEM). Trendlines (centre in b and c, for aneuploids) with 95% CI (ribbon) were obtained by fitting a loess regression to the data. c. Average cell volume vs ploidy level of NCI-60 cancer cell lines (n=54). The trend shown is independent of tissue types (generalized linear model fit: coefficient p-values > 0.05, see Source data for exact p-values). Dots represent averaged cell volume measurements; color scheme of the dots indicates tissue types. Ploidy level of each cell line is estimated from CellMiner database; trendline with ribbon (95% CI) includes the distribution (SD) of single cell volume measurements in each cell line from Dofli et al.30 (Supplementary Table 7). d. Diffusion coefficients of GFP (y-axis) in haploid and aneuploid cytoplasm measured by using fluorescence correlation spectroscopy (FCS). GFP diffusion was significantly faster in aneuploid than in haploid cytoplasm (n= 35 and 32; one-tailed Mann Whitney U-test: p-value =1.63×10⁻⁷). Boxplots are defined as in Fig. 2. e. Density of haploid and heterogeneous aneuploids assessed with density gradient centrifugation (representative results from three biological repeats). Right: cell distribution along the gradient; arrows point to the positions of the majority of cells in the gradient.
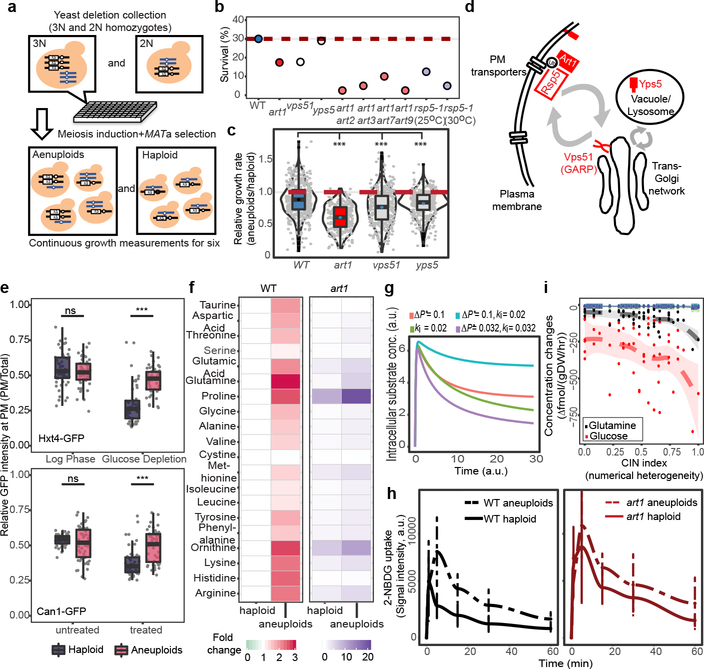
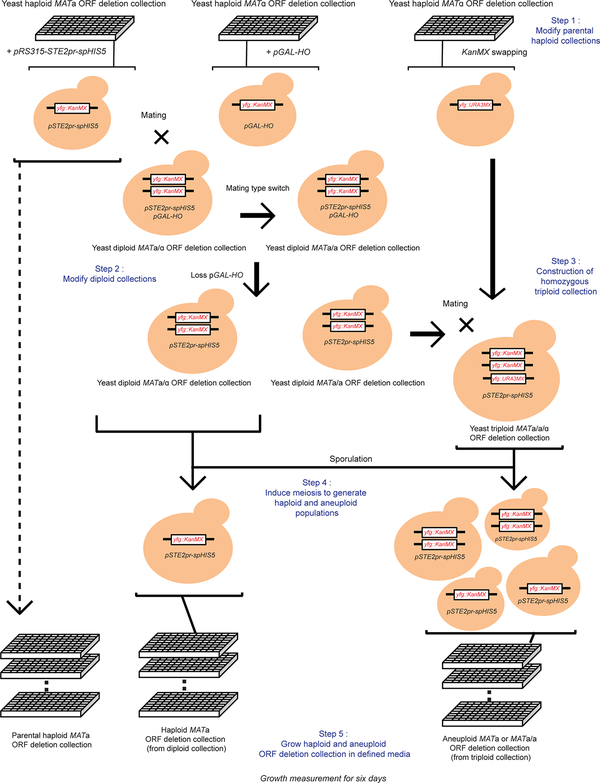
We next performed a genome-wide screen to identify non-essential gene deletions (orfΔ) more detrimental to aneuploid populations comprising diverse karyotypes than to haploid (Fig. 4a, Extended Data Fig. 9, Supplementary Methods and Table 4). Primary screen revealed an enriched GO term “response to osmotic stress” in gene deletions, causing low growth capacity in aneuploid populations, such as genes related to cell wall integrity signaling pathway wsc1 and aquaglyceroporin fps1 (Supplementary Table 3)22. Further validation experiments narrowed the candidates down to three mutants (art1Δ, vps51Δ and yps5Δ) that generally reduced the viability and growth rate of aneuploid populations with broad karyotype diversity compared to haploid, whereas the growth defects of the other primary hits could be overcome likely through karyotype selection (Fig. 4b–d, Supplementary Methods and Table 5). art1Δ exhibited the lowest relative growth rates across nearly all cells of heterogeneous aneuploid populations (Fig. 4c). Art1 is an arrestin-related trafficking adaptor, targeting E3 ubiquitin ligase Rsp5 to promote endocytosis of PM amino acid transporters26,27. Heterogeneous art1Δ aneuploid, but not haploid, cells carrying a second deletion of other members of this gene family showed further reduced viability (Fig. 4b; Supplementary Table 5). Furthermore, aneuploid cells bearing the rsp5–1 mutation also exhibited dramatically reduced viability, compared to rsp5–1 haploid, at both permissive and semi-permissive temperatures (Fig. 4b; Supplementary Table 5).
Figure 4 |. Dependency of aneuploid cells on the ART-Rsp5 pathway for fitness and nutrient homeostasis.
a. Genome-wide deletion screen in heterogeneous aneuploid populations. b. Survival rates of aneuploids harboring specific mutation(s) (Supplementary Table 5). c. Microscopic colony growth of the three validated mutants. Grey dots represent the ratio of growth rate of a single aneuploid microcolony to average growth rate of haploid microcolonies carrying the same mutation. d. Schematic representation of subcellular locations of Art1, Vps51 and Yps5 in endocytic pathway and the function of Art1 and Rsp5 in ubiquitylating PM-bound endocytic cargo. e. Hxt4 and Can1 turnover in response to glucose depletion and canavanine addition, respectively, in haploid and aneuploid populations. Grey dots represent the ratio of GFP intensity (PM vs entire cell, y-axis). f. Heatmaps showing fold changes in the relative abundance (to WT haploids) of intracellular free amino acids in WT and art1Δ haploids and aneuploids. g. Modeling of combinatorial effects of increased turgor pressure (ΔP*) and reduced rate constant (ki) for transporter downregulation on the kinetics of substrate uptake. h. Uptake of glucose analog 2-NBDG in haploid or aneuploid WT or art1Δ cells over time (mean±SD). i. Relationship of CIN level and the net influx of extracellular metabolites in the NCI-60 cancer cells (n=54). Consumption of glucose and glutamine (colored line with 95% CI ribbon) was significantly correlated with the level of CIN. 30 metabolites with positive net influx were plotted (other colored lines). Spearman’s rank correlation scores and exact p-values were consolidated in Supplementary Table 7. Box-plots and violin-plots (c and e) are defined as in Fig. 2 and Methods. See Source data for sample sizes (c, e, and h) and exact p-values (c and e), one tailed Mann-Whitney U test (***: p<0.0001).
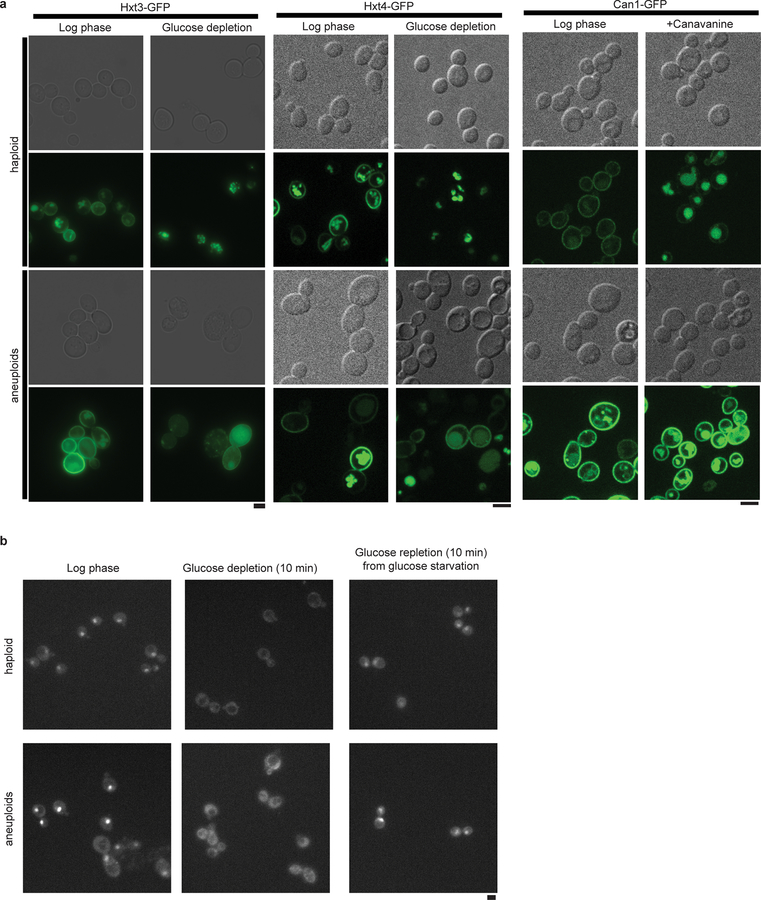
The above findings implicate a possible general defect of aneuploid cells in the regulation of PM nutrient transporters. Supporting this, the glucose transporters Hxt3 and Hxt4 were not efficiently internalized in response to glucose depletion in a heterogeneous aneuploid population, unlike in haploid cells, even though the glucose sensing pathway remained functional (Fig. 4e; Extended Data Fig. 10). Similarly, the turnover of Can1, arginine permease, after treatment with the toxic arginine analog canavanine was also reduced in aneuploid cells (Fig. 4e). The relative concentrations of free amino acids, in particular glutamine, were altered in aneuploids, compared to wild-type haploid, while art1Δ further exacerbated this imbalance (Fig. 4f; Supplementary Table 6). We constructed a flux-based model to understand the general impact of nutrient homeostasis from aneuploidy-associated membrane stress (Supplementary Methods). Simulations using this model revealed that changes in the turgor-associated parameter (ΔP*) and the rate constant for nutrient-regulated transporter downregulation (ki) would result in the most dramatic changes in nutrient homeostasis (Supplementary Methods, Fig. 4g), which was validated by glucose uptake kinetics in wild-type and art1Δ haploid and aneuploid cells (Fig. 4h). Interestingly, the influx of glucose and glutamine, compared to other carbohydrates and amino acids, respectively, are most significantly and positively correlated with CIN levels among NCI-60 cancer cells (Fig. 4i and Supplementary Table 7)28, suggesting that metabolic remodeling may be a consequence of the hypo-osmotic stress in aneuploid cancer cells with ongoing CIN.
The data presented above uncovered an aneuploidy-associated general stress state that may be explained by proteome imbalance. This hypo-osmotic-like stress state in aneuploid cells is chronic, unlike transient osmotic shock responses of euploid cells21. A downstream general endocytic defect underlies a metabolic dysregulation that can be observed in aneuploid yeast and may also be evident in aneuploid cancer cells. This inherent defect in aneuploid cells also explains their survival and growth dependence on the ART-Rsp5 pathway. Rsp5 is a homolog of mammalian NEDD4, a member of the HECT family E3 ubiquitin ligase. In mammalian cells, multiple E3 ligases, such as NEDD4 and Mdm2 work together with arrestin family adaptors to modulate the homeostasis of the plasma membrane proteome29. Thus, the deleterious effects of mutations affecting Art proteins and the Rsp5 E3 ubiquitin ligase may provide a proof-of-concept for how a common deficiency of aneuploidy may be targeted.
Data Availability
Experimental data, genomics analysis pipeline and mathematical model details supporting the findings of this study are provided in the Supplementary Information, Source data files for each figure, and public data repository (https://github.com/RongLiLab/Tsai-et-al.−2019). All data are available from the authors on reasonable request. The accession number for the whole genome sequencing and transcriptome data in this paper are SRP126434 and GSE107997, respectively.
Code availability
Genomics analysis pipeline and the details for the mathematical models are available online (https://github.com/RongLiLab/Tsai-et-al.−2019) or upon request.
Methods
All methods were documented in Supplementary Information.
Supplementary Material
Extended Data
Extended Data Figure 1 |. Generation of heterogeneous aneuploid populations without chromosome copy number bias for transcriptomic analyses.
a. Generation of aneuploid cells through random meiotic segregation from a homozygous triploid (3N) yeast strain bearing a centromeric plasmid carrying the selection marker spHIS5 under the MATa-specific promoter STE2pr. Colored rods represent chromosomes. b. Left panel: DNA content of a cohort of random aneuploid spore colonies (each represented by a grey dot, n=75; Source data) produced through triploid meiosis analyzed by FACS; box-plot and violin-plot (defined as in Fig. 2 and Methods) show the distribution of ploidy levels. Right panel: 192 random aneuploid colonies produced by triploid meiosis were pooled and the resulting population subjected to qPCR-based karyotyping (representative results from two biological repeats). Y-axis represents the relative copy number (mean of the two arms) of each chromosome (dots) to the reference haploid yeast. There was no significant difference in copy number between each chromosome (One-way ANOVA, p-value = 0.998). c. Principal component analysis of RNA-seq results in different populations. PC1 (x-axis) shows apparent difference between haploid (n=2) and aneuploid (n=5) populations. PC2 (y-axis) reflects a small difference in the two methods of generation of aneuploid populations. Each dot represents one population. d. Gene expression in heterogeneous aneuploid populations (n=5) relative to haploid populations (n=2) in MA plot. X-axis represents basal mean expression in log10 scale; Y-axis represents differential expression changes between aneuploid and euploid populations in log2 scale. P-values calculated on the Wald statistic were corrected for multiple comparisons (Benjamini-Hochberg) and the resulting FDR was further corrected for variance underestimation using an empirical null model. CAGE genes were identified as genes with final FDR < 0.05 (see details in Supplementary Methods; exact p-values in Supplementary Table 1). Each dot represents one gene, and 222 significantly differentially expressed (CAGE) genes common to all five aneuploid cell populations are labeled in dark red. e. RT-qPCR validations of four significantly differentially expressed genes from the RNA-seq analysis in a heterogeneous aneuploid population (n=1) and randomly picked individual aneuploid clones (n=12). Black circles: individual aneuploids, red dot: a heterogeneous aneuploid population, and green dot: aneuploid populations in RNA-seq (d). For individual aneuploid colonies, expression change of each gene was normalized by the gene copy number (determined by qPCR), and then normalized to that of a non-CAGE gene (ACT1). Average gene expression changes in the population and in the individual aneuploid clones followed similar trends (up or down regulated) as heterogeneous populations in RNA-seq. Boxplot representation as in Fig. 2 for measurements from the 12 aneuploid clones. f. Correlation analysis of expression changes of the genes implicated in the CAGE signature showing positive correlation between aneuploid populations and stable aneuploid strains (n=5)5 (Spearman’s rank correlation). Green circles represent mean expression changes of genes within the CAGE signature (213 in common in the transcriptomic data between aneuploid populations and the individual strains); error bars: SEM. Only eight genes across all five strains appear to show opposite expression trend to CAGE. The trendline was fitted by linear regression (red dashed line) with grey ribbon (95% CI). Significant positive correlation was observed between the average gene expression changes in the five aneuploid strains and CAGE observed with the heterogeneous aneuploid population subjected to RNAseq (p-value = 1.609e-07).
Extended Data Figure 2 |. Comparisons of gene expression patterns between CAGE and several stress responses.
a. Top panel: Heat map showing negative correlation between CAGE and gene expression changes of cells exposed to hyper-osmotic shock for different time periods. Color gradient is the same as described in Fig 1b. Scatter plot: Genome-wide and CAGE correlation of gene expression patterns between aneuploid population (x-axis) and cells exposed to hyper-osmotic stress for 15 min (y-axis). Color scheme is the same as describe in Fig. 1c; Correlation scores from the Spearman’s rank correlation test and exact p-value are in Supplementary Table 2; sample size (n) is documented in Source data Fig. 1. Bottom panel: figure presentations are as described in top panel, but the correlation between CAGE and long term DTT treatment (120 min). b. Heat map showing positive correlation of gene expression changes in cells experiencing temperature down-shift (37 °C to 25 °C) with those in cells experiencing hypo-osmotic shock (left), short-term DTT treatment (middle) or with CAGE (right). Correlation test and scores are described as previously (a); sample size (n) is documented in Source data. c. The same MA plot as shown in Extended Data Fig. 1d with labels of ESR genes (n=857)21. Red and blue dots indicate up-regulated or down-regulated ESR genes, respectively, when cells were exposed to stress. d. Venn diagrams showing common genes between CAGE and ESR (left). No overlapping genes between up-regulated genes in CAGE and ESR were found, and the same is true for down-regulated genes in CAGE and ESR; whereas there are some overlaps between oppositely regulated CAGE and ESR genes. e. RT-qPCR monitoring expression changes of two CAGE genes that are also significantly differentially expressed under hypo- and hyper-osmotic shock21 in a heterogeneous aneuploid population exposed to hyper-osmotic shock (0 to 1M sorbitol). Multiple primer sets targeting each gene were used. Y-axis indicates the ratio of gene expression between aneuploids and haploid (CAGE signature) over time immediately after cells were shifted to medium with 1M sorbitol (x-axis). Note that one of the genes was upregulated (blue) in CAGE while the other was downregulated (red). Plots show that these changes were alleviated by hyper-osmotic shock. f. Top panel: percentage of cells with nuclear-localized Hog1 as a function of time after different levels of acute hyper-osmotic exposure in haploid and aneuploids. Y-axis indicates the percentage of cells with nuclear-localized Hog1-GFP signal over time immediately after cells were shifted to medium with 1M sorbitol (x-axis). Bottom panel: example images (two independent experiments) from two time points (t1 and t2, labeled with green lines at top panel) in haploid and aneuploid cells (n=287 and 254; see Source data for full information of sample size). Red arrows indicated diminished nuclear localized Hog1. Note that Hog1 import occurred fast such that even at the first time point of measurement after osmotic shock most cells already displayed nuclear Hog1.
Extended Data Figure 3 |. Turgor pressure measurements of cells under hyper-osmotic environment or experiencing cell permeabilization and biophysical model predictions.
a. Example force-displacement curves showing the difference of curve shapes from indented haploid and aneuploid cells in normal (YPD) or immediately after shift to medium containing 0.4 M sorbitol or pre-treated with 0.1%SDS (see sample size (n) in Source data). The pre-set force for this AFM experiment was 1 nN. b. Box plots of slopes (nN/nm) computed at two parts of the curves in (a): first 10 nm of z-piezo displacement, mostly reflecting cell wall stiffness, and the third quartile (Q3) of the curve, expected to be contributed from cellular turgor. The results show that that increasing extracellular osmolarity (Sorbitol, middle panel) or cell permeabilization (SDS, right panel) led to a drastic reduction of intracellular turgor and diminished the increased turgor in aneuploid cells to the level of that in haploid (One-tailed t test; sample size (n) in Source data. In YPD, at 0–10 nm: p-value = 0.241; at Q3: p-value = 0.029. In sorbitol, at 0–10 nm: p-value = 0.3299; at Q3: p-value = 0.4765. In SDS, at 0–10 nm: p-value = 0.9675; at Q3: p-value = 0.5594.). c. Model-simulated average turgor pressure change (ratio between aneuploids and haploid) based on the combinations of two parameters, abundance correlation of proteins forming large complex (above 40 proteins per complex, such as ribosomes, x-axis) and abundance correlation of proteins forming average complex (base level, y-axis) across a reasonable range of values (0.7–0.95). Heatmaps show the parameter scan without (left) and with (right) adjusting the abundance of large complexes to 20x of base concentration of complexes. d. Example boxplots of simulated turgor pressure ratios (aneuploids versus haploid; n= 18 and 2, respectively) using 0.85 abundance correlation of proteins forming base or large complexes without (left) and with (right) the adjustment as in (a). Each dot presents a simulated ratio of turgor based on experimental size measurements at each ploidy (see Fig. 3b). Boxplots are defined as in Fig. 2.
Extended Data Figure 4 |. Aneuploid cells display cell wall stress phenotypes due to hypo-osmotic imbalance.
a. Representative electron micrographs of haploid (top) and aneuploid (bottom) cells and box plots of measured cell wall thickness showing no significant difference of cell wall thickness between haploid (n=15) and aneuploid (n=15) cells (one-tailed t test, p-value=0.152; measurements in Source data). Scale bar: 1 μm. b. Mean intensity of fluorescently labeled concanavalin A on PM was measured in haploid and aneuploid cells at 0 and 20 minutes during zymolyase treatment (haploid: n=50 and 31; aneuploids: n=50 and 23). The fluorescence intensities were similar between haploid and aneuploid cells at these time points (one-tailed Mann Whitney U test p-value at 0 min = 0.1285 and 20 min = 0.7286), suggesting similar rates of cell wall removal by zymolyase in the two populations. c. Haploid and aneuploid cells were treated with zymolyase to assess the tendency to burst by OD measurement in normal or hyper-osmotic (0.8M sorbitol) environments. Y-axis represents the percentage of intact cells relative to time zero of treatment; x-axis indicates the time immediately after addition of zymolyase with or without 0.8 M sorbitol. Each dot represents one measurement at each time point (n=3). Plots show that the hyper-osmotic environment rescued the hypersensitivity of aneuploid cells to zymolyase compared to haploid cells. d. Nine individual aneuploid clones were tested for their zymolyase sensitivity as described in Figure. 2b. Haploid and aneuploid cells were indicated by blue and red, respectively; each dot represents one measurement at each time point (n=3). The plots show that the zymolyase hypersensitivity was associated with most aneuploid clones. e. Extracellular glycerol concentration was measured to assess the exportation of glycerol (glycerol in the supernatant of the cultures) during a two-hour timespan. Each dot represents one measurement in each culture (n=3 in both haploid and aneuploids; black bar: mean concentration). f. Immunoblots for phosphorylated Slt2, total Slt2 and Pgk1 showed an increased phosphorylation of Slt2 in aneuploid cells, compared to that in haploid cells. Fold changes of quantified phospho-Slt2 and Slt2 signal intensity between haploid and aneuploid cells were normalized by Pgk1 signal of each population, respectively. Representative blot from two independent experiments (Supplementary Fig. 1: raw gel images). Boxplots (a and b) are defined as in Fig. 2.
Extended Data Figure 5 |. Electron micrographs of haploid and aneuploid cells used for the quantification of cell wall thickness (in nm) in Extended Data Figure 4a.
Haploid and aneuploid cells were processed and imaged by using electron microscopy. Each EM panel was assembled as described in Methods. Four measurements of cell wall thickness were made from one cell in each image. Scale bar (top right or left corner of each image): 500 nm.
Extended Data Figure 6 |. Aneuploid cells show impaired endocytosis but not general cell cycle or polarity defects.
a. and b. Duration (left) and abundance (mean intensity of GFP signal, right) of Abp1 (a) and Sla2 (b) at endocytic patches were measured comparing aneuploid and haploid cells. Duration and abundance of Abp1 are significantly greater in aneuploid cells, compared to haploids (for duration, haploid: n=146; aneuploid: n=255, p-value < 2.94e-11; for abundance, haploid: n=144; aneuploid: n=237, p-value < 2.2e-16, one-tailed t test). This is consistent with the delay in endocytic invagination observed in aneuploid cells as the increase in abundance likely results from additional F-actin accumulation. Duration, but not abundance, of Sla2 was significantly greater in aneuploid cells. (for time, haploid: n=91; aneuploid: n=173, p-value = 0.002758; for abundance, haploid: n=261; aneuploid: n=275, p-value =0.863, one-tailed t test), again consistent with the delay during endocytic invagination. These results also suggest that the endocytic defect of aneuploid cells was not due to a lack or unstable localization of these proteins to actin patches. c. Initial velocity of Abp1 during invagination was measured in single cells. Velocity of Abp1 inward movement in haploid cells is significantly faster than in aneuploid cells (haploid: n =12; aneuploids: n= 20. p-value = 2.237e-06, one-tailed t test). Boxplots (a-c) are defined as in Fig. 2.; data in Source data. d. Average distance of Abp1 inward movement from cell cortex in individual aneuploid cells (n=9; Source data). The plots show average distance with ribbons representing 95% confidence intervals (CI). Abp1 in most aneuploid cells moves along the cortex. e. Net changes of FM4–64 signal intensity (arbitrary unit) at PM and cytoplasm over time (related to Fig. 2e, haploid: n=205 and 206; aneuploids: n=200 and 205, respectively, in left and right panels; Source data Fig. 2). Solid lines represent average fluorescent intensity; grey ribbons represent 95% CI. Bulk rate of FM4–64 internalization (mean±SD, min−1): haploids: 7.66E-4±1.49E-3; aneuploids: 1.87E-4±4.42E-4; haploids in sorbitol: 4.73E-4±9.35E-4; aneuploids in sorbitol: 9.73E-4±1.16E-3. f. Correlation analysis between cell size (y-axis) and cell cycle profile (x-axis, ratio of G1 and G2 peaks from FACS analysis; Source data) in aneuploid cells (red dots, n=26) (from experimental results in Figure 3b, bottom). No correlation was found (Spearman’s rank correlation score = −0.037, p-value = 0.856), indicating that variation in cell cycle distribution was not associated with the increased cell size in aneuploid populations. The trendline (dashed line) was fitted by linear regression (red dashed line) with grey ribbon (95% CI). g. Representative images of polarized cells with Abp1-GFP as a marker of actin patches showing preferential localization at the bud cortex (red arrowheads), indicative polarized cells. 97.6% haploid and 93.2% of aneuploid small budded cells (n=42 and 44, respectively; bud size roughly equal to or smaller than 1/2 of the mother cell, data collected from three independent experiments) exhibited a polarized actin patch distribution. Scale bars: 5 μm.
Extended Data Figure 7 |. Additional data showing hypo-osmotic stress leads to increased cell size and endocytic slowdown in both haploid and aneuploid cells.
a. Left panels: average distance that Abp1 traveled away from cell cortex under acute exposure to medium containing 0.4M sorbitol (grey ribbon: 95% confidence intervals; haploids: n = 150; aneuploids: n = 136). No significant difference in the distance travelled inwardly by Abp1 patches was observed between haploid cells (top) and aneuploid cells (bottom) in this hyper-osmotic environment (Tukey contrasts on GLM, multiple testing corrected p-value = 0.0968). Right panels: Duration (top) and abundance (mean intensity of GFP signal, bottom) of Abp1 at endocytic patches under acute treatment of 0.4M sorbitol were measured comparing aneuploid and haploid cells. Duration of Abp1 at cortex between haploid and aneuploid cells were similar, while abundance of Abp1 right before inward traverse between two group remained different (for duration, haploid: n=144; aneuploid: n=169, p-value = 0.731; for abundance, haploid: n=140; aneuploid: n=121, p-value = 3.106e-10, one-tailed t test). b. Haploid cells experiencing hypo-osmotic stress (20 min after shifting from growth medium (SC) containing 1M sorbitol to SC without sorbitol) displayed increased cell size compared to cells continuously growing in medium with 1M sorbitol (n = 120 in both sets; one-tailed t test, p-value = 3.437e-08). c. Cell surface stiffness (Y-axis) was measured with AFM in haploid cells under hyper- (left panel) and hypo-osmotic (right panel) shock within 30 minutes of osmotic shift. Boxplots show that cell stiffness was significantly different between cells growing in normal (SC) and hyper-osmotic (1M sorbitol) environments (p-value= 0.028, one-tailed t test; sample size (n) and data in Source data), and trended downward or upward after a hyper- or hypo-osmotic shift, respectively. d. Average distance traveled and velocity (centre) of Abp1 from cell cortex (Y-axis, ribbon: 95% CI) was monitored over time (X-axis) when haploid cells were exposed to hypo-osmotic shock as in (a). When cells were transferred from high (1M sorbitol) to low (SC) osmolarity environment, average distance traveled and velocity became shorter (Tukey contrasts on GLM, 1M sorbitol to SC: p-value = 0.00783) and slower (Tukey contrasts on GLM, 1M sorbitol to SC: p-value = 0.0134), respectively (see Source data for sample size (n)). e. Cell size decreases in haploid and aneuploid cells exposed to hyper-osmotic stress. Cells in haploid (left panel) and aneuploid populations (right panel) significantly reduced in size after being shifted from SC to medium with 1M sorbitol, compared to those grown continuously in SC medium (for haploids, n= 300 and 321; one-tailed t test, p-value < 2.2e-16; for aneuploids, n= 151 and 237; one-tailed t test, p-value < 2.2e-16). Data (a-e) and exact p-values in Source data; boxplots (a-c and e) are defined as in Fig. 2.
Extended Data Figure 8 |. Aneuploidy associated hypo-osmotic stress impairs efficient endocytic internalization in human cells.
a. Left panel: Distribution of chromosome counts from metaphase spreads in two different groups: MPS1 inhibitor-treated (red, aneuploid cells) and untreated (blue, diploid cells). The treated population is more aneuploid than the untreated population (two-sided Fisher Exact test: p-value= 0.002688, n=30 in both populations, Source data). Right panel: Three example images from the metaphase spreads. Representative results from two independent experiments. b. FACS profiles in transferrin uptake assay (related to Fig. 2f). Three independent experiments were performed to assess uptake efficiency of transferrin in MPS1 inhibitor-treated (bottom, aneuploid) and untreated (top, diploid) cells. Histograms show the distribution of Alexa488-labeled transferrin signals (x-axis) in the population (y-axis). The same gate was applied to all three experiments to estimate the percentage of Alexa488 positive population.
Extended Data Figure 9 |. Genome-wide ORF deletion screen for mutations reducing aneuploid cell fitness.
Schematic procedure of the construction of yeast triploid homozygous deletion collection and the production of karyotypically heterogeneous aneuploid ORF-deletion populations (see detailed description in Supplementary Methods).
Extended Data Figure 10 |. Aneuploidy prevents endocytic turnover of PM transporters.
a. Representative images of quantified results in Fig. 4e. Haploid and aneuploid populations with Hxt3-GFP (left), Hxt4-GFP (middle) were grown with or without glucose. Hxt3/4-GFP remained on PM after 20 hours of glucose depletion in aneuploid but not haploid cells. Haploid and aneuploid populations with Can1-GFP (right) were grown with or without canavanine. Can1-GFP in aneuploid but not haploid cells remained on PM after four hours of treatment. Two independent experiments; scale bars: 5 μm. b. Representative images show Mig1-GFP translocation out of the nucleus after glucose depletion and returned after glucose repletion, demonstrating that glucose sensing is not impaired in aneuploid cells compared to euploid (three independent images of each condition from two independent experiments). Scale bar: 5 μm.
Acknowledgements
We thank S. Emr (Cornell University) and E. Spear (Johns Hopkins) for helpful suggestions and providing yeast strains, P. Iglesias (Johns Hopkins) for advice on mathematical modeling, B. Rubenstein (Stowers Institute) for advice on screen analysis, N. Chau and S. McCroskey for technical assistance, K. Staehling and members of Stowers Institute Molecular Biology core for assistance with the high-throughput screen, L. Kratz (Kennedy Krieger Institute) for amino acids analysis, H. Hao (Johns Hopkins Deep Sequencing and Microarray Core) for help with DNA- and RNA-seq, M. McCaffery (Johns Hopkins University Integrated Imaging Center) for electron microscopy, and A. Selmecki for comments on the primary manuscript. This work was supported by NIH grant R35-GM118172 to R.L., Prostate Cancer Foundation Young Investigator Award (16YOUN21) to H-J. T., NSF award DBI-1350041 and NIH award R01-HG006677 to M.C.S., NIH grant R01-GM114675 and U54-CA210173 to S.X.S..
Footnotes
Competing interest declaration
The authors declare no competing interests.
References
- 1.Chunduri NK & Storchová Z The diverse consequences of aneuploidy. Nat. Cell Biol 21, 54–62 (2019). [DOI] [PubMed] [Google Scholar]
- 2.Pavelka N, Rancati G & Li R Dr Jekyll and Mr Hyde: role of aneuploidy in cellular adaptation and cancer. Curr. Opin. Cell Biol 22, 809–815 (2010). [DOI] [PMC free article] [PubMed] [Google Scholar]
- 3.Williams BR et al. Aneuploidy Affects Proliferation and Spontaneous Immortalization in Mammalian Cells. Science 322, 703–709 (2008). [DOI] [PMC free article] [PubMed] [Google Scholar]
- 4.Torres EM et al. Effects of aneuploidy on cellular physiology and cell division in haploid yeast. Science 317, 916–924 (2007). [DOI] [PubMed] [Google Scholar]
- 5.Pavelka N et al. Aneuploidy confers quantitative proteome changes and phenotypic variation in budding yeast. Nature 468, 321–325 (2010). [DOI] [PMC free article] [PubMed] [Google Scholar]
- 6.Selmecki A, Forche A & Berman J Aneuploidy and isochromosome formation in drug-resistant Candida albicans. Science 313, 367–370 (2006). [DOI] [PMC free article] [PubMed] [Google Scholar]
- 7.Rancati G et al. Aneuploidy underlies rapid adaptive evolution of yeast cells deprived of a conserved cytokinesis motor. Cell 135, 879–893 (2008). [DOI] [PMC free article] [PubMed] [Google Scholar]
- 8.Yona AH et al. Chromosomal duplication is a transient evolutionary solution to stress. Proc. Natl. Acad. Sci. U.S.A 109, 21010–21015 (2012). [DOI] [PMC free article] [PubMed] [Google Scholar]
- 9.Duncan AW et al. Aneuploidy as a mechanism for stress-induced liver adaptation. J. Clin. Invest 122, 3307–3315 (2012). [DOI] [PMC free article] [PubMed] [Google Scholar]
- 10.Sunshine AB et al. The fitness consequences of aneuploidy are driven by condition-dependent gene effects. PLoS Biol. 13, e1002155 (2015). [DOI] [PMC free article] [PubMed] [Google Scholar]
- 11.Zhu J, Tsai H-J, Gordon MR & Li R Cellular Stress Associated with Aneuploidy. Dev. Cell 44, 420–431 (2018). [DOI] [PMC free article] [PubMed] [Google Scholar]
- 12.Torres EM et al. Identification of aneuploidy-tolerating mutations. Cell 143, 71–83 (2010). [DOI] [PMC free article] [PubMed] [Google Scholar]
- 13.Sheltzer JM, Torres EM, Dunham MJ & Amon A Transcriptional consequences of aneuploidy. Proc. Natl. Acad. Sci. U.S.A 109, 12644–12649 (2012). [DOI] [PMC free article] [PubMed] [Google Scholar]
- 14.Oromendia AB, Dodgson SE & Amon A Aneuploidy causes proteotoxic stress in yeast. Genes Dev. 26, 2696–2708 (2012). [DOI] [PMC free article] [PubMed] [Google Scholar]
- 15.Sheltzer JM A transcriptional and metabolic signature of primary aneuploidy is present in chromosomally unstable cancer cells and informs clinical prognosis. Cancer Res. 73, 6401–6412 (2013). [DOI] [PMC free article] [PubMed] [Google Scholar]
- 16.Stingele S et al. Global analysis of genome, transcriptome and proteome reveals the response to aneuploidy in human cells. Mol. Syst. Biol 8, 246 (2012). [DOI] [PMC free article] [PubMed] [Google Scholar]
- 17.Dürrbaum M et al. Unique features of the transcriptional response to model aneuploidy in human cells. BMC Genomics 15, 139 (2014). [DOI] [PMC free article] [PubMed] [Google Scholar]
- 18.Ohashi A et al. Aneuploidy generates proteotoxic stress and DNA damage concurrently with p53-mediated post-mitotic apoptosis in SAC-impaired cells. Nat Commun 6, 7668 (2015). [DOI] [PMC free article] [PubMed] [Google Scholar]
- 19.Santaguida S, Vasile E, White E & Amon A Aneuploidy-induced cellular stresses limit autophagic degradation. Genes Dev. 29, 2010–2021 (2015). [DOI] [PMC free article] [PubMed] [Google Scholar]
- 20.Dodgson SE et al. Chromosome-Specific and Global Effects of Aneuploidy in Saccharomyces cerevisiae. Genetics 202, 1395–1409 (2016). [DOI] [PMC free article] [PubMed] [Google Scholar]
- 21.Gasch AP et al. Genomic Expression Programs in the Response of Yeast Cells to Environmental Changes. Molecular Biology of the Cell 11, 4241–4257 (2000). [DOI] [PMC free article] [PubMed] [Google Scholar]
- 22.Hohmann S Osmotic Stress Signaling and Osmoadaptation in Yeasts. Microbiology and Molecular Biology Reviews 66, 300–372 (2002). [DOI] [PMC free article] [PubMed] [Google Scholar]
- 23.Davenport KR, Sohaskey M, Kamada Y, Levin DE & Gustin MC A second osmosensing signal transduction pathway in yeast. Hypotonic shock activates the PKC1 protein kinase-regulated cell integrity pathway. J. Biol. Chem 270, 30157–30161 (1995). [DOI] [PubMed] [Google Scholar]
- 24.Basu R, Munteanu EL & Chang F Role of turgor pressure in endocytosis in fission yeast. Molecular Biology of the Cell 25, 679–687 (2014). [DOI] [PMC free article] [PubMed] [Google Scholar]
- 25.Zwiewka M, Nodzyński T, Robert S, Vanneste S & Friml J Osmotic Stress Modulates the Balance between Exocytosis and Clathrin-Mediated Endocytosis in Arabidopsis thaliana. Mol Plant 8, 1175–1187 (2015). [DOI] [PubMed] [Google Scholar]
- 26.Nikko E & Pelham HRB Arrestin-mediated endocytosis of yeast plasma membrane transporters. Traffic 10, 1856–1867 (2009). [DOI] [PMC free article] [PubMed] [Google Scholar]
- 27.Lin CH, MacGurn JA, Chu T, Stefan CJ & Emr SD Arrestin-related ubiquitin-ligase adaptors regulate endocytosis and protein turnover at the cell surface. Cell 135, 714–725 (2008). [DOI] [PubMed] [Google Scholar]
- 28.Zielinski DC et al. Systems biology analysis of drivers underlying hallmarks of cancer cell metabolism. Sci Rep 7, 41241 (2017). [DOI] [PMC free article] [PubMed] [Google Scholar]
- 29.Polo S Signaling-mediated control of ubiquitin ligases in endocytosis. BMC Biol. 10, 25 (2012). [DOI] [PMC free article] [PubMed] [Google Scholar]
- 30.Dolfi SC et al. The metabolic demands of cancer cells are coupled to their size and protein synthesis rates. Cancer Metab 1, 20 (2013). [DOI] [PMC free article] [PubMed] [Google Scholar]
Associated Data
This section collects any data citations, data availability statements, or supplementary materials included in this article.
Supplementary Materials
Data Availability Statement
Experimental data, genomics analysis pipeline and mathematical model details supporting the findings of this study are provided in the Supplementary Information, Source data files for each figure, and public data repository (https://github.com/RongLiLab/Tsai-et-al.−2019). All data are available from the authors on reasonable request. The accession number for the whole genome sequencing and transcriptome data in this paper are SRP126434 and GSE107997, respectively.


