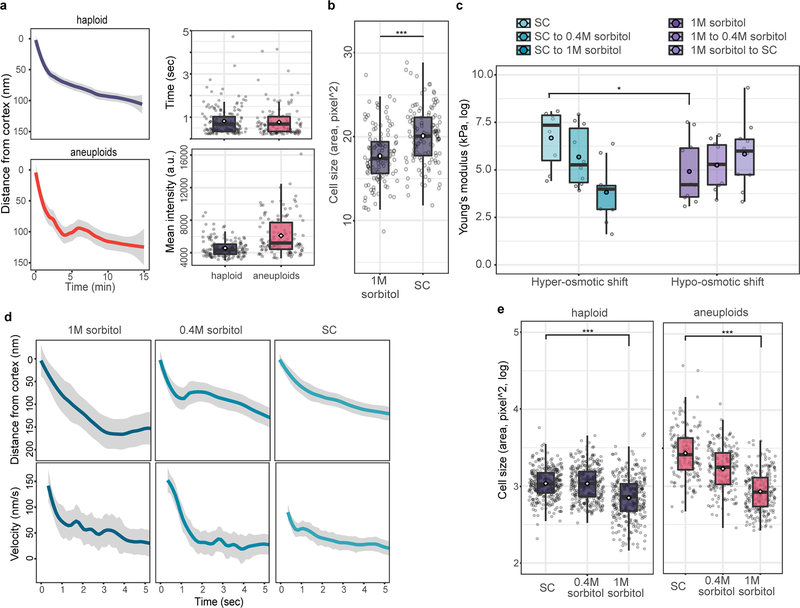
Extended Data Figure 7 |. Additional data showing hypo-osmotic stress leads to increased cell size and endocytic slowdown in both haploid and aneuploid cells.
a. Left panels: average distance that Abp1 traveled away from cell cortex under acute exposure to medium containing 0.4M sorbitol (grey ribbon: 95% confidence intervals; haploids: n = 150; aneuploids: n = 136). No significant difference in the distance travelled inwardly by Abp1 patches was observed between haploid cells (top) and aneuploid cells (bottom) in this hyper-osmotic environment (Tukey contrasts on GLM, multiple testing corrected p-value = 0.0968). Right panels: Duration (top) and abundance (mean intensity of GFP signal, bottom) of Abp1 at endocytic patches under acute treatment of 0.4M sorbitol were measured comparing aneuploid and haploid cells. Duration of Abp1 at cortex between haploid and aneuploid cells were similar, while abundance of Abp1 right before inward traverse between two group remained different (for duration, haploid: n=144; aneuploid: n=169, p-value = 0.731; for abundance, haploid: n=140; aneuploid: n=121, p-value = 3.106e-10, one-tailed t test). b. Haploid cells experiencing hypo-osmotic stress (20 min after shifting from growth medium (SC) containing 1M sorbitol to SC without sorbitol) displayed increased cell size compared to cells continuously growing in medium with 1M sorbitol (n = 120 in both sets; one-tailed t test, p-value = 3.437e-08). c. Cell surface stiffness (Y-axis) was measured with AFM in haploid cells under hyper- (left panel) and hypo-osmotic (right panel) shock within 30 minutes of osmotic shift. Boxplots show that cell stiffness was significantly different between cells growing in normal (SC) and hyper-osmotic (1M sorbitol) environments (p-value= 0.028, one-tailed t test; sample size (n) and data in Source data), and trended downward or upward after a hyper- or hypo-osmotic shift, respectively. d. Average distance traveled and velocity (centre) of Abp1 from cell cortex (Y-axis, ribbon: 95% CI) was monitored over time (X-axis) when haploid cells were exposed to hypo-osmotic shock as in (a). When cells were transferred from high (1M sorbitol) to low (SC) osmolarity environment, average distance traveled and velocity became shorter (Tukey contrasts on GLM, 1M sorbitol to SC: p-value = 0.00783) and slower (Tukey contrasts on GLM, 1M sorbitol to SC: p-value = 0.0134), respectively (see Source data for sample size (n)). e. Cell size decreases in haploid and aneuploid cells exposed to hyper-osmotic stress. Cells in haploid (left panel) and aneuploid populations (right panel) significantly reduced in size after being shifted from SC to medium with 1M sorbitol, compared to those grown continuously in SC medium (for haploids, n= 300 and 321; one-tailed t test, p-value < 2.2e-16; for aneuploids, n= 151 and 237; one-tailed t test, p-value < 2.2e-16). Data (a-e) and exact p-values in Source data; boxplots (a-c and e) are defined as in Fig. 2.

