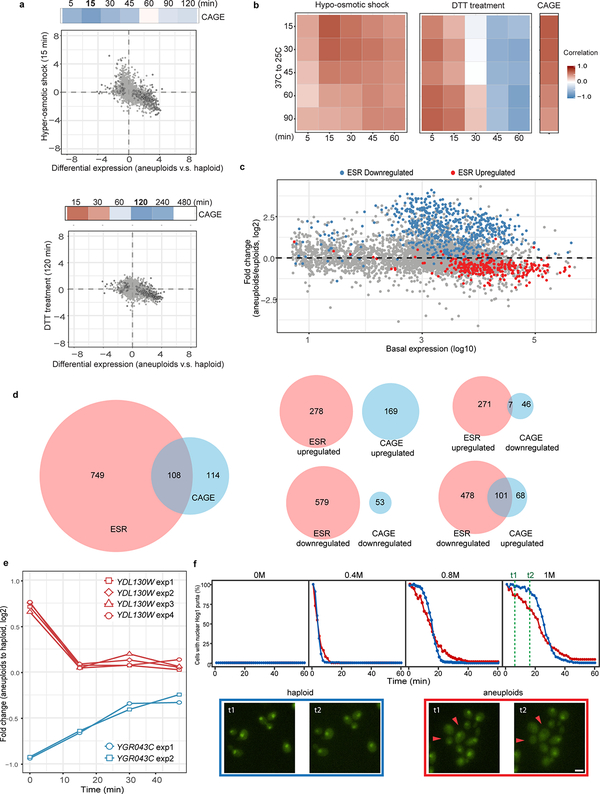
Extended Data Figure 2 |. Comparisons of gene expression patterns between CAGE and several stress responses.
a. Top panel: Heat map showing negative correlation between CAGE and gene expression changes of cells exposed to hyper-osmotic shock for different time periods. Color gradient is the same as described in Fig 1b. Scatter plot: Genome-wide and CAGE correlation of gene expression patterns between aneuploid population (x-axis) and cells exposed to hyper-osmotic stress for 15 min (y-axis). Color scheme is the same as describe in Fig. 1c; Correlation scores from the Spearman’s rank correlation test and exact p-value are in Supplementary Table 2; sample size (n) is documented in Source data Fig. 1. Bottom panel: figure presentations are as described in top panel, but the correlation between CAGE and long term DTT treatment (120 min). b. Heat map showing positive correlation of gene expression changes in cells experiencing temperature down-shift (37 °C to 25 °C) with those in cells experiencing hypo-osmotic shock (left), short-term DTT treatment (middle) or with CAGE (right). Correlation test and scores are described as previously (a); sample size (n) is documented in Source data. c. The same MA plot as shown in Extended Data Fig. 1d with labels of ESR genes (n=857)21. Red and blue dots indicate up-regulated or down-regulated ESR genes, respectively, when cells were exposed to stress. d. Venn diagrams showing common genes between CAGE and ESR (left). No overlapping genes between up-regulated genes in CAGE and ESR were found, and the same is true for down-regulated genes in CAGE and ESR; whereas there are some overlaps between oppositely regulated CAGE and ESR genes. e. RT-qPCR monitoring expression changes of two CAGE genes that are also significantly differentially expressed under hypo- and hyper-osmotic shock21 in a heterogeneous aneuploid population exposed to hyper-osmotic shock (0 to 1M sorbitol). Multiple primer sets targeting each gene were used. Y-axis indicates the ratio of gene expression between aneuploids and haploid (CAGE signature) over time immediately after cells were shifted to medium with 1M sorbitol (x-axis). Note that one of the genes was upregulated (blue) in CAGE while the other was downregulated (red). Plots show that these changes were alleviated by hyper-osmotic shock. f. Top panel: percentage of cells with nuclear-localized Hog1 as a function of time after different levels of acute hyper-osmotic exposure in haploid and aneuploids. Y-axis indicates the percentage of cells with nuclear-localized Hog1-GFP signal over time immediately after cells were shifted to medium with 1M sorbitol (x-axis). Bottom panel: example images (two independent experiments) from two time points (t1 and t2, labeled with green lines at top panel) in haploid and aneuploid cells (n=287 and 254; see Source data for full information of sample size). Red arrows indicated diminished nuclear localized Hog1. Note that Hog1 import occurred fast such that even at the first time point of measurement after osmotic shock most cells already displayed nuclear Hog1.

