

Abstract
Congenital scoliosis (CS) is the result of anomalous vertebrae development, but the pathogenesis of CS remains unclear. Long non‐coding RNAs (lncRNAs) have been implicated in embryo development, but their role in CS remains unknown. In this study, we investigated the role and mechanisms of a specific lncRNA, SULT1C2A, in somitogenesis in a rat model of vitamin A deficiency (VAD)‐induced CS. Bioinformatics analysis and quantitative real‐time PCR (qRT‐PCR) indicated that SULT1C2A expression was down‐regulated in VAD group, accompanied by increased expression of rno‐miR‐466c‐5p but decreased expression of Foxo4 and somitogenesis‐related genes such as Pax1, Nkx3‐2 and Sox9 on gestational day (GD) 9. Luciferase reporter and small interfering RNA (siRNA) assays showed that SULT1C2A functioned as a competing endogenous RNA to inhibit rno‐miR‐466c‐5p expression by direct binding, and rno‐miR‐466c‐5p inhibited Foxo4 expression by binding to its 3′ untranslated region (UTR). The spatiotemporal expression of SULT1C2A, rno‐miR‐466c‐5p and Foxo4 axis was dynamically altered on GDs 3, 8, 11, 15 and 21 as detected by qRT‐PCR and northern blot analyses, with parallel changes in Protein kinase B (AKT) phosphorylation and PI3K expression. Taken together, our findings indicate that SULT1C2A enhanced Foxo4 expression by negatively modulating rno‐miR‐466c‐5p expression via the PI3K‐ATK signalling pathway in the rat model of VAD‐CS. Thus, SULT1C2A may be a potential target for treating CS.
Keywords: congenital scoliosis (CS), Foxo4, PI3K‐AKT, rno‐miR‐466c‐5p, somitogenesis, SULT1C2A
1. INTRODUCTION
Congenital scoliosis (CS) is a three‐dimensional deformity of the spine caused by congenitally anomalous vertebrae development. The incidence of CS is approximately 0.5 to 1 per 1000 live births,1, 2 and increasing evidence shows that CS is caused by both genetic abnormalities as well as maternal exposure to medications or toxins.3, 4 Abnormalities in the developmental milieu during embryo somitogenesis may disrupt the cartilaginous spine, consequently resulting in vertebrae malformations.5, 6 Vitamin A deficiency (VAD) during pregnancy can induce CS in postnatal rats. In addition, changes in the retinoic acid (RA) pathway can affect somitogenesis,7 possibly because RAs control the development of the segmental structure of the vertebrate body during embryogenesis.8, 9, 10 Retinoic acid is a metabolite of vitamin A (retinol) that mediates the critical functions of vitamin A in growth and development. However, the mechanisms underlying VAD‐induced CS remain unclear.
MicroRNAs (miRNAs) are small non‐coding RNAs (ncRNAs) that inhibit or degrade mRNAs by binding to the 3ʹ untranslated region (UTR) of mRNAs. Long non‐coding RNAs (lncRNAs) are non‐protein coding transcripts of >200 nucleotides that modulate many physiological and pathological biological functions via epigenetic regulation and interaction with miRNAs, proteins or mRNAs.11 Long non‐coding RNAs can act as competing endogenous RNAs (ceRNAs) to inhibit miRNA activity by sequestering miRNA, thereby reducing the expression of its target genes.12, 13, 14 Recently, lncRNAs were found to play an important role in embryo development.15, 16 However, the role of lncRNAs in somitogenesis remains largely unclear.
Zhang et al reported that miRNA‐145‐5p (miR‐145) and β‐catenin mRNA (CTNNB1) are overexpressed in adolescent idiopathic scoliosis (AIS) bone tissues and primary osteoblasts, and such aberrant miRNA expression has been shown to influence osteocyte function.17 A lncRNA known as lncAIS, for its involvement in the pathogenesis of AIS, has been reported to suppress the osteogenic differentiation of mesenchymal stem cells (MSCs). Specifically, lncAIS impacts the function of NF90 and HOXD8 and hinders RUNX2 transcription.18 Previously, we performed sequencing data analysis to build ceRNA networks in embryonic tissues of rats with VAD‐induced CS and found that, based on Kyoto Encyclopedia of Genes and Genomes (KEGG) pathway analysis, a SULT1C2A‐rno‐miR‐466c‐5p‐Foxo4 axis as well as the Phosphoinositide 3 kinases (PI3K)‐AKT pathway appear to be involved in CS pathogenesis based on bioinformatics prediction and sequence analysis.19
In the present study, we aimed to confirm the expression of the lncRNA SULT1C2A in a rat model of VAD‐induced CS and to explore the molecular mechanism of the SULT1C2A‐rno‐miR‐466c‐5p‐Foxo4 axis in CS. This study of the effect of ceRNA dysregulation within the pathogenesis of VAD‐CS provides insight into the mechanisms of somitogenesis and suggests that SULT1C2A may be a potential target for treating CS.
2. MATERIALS AND METHODS
2.1. Rat model of VAD‐induced CS
Sprague‐Dawley rats (20 weeks old, weighing 200‐230 g) were obtained from SPF Biotechnology Co., Ltd (Beijing, China). The Institutional Animal Welfare Committee of the Peking Union Medical College Hospital and the Laboratory Animal Center of Army General Hospital approved this study (protocol no. SYXK 2014‐0037), and all experimental procedures were performed in accordance with the national guideline for animal care. All rats were housed with five rats per cage at room temperature (21‐23°C) with 60%‐70% humidity and a 12‐hour light/dark cycle. Rats had free access to standard water and rat chow.
The rat model of VAD‐induced CS was created as described previously.7 Briefly, female rats (n = 96) were randomly assigned to either the VAD group (n = 48), which received a modified AIN‐93G diet without any vitamin A source (Research Diets, New Brunswick, NJ) or the control group (CON, n = 48), which received an AIN‐93G diet with adequate vitamin A (4 retinol equivalents (RE)/g diet). Vitamin A deficiency was detected and confirmed in the VAD group after the rats were fed the VAD diet for more than 2 weeks as described previously.7, 20 The female rats were then mated with normal male rats at 6‐10 pm and continuously received the same diet during gestation.21
2.2. Tissue collection
Embryos were collected from six to eight pregnant rats of the CON and VAD groups on gestational days (GDs) 3, 8, 9, 11, 15 and 21.
2.3. Bioinformatics analysis
RNAhybrid was used to predict the miRNA‐binding sites on SULT1C2A (https://bibiserv.cebitec.uni-bielefeld.de/rnahybrid/). The targets for rno‐miR‐466c‐5p were predicted using TargetScan (www.targetscan.org/). The sequence of lncRNA SULT1C2A was downloaded from a lncRNA database (www.lncrnadb.org/), and the sequences of rno‐miR‐466c‐5p were downloaded from the miRBase (www.mirbase.org/). Information regarding protein interactions and the correlation between Foxo4 and AKT1 was obtained from the STRING database (https://string-db.org/).
2.4. Co‐expression network construction
A co‐expression network was constructed to identify interactions among mRNAs and lncRNAs as described previously.19 A weighted gene co‐expression network analysis (WGCNA) was performed to identify the associations between mRNAs and lncRNAs according to the calculated Pearson correlation coefficients. The gene encoding lncRNA SULT1C2A (length 1828 bp) is located on chromosome 9 (4621424‐4624425 [+] strand) in intron 4 of Sult1c2a.
2.5. Cell culture
HEK‐293T and H9C2 cells were maintained in high glucose DMEM (Gibco, New York, NY) added 10% foetal bovine serum (Gibco). All cells were cultured in a 5% CO2 humidified atmosphere at 37°C. The medium was exchanged daily, and cells were passaged every 3 days using 0.25% trypsin.
2.6. Cell transfection and reagents
For analysis of SULT1C2A expression, a small interfering (si)RNA against SULT1C2A (for the siRNA lnc group) and negative control oligonucleotides (for the negative control [NC] group) were synthesized by RiboBio Co., Ltd. (Guangzhou, China). For analysis of SULT1C2A‐related miRNA expression, a rno‐miR‐466c‐5p mimic (for the rno‐miR‐466c‐5p group) and scrambled oligonucleotides (for the miR‐NC group) were also synthesized by RiboBio Co., Ltd. For further analysis, the recombinant plasmids pmirGLO‐SULT1C2A‐wt1, wt2/pmirGLO‐SULT1C2A‐mt and pmirGLO‐Foxo4‐wt/pmirGLO‐Foxo4‐mt were prepared. LipofectamineTM 3000 (Invitrogen, Carlsbad, CA) was used as the transfection reagent according to the manufacturer's instructions.
2.7. Quantitative real‐time PCR
Total RNA was extracted from tissues using TRIzol reagent (Invitrogen, USA), according to the manufacturer's instructions. cDNAs were reverse transcribed using a First Strand cDNA Synthesis Kit (Qiagen, Germany). Then, quantitative real‐time PCR (qRT‐PCR) was performed on an ABI SYBR®Green PCR Master Mix (Applied Biosystems, Foster City, CA). Glyceraldehyde‐3‐Phosphate Dehydrogenase (GAPDH) was used as the reference gene. siRNA‐SULT1C2A (GCTCATGCAACCTTCCTCA) and NC‐siRNA‐SULT1C2A (TTCTCCGAACGTGTCACGT) were used to evaluate the expression ratio of SULT1C2A. For qRT‐PCR analysis of rno‐miR‐466c‐5p expression, U6 small nuclear RNA (U6 snRNA) was used as an endogenous control. In addition, melting curves were used to evaluate non‐specific amplification. The primer sequences used in this study are listed in Table 1. Relative expression levels were determined using the 2−ΔΔCt method.
Table 1.
Sequences of primers used for qRT‐PCR analysis
| Gene | Primer sequence (5′‐3′) |
|---|---|
| SULT1C2A‐F | TGGCCCAGAATGAGAGGTTTGATGA |
| SULT1C2A‐R | CGGTGTCACAGTCCTTGGCATTTAC |
| Foxo4‐F | GGCGGCAAGGGTGGCAAGG |
| Foxo4‐R | CCGGCCTCATTGGGGACAGC |
| Pax1‐F | CAATGCCATCCGCCTACGAAT |
| Pax1‐R | AGAGACCCGCAGTTGCCTA |
| Nkx3‐2‐F | AGCGCCGCTTTAACCATCA |
| Nkx3‐2‐R | GCGTTTGGTCTTGTAGCGAC |
| Sox9‐F | AGTACCCGCATCTGCACAAC |
| Sox9‐R | ACGAAGGGTCTCTTCTCGCT |
| GAPDH‐F | TGGGGTGATGCTGGTGCTGAGTAT |
| GAPDH‐R | AGCGGAAGGGGCGGAGATGAT |
| rno‐miR‐466c‐5p‐F | TGTGATGTGTGTATGTAC |
| U6‐F | CTCGCTTCGGCAGCACA |
2.8. Luciferase reporter assay
The target genes of SULT1C2A were predicted using a bioinformatics prediction program (miRcode and TargetScan program). PCR was performed to obtain the wild‐type SULT1C2A sequence (SULT1C2A‐wt1 and ‐wt2) and the wild‐type 3′‐UTR of Foxo4 mRNA (Foxo4‐wt). A mutant SULT1C2A (SULT1C2A‐mt) without rno‐miR‐466c‐5p binding sites and mutant Foxo4 3′‐UTR (Foxo4‐mt) fragments were obtained by overlapping extension PCR with the mutant primers. The fragments, including the predicted binding sites, were cloned into a pmirGLO vector to create pmirGLO‐SULT1C2A‐wt1, pmirGLO‐SULT1C2A‐wt2 and pmirGLO‐SULT1C2A‐mt plasmids. The luciferase reporter assay was performed by cotransfection of HEK 293T cells with recombinant plasmids with rno‐miR‐466c‐5p mimics or NC plasmids using LipofectamineTM 3000. Meanwhile, H9C2 cells were transiently cotransfected with recombinant plasmids with rno‐miR‐466c‐5p mimics or siRNA lnc SULT1C2A. Luciferase activity was measured 24 hours post‐transfection with the Dual‐Luciferase Reporter Assay System (Promega, Madison, WI) according to the manufacturer's instructions. Renilla luciferase activity was normalized to firefly luciferase activity.
2.9. Northern blot analysis
For all miRNA samples, 20 μg of total RNA was analysed on a 17% denaturing polyacrylamide‐urea gel. mRNAs and lncRNAs were analysed on a 1.2% agarose gel in 1× MOPS solution containing 1% formaldehyde. RNAs were separated by electrophoresis and transferred onto a Hyoid‐N+ nylon membrane (Habersham, Freiburg, Germany). The membranes were incubated with hydration buffer containing probes in the labelling reaction system (20 mL) containing 2 mL 10× T4 PNK ligase buffer and 1 mL T4 poly nucleotide kinase (NEB, Ipswich, MA) and 2.5 mL γ‐[32P]‐ATP. Membranes were pre‐hybridized in the hybridization buffer at 65°C for 1 hour and hybridized overnight at 65°C. The membranes were then exposed to the phosphor imager screen for at least 12 hours.
2.10. Western blot analysis
For western blot analysis of protein expression, cells were lysed in radioimmunoprecipitation assay (RIPA) buffer (Sigma‐Aldrich, St. Louis, MO) containing a complete protease inhibitor cocktail (Roche, Mannheim, Germany). Proteins were separated by SDS‐PAGE and electroblotted onto polyvinylidene difluoride (PVDF) membranes. The membranes were incubated with antibodies against AKT (Affinity Biosciences, Cincinnati, OH), phosphorylated (p)‐AKT (Affinity Biosciences), PI 3 kinase p85 alpha (Abclonal, Wuhan, China) and β‐actin (Sigma‐Aldrich). Chemiluminescence was induced by the Super‐Signal West Dura Substrate (Pierce, Rockford, IL), and the images were acquired on an LAS‐3000 (Fujifilm Life Sciences, Tokyo, Japan). Staining intensity was quantified using Multi Gauge software (Fujifilm Life Sciences).
2.11. Statistical analysis
spss 19.0 software (SPSS, Inc, Chicago, IL) was used for all statistical analyses. Data are expressed as the mean ± SD. The Student's t test and one‐way ANOVA followed by Tukey's multiple comparison test were used to compare differences among samples. Correlations between SULT1C2A, Foxo4 and rno‐miR‐466c‐5p expression were examined using Pearson's correlation analysis. P < 0.05 was considered statistically significant.
3. RESULTS
3.1. SULT1C2A expression is down‐regulated in embryonic tissues of rats with VAD on GD 9
Gene co‐expression networks were used to identify potential interactions among different transcripts in embryos from rats with VAD, and co‐expression modules with a high rate of protein‐coding RNAs were selected. SULT1C2A (NONRATG027649.1) was associated with many somitogenesis‐related genes, such as Foxo4, Bhlha15, Trim55 and Fads6. Thus, we identified a novel lncRNA‐miRNA‐mRNA regulatory network, the SULT1C2A‐rno‐miR‐466c‐5p‐Foxo4 axis in VAD.
We then measured the expression of SULT1C2A, rno‐miR‐466c‐5p and Foxo4 in embryonic tissues of the VAD and CON groups on GD 9. The Foxo4 and SULT1C2A expression levels were significantly lower in the VAD group than the CON group (Figure 1A‐C).
Figure 1.
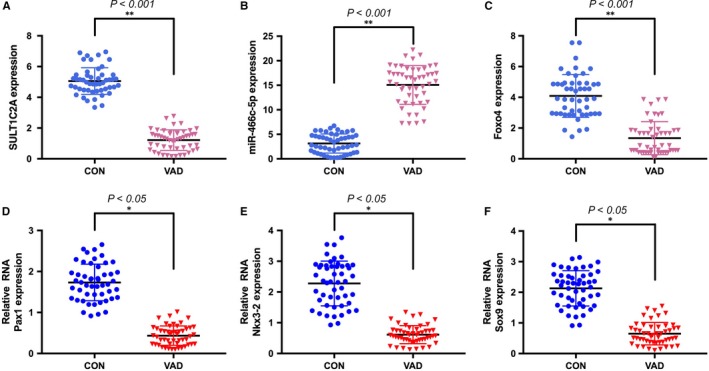
Expression of long non‐coding RNA SULT1C2A, miR‐466c‐5p and Foxo4 in rat embryos on GD 9. (A,C) quantitative real‐time PCR results showing that relative expression levels of SULT1C2A and Foxo4 expression were significantly lower in the vitamin A deficiency (VAD) group than in the control (CON) group. B, The relative expression level of miR‐466c‐5p was significantly increased in the VAD group compared with the CON group. (D‐F) The relative expression levels of Pax1, Nkx3‐2 and Sox9 were lower in rat embryos of the VAD group compared with those of the CON group. (*P < 0.05, **P < 0.001, n = 50 for each group). All experiments were independently repeated three times
3.2. Somitogenesis is reduced in embryonic tissues of the VAD group on GD 9
We next measured the expression of somitogenesis‐associated genes in embryonic tissues from rats with VAD at GD 9. The mRNA levels of Pax1, Nkx3‐2 and Sox9 were significantly lower in the embryos of the VAD group compared with the CON group (Figure 1D‐F).
3.3. SULT1C2A directly binds to rno‐miR‐466c‐5p
Sequence analysis and bioinformatics analysis predicted two putative binding sites between SULT1C2A and rno‐miR‐466c‐5p (Figure 2A,B). Luciferase reporter assays showed that rno‐miR‐466c‐5p mimics reduced the luciferase activity in cells transfected with pmirGLO‐SULT1C2A‐wt2, but not with pmirGLO‐SULT1C2A‐wt1 or pmirGLO‐SULT1C2A‐mt (Figure 2D,E).
Figure 2.
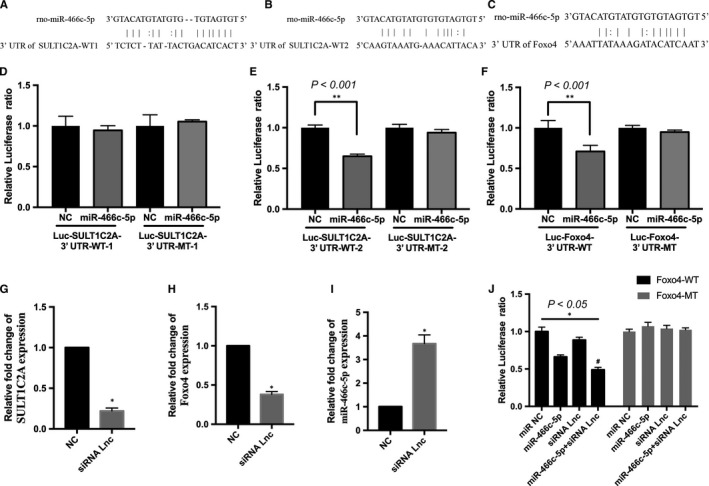
Luciferase reporter assays showed direct interaction between SULT1C2A and miR‐466c‐5p as well as between miR‐466c‐5p and Foxo4. (A,B) Putative binding sites between SULT1C2A‐wt1 and ‐wt2 and miR‐466c‐5p. C, Putative binding sites between Foxo4 and miR‐466c‐5p. (D,E) Luciferase activity in cells transfected with miR‐466c‐5p mimics and pmirGLO‐SULT1C2A‐wt1, pmirGLO‐SULT1C2A‐wt2 or their mutants. rno‐miR‐466c‐5p mimics reduced the luciferase activity in cells transfected with pmirGLO‐SULT1C2A‐wt2, but not in those transfected with pmirGLO‐SULT1C2A‐wt1 or pmirGLO‐SULT1C2A‐mt. F, rno‐miR‐466c‐5p mimics reduced the luciferase activity in cells transfected with pmirGLO‐Foxo4‐wt, but not in those transfected with pmirGLO‐Foxo4‐mt. (G‐I) The relative expression levels of SULT1C2A and Foxo4 were effectively reduced and that of rno‐miR‐466c‐5p was effectively increased in the small interfering RNA (siRNA) lnc‐transfected H9C2 cells compared with the levels in the negative control (NC)‐transfected cells. J, Treatment with the siRNA for SULT1C2A down‐regulated the expression of pmirGLO‐Foxo4‐wt but not pmirGLO‐Foxo4‐mt. (*P < 0.05, **P < 0.001, compared to the mimic NC group and # P < 0.05, compared to the miR‐466c‐5p mimic group, n = 3). All experiments were independently repeated three times
Furthermore, a siRNA against SULT1C2A was designed for transfection of H9C2 cells. According to the qRT‐PCR results, the SULT1C2A and Foxo4 levels were effectively reduced in the H9C2 cells transfected with the siRNA Lnc compared with levels in the blank and NC groups (Figure 2G,H).
3.4. rno‐miR‐466c‐5p directly binds to the Foxo4 3′‐UTR
Bioinformatics analysis using TargetScan, and miRanda indicated that Foxo4 is a potential target for rno‐miR‐466c‐5p (Figure 2C). Luciferase reporter assays showed that rno‐miR‐466c‐5p mimics reduced the luciferase activity in cells transfected with pmirGLO‐Foxo4‐wt, but not with pmirGLO‐Foxo4‐mt (Figure 2F). The qRT‐PCR results revealed that the rno‐miR‐466c‐5p level was effectively increased in H9C2 cells treated with the siRNA Lnc compared with that in the NC group (Figure 2I). In addition, transfection with rno‐miR‐466c‐5p mimics or the siRNA for SULT1C2A or cotransfection of both led to down‐regulated expression of pmirGLO‐Foxo4‐wt, but this was not observed for pmirGLO‐Foxo4‐mt (Figure 2J). These findings suggest that rno‐miR‐466c‐5p regulates Foxo4 expression by directly binding to the 3′‐UTR and also revealed that SULT1C2A functions as a ceRNA, interacting with rno‐miR‐466c‐5p.
3.5. Dynamic expression of the SULT1C2A‐rno‐miR‐466c‐5p‐Foxo4 axis members in embryos
We measured the expression of SULT1C2A, rno‐miR‐466c‐5p and Foxo4 in rat embryos on GDs 3, 8, 11, 15 and 21. SULT1C2A expression in the VAD group was significantly down‐regulated on GDs 3 and 8 but up‐regulated on GDs 11 and 15 (Figure 3A). In the VAD group, rno‐miR‐466c‐5p expression was significantly up‐regulated on GD 11, but down‐regulated on GDs 15 and 21 (Figure 3B). Compared with that in the CON group, Foxo4 expression in the VAD group was significantly down‐regulated on GDs 8 and 11 (Figure 3C).
Figure 3.
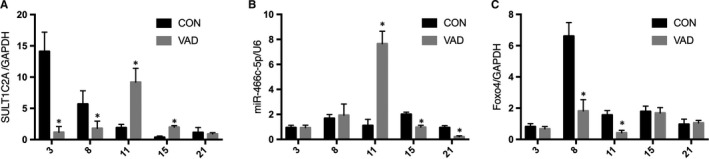
Expression profile of the SULT1C2A‐rno‐miR‐466c‐5p‐Foxo4 axis in rat embryos on gestational days (GDs) 3, 8, 11, 15 and 21. A, The relative expression level of SULT1C2A in the vitamin A deficiency (VAD) group was significantly lower on GDs 3 and 8 and significantly higher on GDs 11 and 15. B, The relative expression level of rno‐miR‐466c‐5p was significantly increased on GD 11 but decreased on GDs 15 and 21 in the VAD group. C, Compared with that in the control (CON) group, the relative expression level of Foxo4 in the VAD group was significantly lower on GDs 8, 11, 15 and 21. (*P < 0.05, n = 3). All experiments were independently repeated three times
Furthermore, northern blot analysis confirmed the dynamic expression of members of the SULT1C2A‐rno‐miR‐466c‐5p‐Foxo4 axis. In the VAD group, SULT1C2A was significantly down‐regulated on GDs 3 and 8, but up‐regulated on GDs 11 and 15 (Figure 4A). Moreover, rno‐miR‐466c‐5p expression was significantly up‐regulated on GD 11, but down‐regulated on GDs 15 and 21 (Figure 4B). Finally, Foxo4 was significantly down‐regulated on GDs 8, 11, 15 and 21 (Figure 4C).
Figure 4.
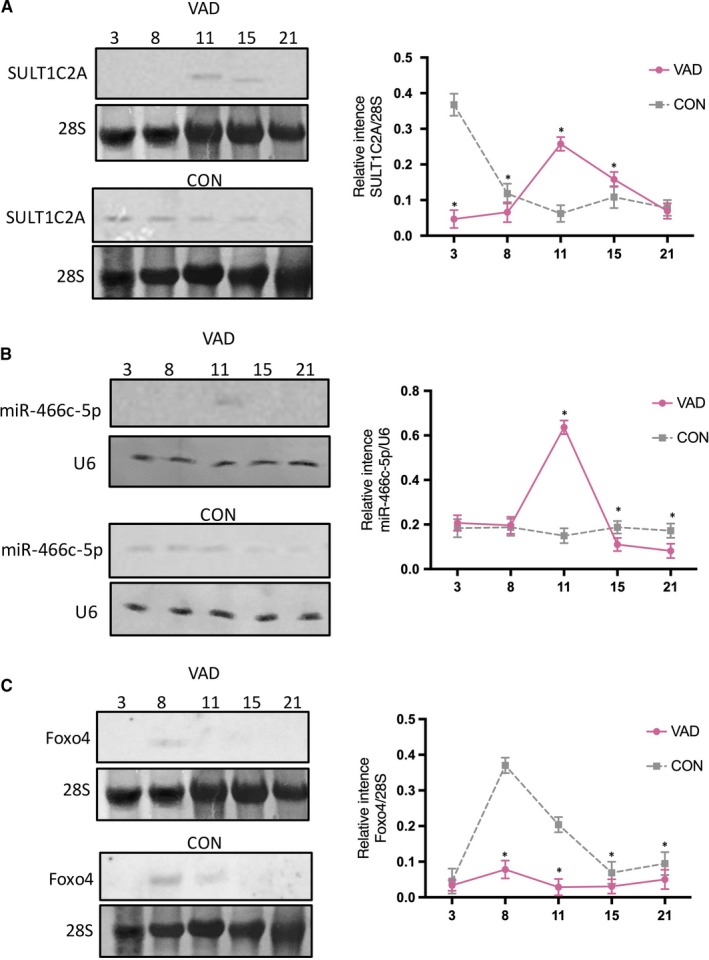
Northern blot results showing dynamic expression of the SULT1C2A‐rno‐miR‐466c‐5p‐Foxo4 axis. A, SULT1C2A expression was significantly down‐regulated in vitamin A deficiency (VAD) rat embryos on GDs 3 and 8 but up‐regulated on GD 11. B, rno‐miR‐466c‐5p expression was significantly up‐regulated in the VAD group on GD 11 but down‐regulated on GDs 15 and 21. C, Foxo4 expression was significantly down‐regulated on GDs 8, 11, 15 and 21. (*P < 0.05, n = 3). All experiments were independently repeated three times
3.6. PI3K‐AKT expression is altered in embryos of rats with VAD
From the STRING database, the protein interaction and correlation score between Foxo4 and AKT1 was 0.984,22 and as a substrate of the PI3K‐AKT pathway, we selected this interaction as the target. The AKT, p‐AKT and PI3K (p85 regulatory subunit) expression levels were measured via western blot analysis. Compared with the CON group, AKT expression was generally up‐regulated in the VAD group, but p‐AKT expression was significantly reduced on GDs 3, 8 and 11 and then increased on GD 21 in the VAD group (Figure 5A). p85 expression was significantly reduced on GD 11 but increased on GDs 3 and 8 in the VAD group (Figure 5B). Together, these data indicate that GD 11 represents a key period of VAD during somitogenesis, which is consistent with the results of qRT‐PCT and northern blotting.
Figure 5.
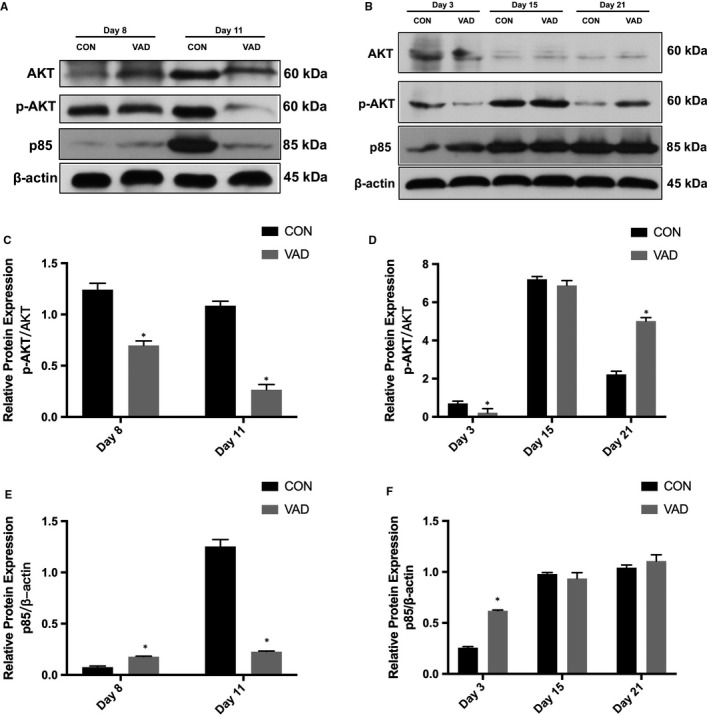
The dynamic expression of PI3K (p85), AKT and p‐AKT. A, C, E, Western blot analysis showed down‐regulation of p‐AKT in the vitamin A deficiency (VAD) group on GDs 3, 8 and 11 but up‐regulation of p‐AKT at GD 21. B, D, F, p85 expression was significantly reduced on GD 11 but increased on GDs 3 and 8 in the VAD group. (*P < 0.05, n = 3). All experiments were independently repeated three times
4. DISCUSSION
Congenital scoliosis is caused by abnormal vertebrae growth during embryogenesis, and vitamin A and RA are known to play important roles in normal physiological process. We previously found that VAD during pregnancy causes CS in postnatal rats.7 In the present study, we found a dynamic correlation between SULT1C2A, rno‐miR‐466c‐5p and Foxo4 expression in embryos from a rat model of VAD‐induced CS. Our results indicated that SULT1C2A functioned as a ceRNA by directly binding to rno‐miR‐466c‐5p, and rno‐miR‐466c‐5p regulated Foxo4 expression by directly binding to the Foxo4 3′‐UTR. Furthermore, the spatiotemporal expression of each gene was consistent with the dynamic expression of the SULT1C2A‐rno‐miR‐466c‐5p‐Foxo4 axis. Our results suggest that in CS, rno‐miR‐466c‐5p down‐regulates Foxo4 expression, and consequently reduces phosphorylation of AKT and p85 during somitogenesis on GD 11, and these effects are reversed by SULT1C2A, which competes with rno‐miR‐466c‐5p on GD 15. This investigation into the potential molecular mechanisms underlying VAD‐induced CS demonstrated dynamic changes in the expression of the SULT1C2A‐rno‐miR‐466c‐5p‐Foxo4 axis in VAD‐induced CS, suggesting that this specific axis contributes to the pathogenesis of VAD‐induced CS.
We previously identified ceRNA regulatory networks of embryonic somite development in VAD‐induced CS and found many ncRNA expression profiles, as well as associations between mRNAs and ncRNAs in CS.19 Here, we further found that SULT1C2A and Foxo4 expression levels were down‐regulated, while rno‐miR‐466c‐5p expression was up‐regulated on GD 9 in embryos of the VAD‐induced CS rat model. Furthermore, luciferase reporter assays confirmed that SULT1C2A directly targets rno‐miR‐466c‐5p and may function as a ceRNA. The assay also showed that rno‐miR‐466c‐5p inhibited Foxo4 expression by targeting the 3′‐UTR. Our findings suggest that the lncRNA SULT1C2A plays an important role in somitogenesis in VAD‐induced CS.
Foxo4, which belongs to the family of the forkhead transcription factors, is important in embryonic development 23 and plays a key role in cartilage and skeletal muscle development.24, 25, 26 Foxo transcription factors regulate many cellular processes, such as apoptosis, cell cycle and differentiation. Foxo promotes growth and development of embryos by regulating the PI3K/AKT signalling pathway.27 It has been reported that spatiotemporal expression of Foxo4, which is transcriptionally regulated by PI3K signalling, is involved in the developing brain and retina in zebrafish.28 In addition, AKT was shown to increase Foxo4 phosphorylation in response to severe dehydration.29 However, we found that the dynamic expression of p85 and p‐AKT were consistent with that of Foxo4 in embryos of the VAD group, suggesting that PI3K/AKT signalling regulates Foxo4 expression in CS.
Retinoic acid is an important modulator that promotes embryonic cell differentiation and plays an important role in vertebrate development.30 Retinoic acid is required during embryogenesis as it regulates clustering of Hox gene expression.31 In addition, RA contributes to the critical role of Foxc1a in early somitogenesis in zebrafish.32 Furthermore, RA is crucial for temporal control of embryonic development, because embryonic molecular clock genes, such as limb clock hairy2, are regulated by RA.33 The PI3K/AKT pathway was also reported to play an essential role in the process of RA‐induced cell differentiation.34 The PI3K/AKT signalling pathway was shown to also be important for the temporal control of limb development.33 In MSCs, RA promotes osteogenic differentiation by activating the PI3K/AKT signalling pathway.35 In addition, we found abnormal changes in PI3K and AKT phosphorylation in the VAD group in the present study, suggesting that the PI3K/AKT pathway is important for VAD‐induced CS.
Previous research indicated that the somite development of rat begins from GD 9 and ends on GD 16, with the fastest stage at GD 11 when approximately 21‐33 somites (from lower thoracic to sacral) are developed.36, 37 We specifically observed dynamic changes in the expression of the SULT1C2A‐rno‐miR‐466c‐5p‐Foxo4 axis over GDs 8 to 15, especially from GDs 9 to 11, suggesting that the spatiotemporal changes in the expression of the SULT1C2A‐rno‐miR‐466c‐5p‐Foxo4 axis are important for somitogenesis in VAD‐induced CS. In the VAD group, on GDs 8 and 9, lncRNA SULT1C2A and Foxo4 expression levels were decreased but miR‐466c‐5p expression was increased on GD 9. A critical point in this balance seemed to occur on GD 11 with up‐regulation of SULT1C2A to compete with the increased miR‐466c‐5p expression. On GD 15, although Foxo4 expression was increasing, the level was still lower than that in the CON group. Meanwhile, the expression of p‐AKT and p85 was consistent with the level of Foxo4 expression on GD 11. Therefore, we suggest that VAD during gestation initially reduces the expression of Foxo4, as the target, and subsequently up‐regulates miR‐466c‐5p. To maintain the relative balance of embryonic development, lncRNA SULT1C2A is up‐regulated on GD 11 and functions as a sponge to antagonize miRNAs. The dynamic changes in the expression of the SULT1C2A‐rno‐miR‐466c‐5p‐Foxo4 axis may be initiated on GD 9 and were most obvious on GD 11 during the early‐mid stage of somitogenesis (Figure 6). In addition, a dynamic profile of AKT phosphorylation, an important signalling pathway for somitogenesis, was found in the VAD group, and this novel finding warrants further research.
Figure 6.
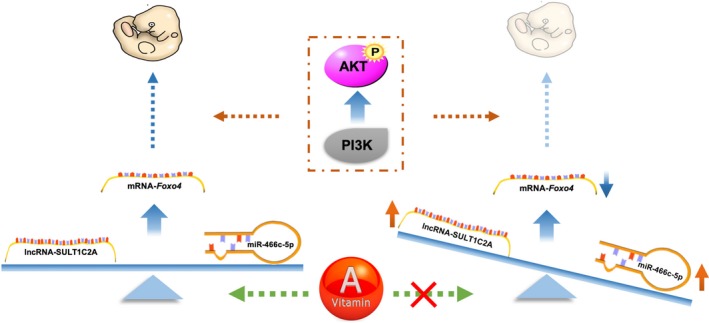
A schematic diagram of the proposed function of the lncRNA SULT1C2A‐rno‐miR‐466c‐5p‐Foxo4 axis during somitogenesis stage from GDs 9 to 11. We speculate that VAD leads to down‐regulation of Foxo4, and spatiotemporally expressed lncRNA‐SULT1C2A, as a ceRNA, binds to miR‐466c‐5p to promote Foxo4‐associated somitogenesis of the rat embryo via activation of the PI3K‐AKT signalling pathway
In conclusion, our results suggest that lncRNA SULT1C2A expression is increased in CS and that SULT1C2A functions as a ceRNA to spatiotemporally regulate Foxo4 expression by targeting rno‐miR‐466c‐5p and regulating the PI3K‐ATK signalling pathway.
CONFLICT OF INTEREST
The authors confirm that there is no conflict of interest.
AUTHOR CONTRIBUTIONS
Chong Chen and Jianxiong Shen contributed to research conception and designed the study. Peiyu Sun, Yang Jiao, Tianhua Rong and Youxi Lin performed the experiments. Zheng Li, Jinqian Liang, Liang Sun and Lin Li analysed the data; Chong Chen, Haining Tan and Jiaqi Bi wrote the manuscript.
ACKNOWLEDGEMENT
This work was supported by the National Natural Science Foundation of China (No.81330044 and 81772424).
Chen C, Tan H, Bi J, et al. LncRNA‐SULT1C2A regulates Foxo4 in congenital scoliosis by targeting rno‐miR‐466c‐5p through PI3K‐ATK signalling. J Cell Mol Med. 2019;23:4582–4591. 10.1111/jcmm.14355
Chong Chen, Haining Tan and Jiaqi Bi contributed equally.
Data Availability Statement: The data that support the findings of this study are available on request from the corresponding author. The data are not publicly available because of privacy or ethical restrictions.
DATA AVAILABILITY STATEMENT
The data that support the findings of this study are available on request from the corresponding author. The data are not publicly available because of privacy or ethical restrictions.
REFERENCES
- 1. McMaster MJ, Ohtsuka K. The natural history of congenital scoliosis. A study of two hundred and fifty‐one patients. J Bone Joint Surg Am. 1982;64:1128‐1147. [PubMed] [Google Scholar]
- 2. Loder RT, Urquhart A, Steen H, et al. Variability in Cobb angle measurements in children with congenital scoliosis. J Bone Joint Surg Br. 1995;77:768‐770. [PubMed] [Google Scholar]
- 3. Giampietro PF, Raggio CL, Blank RD, McCarty C, Broeckel U, Pickart MA. Clinical, genetic and environmental factors associated with congenital vertebral malformations. Mol Syndromol. 2013;4:94‐105. [DOI] [PMC free article] [PubMed] [Google Scholar]
- 4. Li Z, Yu X, Shen J. Environmental aspects of congenital scoliosis. Environ Sci Pollut Res Int. 2015;22:5751‐5755. [DOI] [PubMed] [Google Scholar]
- 5. Alexander PG, Tuan RS. Role of environmental factors in axial skeletal dysmorphogenesis. Birth Defects Res C Embryo Today. 2010;90:118‐132. [DOI] [PubMed] [Google Scholar]
- 6. Sparrow DB, Chapman G, Smith AJ, et al. A mechanism for gene‐environment interaction in the etiology of congenital scoliosis. Cell. 2012;149:295‐306. [DOI] [PubMed] [Google Scholar]
- 7. Li Z, Shen J, Wu WK, et al. Vitamin A deficiency induces congenital spinal deformities in rats. PLoS ONE. 2012;7:e46565. [DOI] [PMC free article] [PubMed] [Google Scholar]
- 8. Vermot J, Gallego Llamas J, Fraulob V, Niederreither K, Chambon P, Dolle P. Retinoic acid controls the bilateral symmetry of somite formation in the mouse embryo. Science (New York, NY). 2005;308:563‐566. [DOI] [PubMed] [Google Scholar]
- 9. Vermot J, Pourquie O. Retinoic acid coordinates somitogenesis and left‐right patterning in vertebrate embryos. Nature. 2005;435:215‐220. [DOI] [PubMed] [Google Scholar]
- 10. Vilhais‐Neto GC, Maruhashi M, Smith KT, et al. Rere controls retinoic acid signalling and somite bilateral symmetry. Nature. 2010;463:953‐957. [DOI] [PubMed] [Google Scholar]
- 11. Beermann J, Piccoli MT, Viereck J, Thum T. Non‐coding RNAs in development and disease: background, mechanisms, and therapeutic approaches. Physiol Rev. 2016;96:1297‐1325. [DOI] [PubMed] [Google Scholar]
- 12. Hansen TB, Jensen TI, Clausen BH, et al. Natural RNA circles function as efficient microRNA sponges. Nature. 2013;495:384‐388. [DOI] [PubMed] [Google Scholar]
- 13. Liang T, Zhou B, Shi L, et al. lncRNA AK017368 promotes proliferation and suppresses differentiation of myoblasts in skeletal muscle development by attenuating the function of miR‐30c. FASEB J. 2018;32:377‐389. [DOI] [PubMed] [Google Scholar]
- 14. Cong Z, Diao Y, Xu Y, et al. Long non‐coding RNA linc00665 promotes lung adenocarcinoma progression and functions as ceRNA to regulate AKR1B10‐ERK signaling by sponging miR‐98. Cell Death Dis. 2019;10:84. [DOI] [PMC free article] [PubMed] [Google Scholar]
- 15. Wu M, Zhang S, Chen X, Xu H, Li X. Expression and function of lncRNA MALAT‐1 in the embryonic development of zebrafish. Gene. 2018;680:65‐71. [DOI] [PubMed] [Google Scholar]
- 16. Percharde M, Lin CJ, Yin Y, et al. A LINE1‐nucleolin partnership regulates early development and ESC identity. Cell. 2018;174:391‐405.e19. [DOI] [PMC free article] [PubMed] [Google Scholar]
- 17. Zhang J, Chen H, Leung R, et al. Aberrant miR‐145‐5p/beta‐catenin signal impairs osteocyte function in adolescent idiopathic scoliosis. FASEB J. 2018: fj201800281. [DOI] [PubMed] [Google Scholar]
- 18. Zhuang Q, Ye B, Hui S, et al. Long noncoding RNA lncAIS downregulation in mesenchymal stem cells is implicated in the pathogenesis of adolescent idiopathic scoliosis. Cell Death Differ. 2018. 10.1038/s41418-018-0240-2. [DOI] [PMC free article] [PubMed] [Google Scholar]
- 19. Chen C, Tan H, Bi J, et al. Identification of competing endogenous RNA regulatory networks in vitamin A deficiency‐induced congenital scoliosis by transcriptome sequencing analysis. Cell Physiol Biochem. 2018;48:2134‐2146. [DOI] [PubMed] [Google Scholar]
- 20. White JC, Shankar VN, Highland M, Epstein ML, DeLuca HF, Clagett‐Dame M. Defects in embryonic hindbrain development and fetal resorption resulting from vitamin A deficiency in the rat are prevented by feeding pharmacological levels of all‐trans‐retinoic acid. Proc Natl Acad Sci USA. 1998;95:13459‐13464. [DOI] [PMC free article] [PubMed] [Google Scholar]
- 21. Azevedo PS, Minicucci MF, Chiuso‐Minicucci F, et al. Ventricular remodeling induced by tissue vitamin A deficiency in rats. Cell Physiol Biochem. 2010;26:395‐402. [DOI] [PubMed] [Google Scholar]
- 22. Szklarczyk D, Gable AL, Lyon D, et al. STRING v11: protein‐protein association networks with increased coverage, supporting functional discovery in genome‐wide experimental datasets. Nucleic Acids Res. 2019;47:D607‐D613. [DOI] [PMC free article] [PubMed] [Google Scholar]
- 23. Fenelon JC, Shaw G, Frankenberg SR, Murphy BD, Renfree MB. Embryo arrest and reactivation: potential candidates controlling embryonic diapause in the tammar wallaby and minkdagger. Biol Reprod. 2017;96:877‐894. [DOI] [PubMed] [Google Scholar]
- 24. Matsuzaki T, Alvarez‐Garcia O, Mokuda S, et al. FoxO transcription factors modulate autophagy and proteoglycan 4 in cartilage homeostasis and osteoarthritis. Sci Transl Med. 2018; 10(428): pii: eaan0746. [DOI] [PMC free article] [PubMed] [Google Scholar]
- 25. Akasaki Y, Hasegawa A, Saito M, Asahara H, Iwamoto Y, Lotz MK. Dysregulated FOXO transcription factors in articular cartilage in aging and osteoarthritis. Osteoarthritis Cartilage. 2014;22:162‐170. [DOI] [PMC free article] [PubMed] [Google Scholar]
- 26. Sanchez AM, Candau RB, Bernardi H. FoxO transcription factors: their roles in the maintenance of skeletal muscle homeostasis. Cell Mol Life Sci. 2014;71:1657‐1671. [DOI] [PMC free article] [PubMed] [Google Scholar]
- 27. Kuscu N, Celik‐Ozenci C. FOXO1, FOXO3, AND FOXO4 are differently expressed during mouse oocyte maturation and preimplantation embryo development. Gene Expr Patterns. 2015;18:16‐20. [DOI] [PubMed] [Google Scholar]
- 28. Lin SJ, Chiang MC, Shih HY, Chiang KC, Cheng YC. Spatiotemporal expression of foxo4, foxo6a, and foxo6b in the developing brain and retina are transcriptionally regulated by PI3K signaling in zebrafish. Dev Genes Evol. 2017;227:219‐230. [DOI] [PubMed] [Google Scholar]
- 29. Zhang Y, Luu BE, Storey KB. FoxO4 activity is regulated by phosphorylation and the cellular environment during dehydration in the African clawed frog, Xenopus laevis . Biochim Biophys Acta Gen Subj. 2018;1862:1721‐1728. [DOI] [PubMed] [Google Scholar]
- 30. Cunningham TJ, Duester G. Mechanisms of retinoic acid signalling and its roles in organ and limb development. Nat Rev Mol Cell Biol. 2015;16:110‐123. [DOI] [PMC free article] [PubMed] [Google Scholar]
- 31. Arcioni L, Simeone A, Guazzi S, Zappavigna V, Boncinelli E, Mavilio F. The upstream region of the human homeobox gene HOX3D is a target for regulation by retinoic acid and HOX homeoproteins. EMBO J. 1992;11:265‐277. [DOI] [PMC free article] [PubMed] [Google Scholar]
- 32. Li J, Yue Y, Dong X, et al. Zebrafish foxc1a plays a crucial role in early somitogenesis by restricting the expression of aldh1a2 directly. J Biol Chem. 2015;290:10216‐10228. [DOI] [PMC free article] [PubMed] [Google Scholar]
- 33. Sheeba CJ, Palmeirim I, Andrade RP. Retinoic acid signaling regulates embryonic clock hairy2 gene expression in the developing chick limb. Biochem Biophys Res Comm. 2012;423:889‐894. [DOI] [PubMed] [Google Scholar]
- 34. Lee Y, Lee JY, Kim MH. PI3K/Akt pathway regulates retinoic acid‐induced Hox gene expression in F9 cells. Dev Growth Differ. 2014;56:518‐525. [DOI] [PubMed] [Google Scholar]
- 35. Zhang S, Chen X, Hu Y, et al. All‐trans retinoic acid modulates Wnt3A‐induced osteogenic differentiation of mesenchymal stem cells via activating the PI3K/AKT/GSK3beta signalling pathway. Mol Cell Endocrinol. 2016;422:243‐253. [DOI] [PubMed] [Google Scholar]
- 36. Altman PL, Dittmer DS. Growth: including reproduction and morphological development. Federation of American Societies for Experimental Biology: Washington.
- 37. Landacre FL, Amstutz MM. Data on the number of somites compared with age in the white rat. Ohio J. Science. 1929 29(6). 10.1016/0020-1693(95)04942-8. [DOI] [Google Scholar]
Associated Data
This section collects any data citations, data availability statements, or supplementary materials included in this article.
Data Availability Statement
The data that support the findings of this study are available on request from the corresponding author. The data are not publicly available because of privacy or ethical restrictions.