

Association of epithelial-mesenchymal transition with the metastatic potential of disseminated cells in breast cancer was studied.
Abstract
Carcinoma cells undergo epithelial-mesenchymal transition (EMT); however, contributions of EMT heterogeneity to disease progression remain a matter of debate. Here, we addressed the EMT status of ex vivo cultured circulating and disseminated tumor cells (CTCs/DTCs) in a syngeneic mouse model of metastatic breast cancer (MBC). Epithelial-type CTCs with a restricted mesenchymal transition had the strongest lung metastases formation ability, whereas mesenchymal-type CTCs showed limited metastatic ability. EpCAM expression served as a surrogate marker to evaluate the EMT heterogeneity of clinical samples from MBC, including metastases, CTCs, and DTCs. The proportion of epithelial-type CTCs, and especially DTCs, correlated with distant metastases and poorer outcome of patients with MBC. This study fosters our understanding of EMT in metastasis and underpins heterogeneous EMT phenotypes as important parameters for tumor prognosis and treatment. We further suggest that EpCAM-dependent CTC isolation systems will underestimate CTC numbers but will quantify clinically relevant metastatic cells.
INTRODUCTION
Breast cancer mortality has decreased by 40% from 1989 to 2015, owing to the impact of early detection through screening methods and to improved therapeutic modalities (1). Stages I to III tumors involving breast and locoregional lymph nodes are characterized by comparably good overall survival rates at 5 and 10 years (100 and 72%, respectively). In contrast, stage IV metastatic breast cancer (MBC), which involves colonization of distant sites, remains a major life-threatening disease, with survival rates below 25% at 5 years. On average, 5 to 10% of patients are diagnosed with stage IV disease at initial diagnosis, but 20 to 30% of stages I to III patients will eventually progress and develop distant metastases in the course of their disease. Hence, understanding basic processes of distant metastasis formation and identifying cells of origin are of paramount importance to improve the treatment of patients and ultimately their outcome (2, 3).
Metastasis formation initiates with the delamination of a single or clusters of cancer cells from primary tumors, followed by an intravasation into the blood stream. These circulating tumor cells (CTCs) may eventually extravasate from blood vessels and disseminate to distant sites such as the lungs, liver, or bone marrow, where they are referred to as disseminated tumor cells (DTCs). In this novel environment, DTCs can remain as single cells or generate micrometastases (4), which can give rise to outcome-determining metastases (5–7).
In the clinical setting, CTC counts evaluated through the usage of the U.S. Food and Drug Administration–approved retrieval technology CELLSEARCH, which were as low as one cell per 7.5 ml of peripheral blood, correlated with poor outcomes in a large cohort of 3173 patients with stages I to III nonmetastatic breast cancer (8). Furthermore, CTC numbers correlated with disease progression and metastases formation (9–12). A formal experimental proof of the metastatic potential of MBC-derived CTCs was provided in a xenotransplantation model (13), which also demonstrated poor efficiency of metastases generation by CTCs. Intrafemural transfer of CTCs into the bone marrow of immunocompromised mice induced bone, lung, and liver metastases only in 3 of 110 cases of progressive MBC (2.7% efficiency), with a requirement for ≥1000 CTCs per injection (13). Hence, systemic tumor cells represent a source for metastases-inducing cells (MICs) but have low metastatic efficiency in current experimental models.
Phenotypic changes of subpopulations or even single tumor cells along an epithelial-mesenchymal transition (EMT) are postulated to decisively regulate their tumorigenic and metastatic functionality (3, 5, 14–20). EMT is a cellular differentiation program that is instrumental during embryonic development, which allows epithelialized cells to differentiate into mesenchymal cells and to relocate within the developing embryo (21). Carcinoma cells can recapitulate EMT to a variable degree, which equips them with increased migratory and invasive capacities, and thereby promotes initial steps of the metastatic cascade (5). A requirement for EMT, as well as its reversal mesenchymal-epithelial transition (MET), to support metastatic growth in every carcinoma type has been challenged in animal models of pancreatic and breast carcinomas (22, 23) and is under vivid debate (14, 16, 24). The two former publications disclosed a function of EMT in chemoresistance but no requirement for the EMT transcription factors (EMT-TFs) Snail and Twist for the formation of metastases (23). Lineage-tracing of breast-to-lung metastases demonstrated an epithelial origin of the metastatic cells in animal models (22). Hence, despite a substantial body of evidence in favor of EMT as a relevant switch in systemic cancer and treatment resistance (14–16), the actual contribution of EMT phenotype(s) of CTCs or DTCs to metastases formation remains incompletely described.
Typically, CTCs are enriched through selection of epithelial cells from the blood via the cell surface marker EpCAM (epithelial cell adhesion molecule). However, EpCAM expression can be lost during EMT (25), which hampers the study of subpopulations of CTCs that have potentially undergone EMT. The development of CTC enrichment protocols that are independent of EpCAM as a marker for retrieval allowed for the analysis of EMT features. On the basis of gene expression profiling, epithelial, biphenotypic epithelial-mesenchymal, and mesenchymal CTCs were isolated from blood samples of patients suffering from various carcinomas, including breast cancer (26). A mesenchymal status of CTCs was associated with poor treatment response and disease progression in MBC (22, 26, 27), demonstrating the relevance of a mesenchymal transition for therapy. However, it remains a matter of debate which phenotype of systemic cells is required for the actual induction of metastases (14, 16, 24).
In the present study, we functionally related EMT phenotypes of CTCs and DTCs with the ability to form lung metastases in a mouse model of MBC. Systemic tumor populations with a hybrid phenotype, defined as primarily epithelial with a moderate transition to mesenchymal traits (E/m-type), represented the most aggressive cells in this model. Functional findings were confirmed in a clinical cohort of patients with stages III and IV breast cancer, in which higher proportions of EpCAM+ cells among CTCs and DTCs correlated with distant metastases. The proportion of CTCs and DTCs with an epithelial phenotype, as measured by their expression of EpCAM, correlated with the occurrence of lung metastases. Furthermore, EpCAM+ DTCs predicted a poor 6-month survival and correlated with decreased overall survival. As a potential consequence, clinical modalities should consider different CTC and DTC subpopulations based on their EMT phenotype as targets for multimodal therapy to reduce treatment resistance and metastatic outgrowth.
RESULTS
EMT phenotypes of systemic cancer cells in the syngeneic 4T1 MBC mouse model
4T1 cells are 6-thioguanine (6-TG)–resistant murine MBC cells derived from a lung metastasis of the 410.4 cell line, itself a fourth transplant generation of a metastatic nodule of the syngeneic 410 tumor cell line in BALB/c mice (28, 29). 4T1 cells generate primary tumors and spontaneously metastasize to multiple distant sites following syngeneic transplantation in immunocompetent BALB/c mice and closely reproduce stage IV of human breast cancer progression. We used this model to isolate and characterize cellular intermediates of the metastatic cascade ex vivo and to analyze the impact of EMT on their functionality in vitro and in vivo. 4T1 cells were subcutaneously transplanted in the flank of BALB/c mice, and mice were sacrificed to collect the primary tumors, blood, bones, and organs for the recovery of 4T1 cells through selection with 6-TG (Fig. 1A). Epithelial and pan-carcinoma marker EpCAM, which serves as the major marker to isolate systemic cancer cells in clinical settings (12), was used to characterize the epithelial status of 4T1 cells before transplantation. Most (>85%) cells expressed EpCAM at high levels, with only a minority of cells being low or negative for EpCAM (fig. S1A).
Fig. 1. EMT phenotype and in vitro functional characteristics of systemic cancer cells in the 4T1 MBC mouse model.
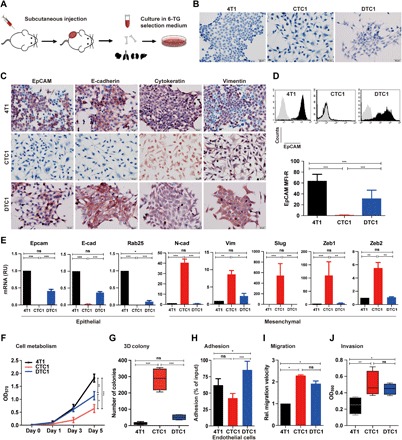
(A) Schematic representation of the experimental setup. 4T1 cells were subcutaneously transplanted in the flank of BALB/c mice. After 2 to 4 weeks, mice were sacrificed, and primary tumor, blood, bone, and organs were harvested for further culture. 4T1 tumor sublines were recovered in 6-TG–containing selection medium. (B) Morphology of 4T1, CTC1, and DTC1 lines after syngeneic transplantation and recovery from the blood (CTC1) and bone marrow (DTC1). Shown are representative pictures of each cell line. (C). IHC staining of EpCAM, E-cadherin, cytokeratin, and vimentin in 4T1, CTC1, and DTC1. Shown are representative pictures from n = 3 independent experiments. (D) EpCAM expression in 4T1, CTC1, and DTC1 was determined by flow cytometry. Top: Representative histograms with EpCAM staining in black and controls in gray. Quantification of EpCAM expression on 4T1, CTC1, and DTC1 is presented as the mean fluorescence intensity ratio (MFI-R; with SD) from n ≥ 5 independent experiments performed in unicates. One-way analysis of variance (ANOVA) with post hoc multiple testing and Bonferroni correction, ***P < 0.001. (E) mRNA transcript levels of epithelial markers, Epcam, E-cadherin (E-cad), and Rab25, and of EMT markers, N-cadherin (N-cad), vimentin, Slug, and Zeb1/2, in 4T1, CTC1, and DTC1 were assessed upon quantitative reverse transcription polymerase chain reaction with specific primers and Gusp as a house-keeping gene. Shown are means ± SD from n = 3 independent experiments performed in triplicates. One-way ANOVA with post hoc multiple testing and Bonferroni correction, *P < 0.05, **P < 0.01, and ***P < 0.001. ns, not significant; RU, relative units. (F) Cell metabolism of 4T1, CTC1, and DTC1 was assessed by MTT (3-(4,5-Dimethylthiazol-2-yl)-2,5-diphenyltetrazolium bromidefor) assay (initial cell number, 1000 cells). Shown are means with SD from n ≥ 3 independent experiments performed in triplicates. One-way ANOVA with post hoc multiple testing and Bonferroni correction, *P < 0.05, **P < 0.01, and ***P < 0.001. OD570, optical density at 570 nm. (G) 3D colony formation assay was performed with 4T1, CTC1, and DTC1 cells. Numbers of colonies are shown as boxplot whiskers graph with means from n = 4 independent experiments performed in unicates. One-way ANOVA with post hoc multiple testing and Bonferroni correction, ***P < 0.001. (H) Adhesion of 4T1, CTC1, and DTC1 cells to bEnd.3 endothelial cells was assessed. Shown are mean adhesion rate with SD from n ≥ 3 independent experiments performed in triplicates. One-way ANOVA with post hoc multiple testing and Bonferroni correction, *P < 0.05 and ***P < 0.001. (I) Migration capacity of 4T1, CTC1, and DTC1 was assessed in a scratch assay. Migration velocity is given as means (micrometers per hour) with SD from n = 3 independent experiments performed in unicates. One-way ANOVA with post hoc multiple testing and Bonferroni correction, *P < 0.05. Rel., relative. (J) The invasion capacity of 4T1, CTC1, and DTC1 cells was assessed by Transwell invasion assay. Shown are mean optical density (OD) at 590 nm quantifications of invaded cells as boxplot whiskers graph with SD from n = 3 independent experiments performed in duplicates. One-way ANOVA with post hoc multiple testing and Bonferroni correction, *P < 0.05 and **P < 0.01.
Following syngeneic transplantation (n = 5 mice), a 4T1 cell line derived from the blood (CTC1) and a 4T1 cell line derived from the bone marrow (DTC1) were stably expanded ex vivo, each from a separate mouse. CTC1 and DTC1 are adherent cell lines that were confirmed as authentic 4T1-derived cells through karyotyping and a detailed analysis of chromosomal aberrations (fig. S1B) and lacked the expression of the white blood cell (WBC) marker CD45 (fig. S1C). In addition, 4T1, CTC1, and DTC1 were resistant to 6-TG treatment, whereas murine NIH3T3 fibroblasts, as controls, only grew in the absence of 6-TG (fig. S1D).
The morphology of 4T1, CTC1, and DTC1 differed considerably. Parental 4T1 cells displayed a typical epithelial phenotype (E-type) with tight cell-cell contacts (E-type), whereas CTC1 cells displayed a mesenchymal (M-type), spindle-shaped phenotype with loss of cell-cell adhesion (Fig. 1B). DTC1 cells were characterized by a hybrid phenotype with a majority of cells that retained an epithelial phenotype and cell-cell contact, although with reduced strength as compared to 4T1 cells, and a minor subpopulation of cells with enhanced mesenchymal appearance (E/m-type; Fig. 1B). Culture of 4T1 cells in selection medium over a time period of 28 days confirmed that 6-TG had no impact on the epithelial phenotype of cells and did not induce EMT (fig. S1E).
Immunohistochemistry (IHC) staining showed that 4T1, CTC1, and DTC1 expressed epithelial marker cytokeratin and mesenchymal marker vimentin. Furthermore, 4T1 and DTC1 cells, but not CTC1 cells, expressed high levels of epithelial markers EpCAM and E-cadherin (Fig. 1C). We confirmed total loss of EpCAM expression in CTC1 cells through flow cytometry analysis. We characterized DTC1 cells by an additional population of cells with approximately 10-fold reduced expression of EpCAM and an overall 50% reduction of EpCAM expression as compared to parental 4T1 cells (Fig. 1D). mRNA levels of epithelial markers EpCAM, E-cadherin, and Rab25, as well as of mesenchymal markers N-cadherin, vimentin, Slug, Zeb1, and Zeb2, were assessed in 4T1, CTC1, and DTC1 cells. We observed a significant decrease in epithelial markers (EpCAM, E-cadherin, Rab25, and Grhl2) and a marked increase in mesenchymal makers (N-cadherin, Vimentin, Slug, Zeb1, and Zeb2) in CTC1 cells (Fig. 1E and fig. S2A). No significant differences were observed for the expression of Ddr1, ErbB2, and ErbB3, while Krt19 was up-regulated and Snail and Twist were down-regulated in CTC1 cells (fig. S2A). Measurement of mRNA levels in DTC1 reflected an overall partial loss of epithelial features, with decreased EpCAM, E-cadherin, and Rab25 levels and an increase in vimentin expression (Fig. 1E).
Mesenchymal transition in CTC1 correlates with increased migration but impaired proliferation and tumor formation capacity
We performed in vitro functional and in vivo tumorigenic assays to address the connection between EMT phenotypes and the functional behavior of 4T1-derived tumor cells. We assessed metabolism and cell numbers in cell culture after 5 days. 4T1 cells displayed the highest cell metabolism compared to DTC1 (intermediate) and CTC1 cells (lowest) (Fig. 1F), which was in line with higher cell numbers in 4T1 and lowest cell counts in CTC1, while DTC1 cells displayed intermediate counts (fig. S2B).
Two-dimensional (2D) colony formation tests every single cell in the population for its ability to undergo unlimited division. 3D soft agar colony formation tests for anchorage-independent cell growth and repression of anoikis under nonadhesive conditions. 4T1, CTC1, and DTC1 had similar capacity in 2D anchorage-dependent cell growth (fig. S2C), although with an increased average colony size for CTC1 cells, which was connected to loosened cell-cell contacts within CTC1 colonies, as compared to 4T1 and DTC1 cells (fig. S2C). Furthermore, CTC1 and DTC1 cells had strongly and slightly enhanced anchorage-independent cell growth capacity in 3D soft agar colony formation compared to parental 4T1 cells (Fig. 1G and fig. S2D). In general, 4T1 cells formed smaller and highly compacted 3D colonies with sharply defined edges, whereas CTC1 cells formed bigger colonies of less defined shape and loose edges. DTC1 cells formed intermediately sized colonies with varying edge features (fig. S2D).
Next, we assessed adhesion of 4T1, CTC1, and DTC1 cells to murine endothelial cells, matrigel, and gelatin in vitro. DTC1 cells displayed significantly higher adhesion to endothelial cells than 4T1 and CTC1 cells (Fig. 1H). In addition, we characterized CTC1 cells by reduced adhesion to matrigel and gelatin, compared to 4T1 and DTC1 cells (fig. S2E). We addressed cell migration in wound-healing experiments, demonstrating 2.3- and 1.9-fold enhanced migration of CTC1 and DTC1, respectively, as compared to parental 4T1 cells (Fig. 1I and fig. S2F). Similarly, CTC1 cells had the highest invasive capacity in a matrigel-coated Boyden chamber assay, while 4T1 cells displayed the lowest and DTC1 cells had an intermediate invasive potential (Fig. 1J and fig. S2G).
Hence, EMT observed in CTC1 cells was accompanied by reduced proliferation and adhesion, enhanced migration, anchorage-independent growth, and invasion capacity. DTC1 cells displayed overall improved capacities, with retained proliferation, enhanced adhesion, migration, invasion, and slightly higher anchorage-independent growth.
Next, we assessed the tumorigenic ability of all three cell lines in vivo through subcutaneous transplantation of identical cell numbers of 4T1, CTC1, or DTC1 cells into the flank of BALB/c mice. Tumor weights were quantified for all three cell lines in parallel after 3 weeks, and blood and bones were collected for ex vivo cultures. The average tumor weight and size were the highest in DTC1-transplanted mice (n = 8), with a 100% frequency of tumor formation (Fig. 2A and fig. S3A). Similarly, all 4T1-transplanted mice established tumors (n = 13), however, with a significantly reduced tumor weight as compared to DTC1 cells (Fig. 2A). The size of 4T1 tumors was also reduced compared to DTC1, but differences did not reach statistical significance (fig. S3A). Transplantation of CTC1 cells led to tumor formation in 7 of 17 injected mice (41.2% frequency), with reduced average tumor weight and size compared to 4T1 and DTC1 cells (Fig. 2A and fig. S3A).
Fig. 2. In vivo tumorigenicity of 4T1, CTC1, and DTC1 cells and EMT traits of DTC1-derived CTC lines.
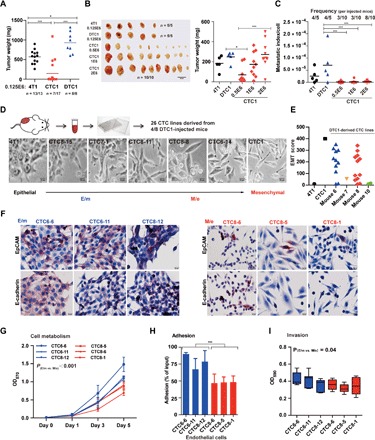
(A) 4T1, CTC1, and DTC1 (1.25 × 10⁵ cells) were transplanted subcutaneously into BALB/c mice. Dot plot shows individual and mean tumor weights for each group at the end of the experiment including numbers of transplanted mice. One-way ANOVA with post hoc multiple testing and Bonferroni correction, *P < 0.05 and ***P < 0.001. (B) 4T1 (1.25 × 10⁵ cells; n = 5), CTC1 (5 × 10⁵, 1 × 10⁶, and 2 × 10⁶ cells; each n = 10), and DTC1 (1.25 × 10⁵ cells; n = 5) were transplanted subcutaneously into BALB/c mice. Shown are pictures of primary tumors. Dot plot shows individual and mean tumor weights for each group at the end of the experiment. One-way ANOVA with post hoc multiple testing and Bonferroni correction, *P < 0.05 and ***P < 0.001. (C) Metastatic index per cell was calculated as numbers of lung metastatic colony divided by initially injected cell numbers. Dot plot shows metastatic index per cell and frequencies of lung metastasis per mouse. One-way ANOVA with post hoc multiple testing and Bonferroni correction, ***P < 0.001. (D) Schematic representation of the establishment of CTC sublines from DTC1-transplanted mice. Shown are representative pictures of CTC1-, 4T1-, and DTC1-derived CTCs displaying various degrees of EMT. (E) Dot plot shows mean EMT score grouped by mouse from n = 3 independent scoring results. 4T1 (epithelial, score 0) and CTC1 (mesenchymal, score 400) are included as controls. (F) IHC staining of EpCAM and E-cadherin in E/m-type (CTC6-6, CTC6-11, and CTC8-12) and M/e-type (CTC8-6, CTC8-5, and CTC8-1) CTCs derived from DTC1 transplantations. Shown are representative pictures from n = 3 independent staining. (G) The cell metabolism of E/m-type (CTC6-6, CTC6-11, and CTC8-12) and M/e-type (CTC8-6, CTC8-5, and CTC8-1) CTCs was assessed by MTT assay (initial cell number, 1000 cells). Shown are means with SD from n ≥ 3 independent experiments performed in triplicates. t test of E/m type versus M/e type cells is indicated. (H) Adhesion assay to bEnd.3 endothelial cells was performed with E/m-type (CTC6-6, CTC6-11, and CTC8-12) and M/e-type (CTC8-6, CTC8-5, and CTC8-1) CTCs. Shown are mean adhesion rates with SD from n ≥ 3 independent experiments performed in triplicates. t test of E/m versus M/e cells is indicated, ***P < 0.001. (I) The invasion capacity of E/m-type (CTC6-6, CTC6-11, and CTC8-12) and M/e-type (CTC8-6, CTC8-5, and CTC8-1) CTCs was detected by Transwell invasion assay. Shown are mean OD at 590 nm quantifications of invaded cells as boxplot whiskers graph with SD from n ≥ 4 independent experiments performed in duplicates. t test of E/m versus M/e cells is indicated.
We performed IHC staining of EpCAM and vimentin in primary tumors of 4T1-, CTC1-, and DTC1-transplanted mice. Primary tumors generated after transplantation of CTC1 cells remained EpCAM−, whereas primary tumors from 4T1, CTC1, and DTC1 had comparable vimentin expression levels (fig. S3B). This suggests that CTC1 cells formed primary tumors without re-expression of epithelial marker EpCAM.
The tumorigenic potential of CTC1 cells was inferior to 4T1 and DTC1 at identical numbers of injected cells (i.e., 1.25 × 10⁵; Fig. 2A). To further analyze the tumorigenic potential of CTC1 cells, we conducted subcutaneous injections with cell numbers in large excess of 4T1 and DTC1 transplantations (i.e., 5 × 10⁵, 1 × 10⁶, and 2 × 10⁶). An 8-fold and a 16-fold excess of CTC1 cells were required to reach tumor weights and sizes induced by injection of 4T1 and DTC1 cells, respectively (Fig. 2B and fig. S3C). We evaluated the metastatic potential of 4T1, CTC1, and DTC1 cells after subcutaneous injection upon colony formation from excised lungs under 6-TG selection. 4T1 and DTC1 cells generated lung metastases at equal frequency (4 of 5 mice; 80%), while CTC1 cells generated lung metastases in 3 of 10 mice after injection of 5 × 10⁵ and 1 × 10⁶ cells and in 8 of 10 mice after injection of 2 × 10⁶ cells (Fig. 2C). Average numbers of metastatic colonies after selection in 6-TG revealed the highest in DTC1-injected mice, whereas injection of 5 × 10⁵ and 1 × 10⁶ CTC1 cells resulted in low average colony numbers and in intermediate colony numbers after injection of 2 × 10⁶ cells (fig. S3D). We calculated the metastatic index per cell as numbers of lung metastatic colonies divided by the number of injected cells. The average metastatic index per cell of DTC1 was the highest with a value of 7.04 × 10⁻⁵ and was significantly higher than metastatic indexes for CTC1 cells, independent of the amounts of injected cells (1.4 × 10⁻⁶, 2.2 × 10⁻⁶, and 2.7 × 10⁻⁶, respectively). The metastatic index of 4T1 cells (2.56 × 10⁻⁵) was 9.5- to 18-fold higher than CTC1 cells (Fig. 2C). Hence, single CTC1 cells have substantially reduced tumorigenic and metastatic potential in comparison with 4T1 and DTC1 cells.
Frequencies of ex vivo cultures from the primary tumors, organs (lung, liver, kidney, and spleen), blood, and bone marrow are shown per injected mice in fig. S3 (E and F). We established one blood culture (CTC1) and one bone marrow culture (DTC1) from 4T1-injected mice. Retransplantation of CTC1 cells failed to establish any CTC or DTC subline. In contrast, subcutaneous retransplantation of DTC1 cells allowed us to establish n = 26 CTC sublines from blood in four of eight mice and to establish n = 10 DTC sublines from bone marrows of two of eight mice (fig. S3, E and F).
To address potential differences between 4T1 and DTC1 cells that might explain the increased tumorigenicity and metastatic capacity of DTC1 cells, we analyzed chromosomal aberrations in detail after karyotyping of cell lines. We determined differential aberrations between 4T1 and DTC1 with Fisher’s exact test, resulting in two categories of aberrations: (i) aberrations occurring in both cell lines but with significantly different frequencies and (ii) aberrations occurring exclusively in either cell line. A list of genes encoded in the genomic areas affected by aberrations was extracted using BioMart/Ensembl (www.ensembl.org; n = 1546 protein coding genes) and filtered for genes associated with cancer processes using a list of 419 genes deposited on the Mouse Tumor Biology Database (http://tumor.informatics.jax.org/mtbwi/index.do) and based on a census of human cancer genes (30). This resulted in a list of n = 34 genes (fig. S3G) that were used to perform a Gene Ontology (GO) term analysis using the functional annotation tool of the DAVID (Database for Annotation, Visualization, and Integrated Discovery) bioinformatics database (https://david.ncifcrf.gov/). All 34 cancer genes extracted from chromosomal breakpoints in 4T1 and DTC1 cells were compared with the 419 cancer-associated genes with the query name “Goterm:BP_DIRECT,” resulting in smaller groups with improved descriptive value (fig. S3, H and I). The breakpoint-related genes indicated in the Venn diagram were assigned to the three superordinated GO terms “cell cycle,” “signal transduction,” and “regulation of cellular response to stress” (fig. S3H). The GO term that included the highest number of genes (n = 6) was “positive regulation of ERK1 and ERK2 cascade” (fig. S3I).
DTC1-derived CTC lines display EMT heterogeneity
A total of 26 CTC lines were isolated from the blood of DTC1-transplanted mice, which were all CD45− (fig. S1C). On the basis of low numbers of tumor cells retrieved from the blood, subsequent selection with 6-TG, and observation of cell growth in a 96-well format, we concluded that CTC cell lines represented either mono- or oligoclones. DTC1-derived CTC sublines had substantial differences in morphology, potentially representing systemic tumor cells in different EMT stages. To quantify the grade of EMT in these CTC lines, we applied a scoring system implementing the percentage of mesenchymal, spindle-shaped cells (0 to 100%) and the level of cell-cell contact (1 to 4; see Materials and Methods) to obtain an EMT score ranging from 0 (epithelial, 4T1) to 400 (mesenchymal, CTC1) (fig. S4A). Figure 2D shows representative pictures of ex vivo cultured CTC sublines derived from four of eight DTC1-transplanted mice, demonstrating the phenotypic transition from epithelial to mesenchymal. EMT scores were evenly distributed and did not show any bias across CTC sublines (fig. S4B). We observed phenotypic heterogeneity from E, E/m, and M/e type (i.e., cells with a primarily mesenchymal phenotype and a subpopulation with enhanced epithelial traits) to an M type not only in CTC sublines originating from different mice but also within one mouse (Fig. 2E and fig. S4B). This demonstrates the presence of CTCs with differing EMT phenotypes in the blood of individual mice.
We selected E/m-type (CTC6-6, CTC6-11, and CTC8-12) and M/e-type (CTC8-6, CTC8-5, and CTC8-1) DTC1-derived CTC sublines along with parental 4T1, CTC1, and DTC1 cells to decipher whether EMT traits associated with differing tumorigenic abilities. We analyzed the cellular origin by karyotyping and confirmed that all cell lines were 4T1 derivatives (fig. S1B). In IHC staining, we observed a low expression of EpCAM and E-cadherin in M/e-type CTCs, with retention of EpCAM expression in a small proportion of cells. In contrast, most E/m-type CTC lines expressed high levels of EpCAM and E-cadherin protein (Fig. 2F). All selected cell lines expressed substantial amounts of vimentin (fig. S4C). mRNA transcript levels confirmed a higher expression of EpCAM, E-cadherin, and Rab25 in E/m-type CTC lines, although generally reduced as compared to parental 4T1 cells, especially for the case of Rab25 (fig. S4D). Ddr1, Grhl2, and Krt19 expression was similar to both CTC phenotypic subtypes (fig. S4D). mRNA transcript levels of the EMT-related genes vimentin, Slug, and Zeb2 were significantly higher in the M/e subtype of CTCs, while N-cadherin, Zeb1, ErbB2, ErbB3, Snail, and Twist did not show significant differences (fig. S4D). Cell metabolism and proliferation rates of all DTC1-derived CTC cell sublines were generally below DTC1 and 4T1, but twofold higher on average than CTC1. In addition, we observed significantly higher cell metabolism and proliferation rates in the E/m group in comparison with the M/e group (Fig. 2G and fig. S5A).
The adhesion property of E/m-type CTC sublines to endothelial cells, matrigel, and gelatin was higher than that of M/e-type CTC sublines (Fig. 2H and fig. S5B). In addition, we observed a significant but very minor increase in invasion capacity for E/m-type CTCs (Fig. 2I).
Mesenchymal-type CTC sublines are more resistant to chemotherapy than epithelial-type CTC sublines
Recent evidence suggests an association between EMT and chemoresistance, including breast and pancreatic cancer (5). To compare the resistance or vulnerability toward standard chemotherapeutics, E-type (4T1), E/m-type (CTC6-6, CTC6-11, CTC8-12, and DTC1), M/e-type (CTC8-6, CTC8-5, and CTC8-1), and M-type (CTC1) sublines were treated with cisplatin and doxorubicin at increasing concentrations for 48 hours. We detected metabolic activity using MTT assay. Concentration curves showed that mesenchymal-type sublines (M and M/e) had increased chemoresistance as compared to epithelial-type sublines (E and E/m), both for cisplatin [IC50 (drug concentration inducing 50% death of treated cells) mean values: M, 18.81 μM; M/e, 18.12 μM; E, 10.37 μM; E/m, 11.35 μM] and, more pronouncedly, for doxorubicin (IC50 mean values: M, 4.51 μM; M/e, 3.05 μM; E, 0.66 μM: E/m, 0.93 μM) (fig. S5C). We conclude that these mesenchymal-type CTC sublines have enhanced resistance toward clinically relevant chemotherapeutic drugs.
E/m-type CTC sublines have highest metastasis formation ability in vivo
The metastatic index of 4T1, DTC1, and especially CTC1, differed considerably following subcutaneous injection of cells. To address the capacity of cells with different EMT phenotypes to generate lung metastases after intravasation into the bloodstream, we performed intravenous injections. We injected E-type cells (E; 4T1 as a control), DTC1-derived CTC sublines with E/m-type cells (CTC6-6, CTC6-11, CTC8-12, and DTC1 as control), M/e-type cells CTC8-6, CTC8-5, and CTC8-1), and M-type cells (CTC1) at equal cell numbers (5 × 10⁴) in the tail vein of BALB/c mice (Fig. 3A). After 19 days, formation of lung metastasis was measured by counting superficial metastases and by ex vivo metastasis colony formation assay and was eventually implemented in a metastatic index per injected cell. The results demonstrated that cells with a predominantly epithelial phenotype (E and E/m) had enhanced metastasis-inducing ability compared to mesenchymal-type cells (M and M/e). CTC lines with a hybrid E/m phenotype exhibited the highest capability to trigger metastasis, which was also higher than parental, E-type 4T1 cells (Fig. 3B and fig. S5, D and E).
Fig. 3. Metastasis formation of 4T1, CTC1, DTC1, and CTC sublines of DTC1-transplanted animals.
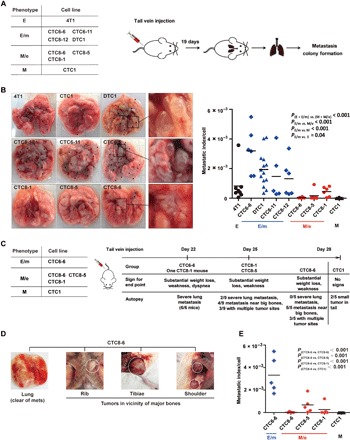
(A) Scheme of syngeneic intravenous injections: E-type (4T1, n = 8 mice), E/m-type (CTC6-6, n = 6 mice; CTC6-11, n = 5 mice; CTC8-12, n = 6 mice; DTC1, n = 14 mice), M/e-type (CTC8-6, n = 6 mice; CTC8-5, n = 6 mice; CTC8-1, n = 6 mice), and M-type (CTC1, n = 8 mice) cells (5 × 10⁴) were transplanted into BALB/c mice through the tail vein. After 19 days, numbers of superficial lung metastasis were counted, and lungs were harvested for further metastasis colony formation assay. (B) Left: Representative pictures of lungs following intravenous injection of cells bearing different EMT phenotypes. Black dots indicate metastatic lung nodules. Right: Dot plot shows metastatic index per cell including means (line) and P values for each cell line after intravenous injection. One-way ANOVA with post hoc multiple testing and Bonferroni correction; P values are indicated. (C) Scheme of syngeneic intravenous injections: E/m-type (CTC6-6), M/e-type (CTC8-6, CTC8-5, and CTC8-1), and M-type (CTC1) cells were transplanted into BALB/c mice through tail vein injection. Each experimental group was ended at the day of the indicated signs for end point. Results from autopsy at the given time points are described. (D) Pictures of autopsy results from CTC8-6–injected mice displaying the lack of lung metastasis and the presence of tumors in the vicinity of the rib, tibiae, and shoulder blade. (E) Dot plot shows metastatic index per cell of E/m-type (CTC6-6), M/e-type (CTC8-6, CTC8-5, CTC8-1), and M-type (CTC1) cells including mean values (line). One-way ANOVA with post hoc multiple testing and Bonferroni correction; P values are indicated. Photo credit: X. Liu (University of Munich).
Differences in metastatic indexes may result from a longer latency time of M/e-type CTCs to develop lung metastases and not from an inherently reduced metastatic capacity. Therefore, M/e-type clones CTC8-6, CTC8-5, and CTC8-1 and mesenchymal clone CTC1 were injected intravenously into BALB/c mice, along with E/m-type clone CTC6-6 with the highest metastatic index as a positive control (each n = 5 per cell line). We observed animals daily for signs for an end point and sacrificed them if required (see Materials and Methods). After 22 days, all E/m-type CTC6-6–injected mice (100%) and one CTC8-1–injected mouse (20%) had to be sacrificed on the basis of substantial weight loss, weakness, and dyspnea (Fig. 3C). Upon autopsy, we observed severe lung metastases (average of ≥10 metastases per lung) in all animals and confirmed them by metastatic lung colony formation assay (fig. S5, F and G). After 25 days, the remaining n = 4 mice injected with CTC8-1 (80%) and all n = 5 mice injected with CTC8-5 cells (100%) displayed similar signs for end point. Upon autopsy, two of nine mice revealed severe lung metastases (22.2%), four of nine mice had metastases in the proximity of larger bones (44.4%), and three of nine mice had multiple tumor sites (33.3%) (Fig. 3C). At day 28, all mice injected with CTC8-6 cells displayed substantial weight loss and clinical weakness. Mice injected with CTC1 cells did not show any signs of deterioration. On the basis of predefined end points, all remaining animals were sacrificed and analyzed at day 28. None of the CTC8-6–injected mice had severe lung metastases (0%), five of five mice had metastases in the proximity of big bones (100%), and three of five mice had multiple tumor sites (60%) (Fig. 3, C and D). None of the CTC1-injected mice displayed lung metastases, whereas two of five mice were bearing small tumors in the tail area, i.e., the injection site (Fig. 3C).
Numbers of superficial lung metastases, metastatic colonies, and the according metastatic indexes per injected cell are depicted in Fig. 3E and fig. S5 (F and G). All parameters confirmed significantly higher metastatic index of E/m-type CTC6-6 cells, despite prolonged seeding times for the remaining M/e- and M-type CTC sublines. The more aggressive phenotype of E/m-type CTC6-6 cells was further underscored by premature and substantial weight loss of the injected animals (fig. S5H).
EMT in CTC sublines is not a reflection of 4T1 cell heterogeneity
4T1 cells and DTC1 cells display a highly variable phenotype in conjunction with numerous genetic alterations, which could account for heterogeneous EMT phenotypes observed in CTC sublines retrieved from the blood of DTC1-injected mice. To test this hypothesis, we generated single-cell clones (SCCs) of 4T1 (n = 30), CTC1 (n = 23), and DTC1 (n = 30) and compared them with CTC sublines (n = 26) derived from the blood of DTC1-injected mice. Maximal EMT scores of 4T1-SCC ranged from 0 to 80, demonstrating a high degree of retention of their epithelial phenotype. EMT scores of CTC1-SCC ranged from 380 to 400, proving the steady mesenchymal phenotype of the CTC1 subline. DTC1-SCC and DTC1-derived CTC sublines had maximal EMT scores of 0 to 150 and 0 to 400, respectively, across all three independent measurements for each cell line. Resulting average EMT scores for DTC1-SCC and DTC1-derived CTC sublines ranged from 0 to 90 and 0 to 360, respectively (fig. S6, A and B). Hence, the range of EMT scores in CTCs is broader and not fully depicted by the heterogeneity of SCCs. These findings were further underscored by substantially different variances (i.e., squared SDs) of 736.86 and 14,428.12 and of ranges (90 and 345) for DTC1-SCC and DTC1-derived CTC sublines (fig. S6B). In confirmation, mean values of EpCAM expression were more broadly distributed in DTC1-derived CTC sublines than in DTC1-SCC, with increased variance and range (fig. S6C).
Together, these data demonstrate that EMT phenotypes in CTC sublines isolated from the blood of inoculated mice cannot be the sole consequence of the heterogeneity of parental cells.
EpCAM expression is a valid surrogate marker for EMT
We systematically analyzed the correlation of EpCAM expression and EMT phenotypes in the 4T1 MBC model, with the aim of using EpCAM as a surrogate marker in clinical samples of MBC. Cell surface expression of EpCAM was quantified by flow cytometry in 4T1-derived cell lines, including cell lines recultured from primary tumors and organ metastases, and in all CTC and DTC sublines reisolated from the blood and bone marrow, respectively, of 4T1-, CTC1-, and DTC1-injected mice. In 4T1-derived sublines, EpCAM showed a down-regulation in a subset of primary tumor–derived sublines as compared to parental 4T1 cells, while metastasis-derived sublines displayed overall high EpCAM levels (fig. S7A). EpCAM remained absent in sublines recultured from CTC1-derived primary tumors and organ metastases (fig. S7B; a mean fluorescence intensity ratio of 1 represents lack of expression). Accordingly, sublines from CTC1-derived primary tumors and organ metastases maintained a mesenchymal phenotype under ex vivo culture conditions. In sublines of the DTC1-transplanted animals, average EpCAM expression was higher in DTC recultured from the bone marrow and in sublines recultured from organ metastases compared with CTC sublines from the blood and primary tumors (Fig. 4A). CTC sublines isolated from the blood of DTC1-injected mice displayed substantial heterogeneity of EpCAM expression, which was also observed across cell lines originating from the same mouse (Fig. 4A). Strong expression of EpCAM correlated negatively with higher EMT scores (high EMT scores represent an EMT phenotype) in Spearman’s rank correlation testing (r = −0.728, P < 0.001; Fig. 4B). Thus, EpCAM expression is heterogeneous across primary and systemic 4T1-derived sublines, and high levels of EpCAM expression in CTCs are associated with the retention of an epithelial phenotype. Furthermore, a high degree of EMT heterogeneity was monitored in blood-derived CTCs at the level of individual animals.
Fig. 4. EpCAM expression profiles correlate with an epithelial phenotype of experimental cells and human CTCs.
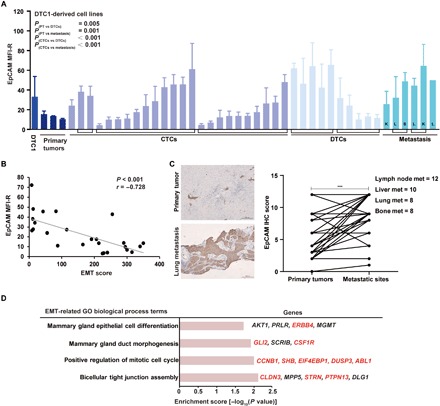
(A) EpCAM expression was measured by flow cytometry in cell lines from primary tumors (PT), CTCs, DTCs, and metastases isolated from DTC1-injected BALB/c mice. Brackets demark cell lines originating from one individual mouse. L, lung; S, spleen; K, kidney. Data are presented as mean fluorescence intensity ratios (EpCAM/iso) with SD from n ≥ 3 independent experiments performed in unicates. One-way ANOVA with post hoc multiple testing and Bonferroni correction; P values are indicated. (B) Cluster plot analysis of Spearman’s rank correlation between EpCAM expression and EMT score in DTC1-derived CTC sublines. Correlation coefficient (r) and P value are included. (C) EpCAM expression level was assessed in n = 38 human breast tumors and associated lymph node metastases (met) (n = 12), liver metastases (n = 10), lung metastases (n = 8), and bone metastases (n = 8). Shown are representative IHC staining of EpCAM in primary tumors and corresponding lung metastasis and quantifications of IHC intensity scores for all samples as paired samples (see Materials and Methods). Paired t test, ***P < 0.001. (D) Enrichment analysis of GO biological process terms of genes extracted from CNVs of EpCAM+ (n = 10) versus EpCAM− CTCs (n = 20) from patients suffering from MBC (n = 3). GO terms related to epithelial differentiation are listed. Enrichment score with −log10 (P value) of more than 1.3 was considered significant. Gene names in red font: amplified in EpCAM+ CTCs; gene names in black font: mutated in EpCAM+ or EpCAM− CTCs.
On the basis of the described high level of EMT heterogeneity and on the correlation of EpCAM expression with the epithelial phenotype of CTCs in the 4T1 MBC model, we further investigated whether comparable observations can be made in patients with MBC. We collected pairs of primary tumors and corresponding lymph node metastases (n = 12), liver metastases (n = 10), lung metastases (n = 8), and bone metastases (n = 8) from patients with breast cancer after surgery and performed IHC staining of EpCAM. IHC scoring results demonstrated that the expression of EpCAM was higher in metastases compared with primary tumors (Fig. 4C and fig. S7C), validating results of the 4T1 MBC model.
Proportions of EpCAM+ DTCs predict metastases and survival of patients with MBC
To extend our findings, we prospectively examined the epithelial status of CTCs and DTCs in patients with MBC through the level of EpCAM expression using an EpCAM-independent strategy integrating subtraction enrichment (SE) and immunostaining–fluorescence in situ hybridization (iFISH) technologies (31). Multimarker SE served to deplete WBCs from the blood and bone marrows of patients with stages III and IV MBC (n = 34; see fig. S8A). We detected remaining WBCs with CD45-specific staining in enriched cells to exclude them from further analysis. We performed karyotypic characterization of the ploidy status of tumor cells using in situ hybridization with chromosome enumeration probes hybridizing to human chromosome 8 (CEP8; fig. S8B). We chose CEP8 based on the frequent alteration in chromosome 8 in cancer, including breast cancer. In addition, cell sizes for potential CTCs and DTCs were compared to WBCs and revealed equal or smaller for 62.2 and 95.9% of cells analyzed, respectively (fig. S8B). While all CTCs (100%) and the vast majority of DTCs (91.9%) in the fraction of smaller cells were aneuploid, the proportion of diploid CTCs and DTCs increased in cells with a similar (8.4 and 24.5%) and larger size than WBCs (34.1 and 15.4%) (fig. S8B). CTCs in the blood and contemporaneous DTCs from the bone marrow were enriched from all n = 34 patients first diagnosed with MBC who would receive standard-of-care treatment.
To study genetic changes between EpCAM+ and EpCAM− CTCs, we performed single-cell DNA sequencing to detect genome-wide copy number variations (CNVs) in EpCAM+ (n = 10; n = 7 aneuploid and n = 3 diploid) and EpCAM− (n = 20 aneuploid) CTCs, isolated from 3 of 34 patients with MBC. CNV profiles were standardized to WBCs (n = 4). A comparison of single-cell DNA sequencing from EpCAM+ and EpCAM− CTCs revealed a total of 657 CNVs between the two cell types (amplifications and deletions), which comprised 1255 coding genes (fig. S9, A and B). Unsupervised clustering of the top 100 CNVs and the genes encoded within the affected genomic region discriminated EpCAM+ from EpCAM− CTCs (fig. S9C). To examine potential functional implications for the affected genes, we performed a GO term enrichment analysis (fig. S9). Within the enriched “biological process” GO terms, amplification of genes in tight junction (CLDN3, STRN, and PTPN13), mitotic cell cycle (CCNB1, SHB, EIF4EBP1, DUSP3, and ABL1), mammary gland epithelial cell differentiation (ERBB4), and mammary gland duct morphogenesis (GLI2 and CSF1R) indicated an increased ability of cell adhesion, proliferation, and epithelial differentiation of EpCAM+ CTCs (Fig. 4D). This is in line with reported functions of EpCAM in cell adhesion, proliferation, and endodermal/epithelial differentiation (32). All enriched GO terms with P < 0.05 are summarized in table S1.
In the following, we assessed whether EpCAM expression levels associated with the metastatic status and disease outcome of patients with MBC. Representative SE-iFISH results for single CTCs and DTCs, as well as clustered cells of each group, are depicted in Fig. 5A. Total numbers of 845 CTCs and 71,910 DTCs were isolated from n = 34 patients; the median cell number detected per patient was 9 CTCs and 413 DTCs, and the correlation of CTC and DTC numbers per patient is shown in the top panel of Fig. 5B. Likewise, numbers of cell clusters were significantly higher in the bone marrow as compared to the blood (Fig. 5B, middle). The proportions of EpCAM+ CTCs and DTCs, defined as the number of EpCAM+ cells divided by the total detected cell number of each patient, were higher in DTCs compared with CTCs (Fig. 5B, bottom). Twenty of 34 patients (58.8%) had no detectable EpCAM+ CTCs in the blood, while only 12 of 34 patients (35.3%) had no EpCAM+ DTCs in the bone marrow (Fig. 5C). In the context of all detected CTCs and DTCs, the proportion of EpCAM+ CTCs and DTCs was 22.4 and 65.9%, respectively (Fig. 5B). Using EpCAM as a marker for epithelial differentiation, we conclude that patients with MBC are characterized by higher proportions of mesenchymal CTCs and epithelial DTCs.
Fig. 5. Proportions of EpCAM+ systemic tumor cells correlate with the clinical outcome of patients with MBC.
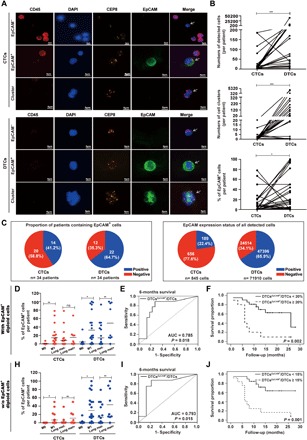
(A) CTCs and DTCs were detected by SE-iFISH in pairs of blood and bone marrow samples from n = 34 patients with breast cancer. Shown are representative examples of aneuploid CTCs, DTCs, and cell clusters identified by iFISH (white arrows). DAPI (4′,6-diamidino-2-phenylindole), immunofluorescence (CD45, red; DAPI, blue; EpCAM, green), and FISH (CEP8, orange) are depicted as indicated. Shown are representative staining for each antigen. (B) Shown are numbers of detected CTCs and DTCs (top), numbers of cell clusters of CTCs and DTCs (middle), and percentages of EpCAM+ CTCs and DTCs in each patient (bottom). Paired CTC and DTC values are connected by solid lines. Wilcoxon signed-rank test, *P < 0.05 and ***P < 0.001. (C) Shown are proportions of EpCAM+ CTCs and DTCs in individual patients (n = 34) (left pie charts) and in overall numbers of CTCs (n = 845) and DTCs (n = 71,910) (right pie charts). EpCAM+, blue; EpCAM−, red. (D and H) Dot plots depict percentages of EpCAM+ CTCs and DTCs per patient (n = 34) stratified for distant metastases status M0 and M1 (without and with detectable organ metastasis, respectively) and for the absence or presence of lung metastases. (D) includes EpCAM+ diploid cells, whereas (H) excludes EpCAM+ diploid cells, as indicated. Mean percentage of EpCAM expression is indicated by a horizontal line. Mann-Whitney U test, *P < 0.05 and **P < 0.01. (E and I) Specificity and sensitivity of the EpCAM-positivity rate of DTCs to predict the 6-month survival rate are depicted as an ROC curve. AUC and P value are indicated. Sensitivity, true positives; 1-specificity, false positives. (E) includes EpCAM+ diploid cells, whereas (I) excludes EpCAM+ diploid cells. (F and J) Overall survival of patients with stages III and IV MBC (n = 34) was stratified according to the presence of EpCAM+ DTCs in the bone marrow with a cutoff of 20% (F) and 15% (J) (deduced from ROC analysis) and is depicted as Kaplan-Meier survival curves with P value. (F) includes EpCAM+ diploid cells, whereas (J) excludes EpCAM+ diploid cells, as indicated.
A correlation of the proportion of EpCAM+ CTCs and DTCs with clinical parameters disclosed that higher rates in CTCs and DTCs were positively correlated with detectable organ metastasis as compared to patients without (Fig. 5D). Furthermore, higher proportions of EpCAM+ DTCs were significantly associated with the occurrence of lung metastases (Fig. 5D). All patients were followed for a median of 11 months, and receiver operating characteristic (ROC) curve was applied to determine the sensitivity and specificity of the proportion of EpCAM+ DTCs for a 6-month survival. The proportion of EpCAM+ DTCs predicted the risk of 6-month mortality of patients with MBC with good accuracy [area under the curve (AUC), 0.785; 95% confidence interval (CI), 0.588 to 0.983; P = 0.018; Fig. 5E] and a cutoff value of 19.78% EpCAM positivity (sensitivity, 75.0%; specificity, 82.6%) was calculated. On the basis of results from the ROC analysis, we applied a ≥20% cutoff for the proportion of EpCAM+ DTCs and analyzed the overall survival of patients. Patients characterized by a proportion of EpCAM+ DTCs of ≥20% showed a severely decreased overall survival (Fig. 5F). We performed comparable analyses following the exclusion of EpCAM+ diploid CTCs and DTCs. The proportion of EpCAM+ CTCs and DTCs was decreased to 6.3 and 56.9%, respectively (fig. S8C). Proportions of EpCAM+ aneuploid CTCs and DTCs correlated with the presence of distant and lung metastases (Fig. 5H). Furthermore, proportions of EpCAM+ DTCs predicted the risk of 6-month mortality of patients with MBC with good accuracy (AUC, 0.793; 95% CI, 0.599 to 0.988; P = 0.015; Fig. 5I) and a cutoff value of 16.87% EpCAM positivity. Patients characterized by a proportion of EpCAM+ DTCs of ≥15% showed severely decreased overall survival (Fig. 5J).
Hence, in strong confirmation of results derived from the 4T1 MBC model, EpCAM+ CTCs and DTCs were associated with the generation of distant metastases and lung metastases, and an EpCAM positivity rate above 15 to 20% in systemic tumor cells in the bone marrow predicted the considerably decreased overall survival of patients with MBC.
DISCUSSION
In the present study, we combined the syngeneic murine 4T1 MBC model with clinical samples of systemic tumor cells from patients with MBC to recapitulate different stages of tumor progression and study their association with EMT. Despite a robust generation of distant metastases in lungs, actual numbers of CTCs appeared generally scarce after transplantation of 4T1 cells, as reflected by the low frequency of cell lines retrieved from the blood of transplanted animals. This is in accordance with CTC numbers of ~1 CTC per 10 million WBCs in 7.5 ml of blood sample of patients with advanced solid cancers (8, 9). Despite these low numbers, systemic tumor cells, i.e., CTCs and DTCs, are considered the primary source of MICs (13, 33), which represent not only a major clinical challenge but also, possibly, a valuable therapeutic opportunity (25).
Morphological, molecular, and phenotypic analyses of the 4T1 model disclosed a substantial degree of inter- and intraindividual EMT heterogeneity in CTCs, confirming the coexistence of CTCs with epithelial and mesenchymal traits in the blood of individual animals. Earlier reports addressing EMT phenotypes in human CTCs demonstrated a correlation of mesenchymal CTCs with therapy resistance (22, 23, 26), a phenotype that was also observed in the present study of murine CTCs. More recently, the notion of EMT as a central process in metastases formation in MBC was challenged using cell tracing experiments in mice, suggesting that cells responsible for metastases formation had not undergone EMT and supporting a role for mesenchymal tumor cells in chemoresistance (22, 23). Analysis of EMT phenotypes in prostate and bladder cancer revealed an even more intricate dependency of epithelial and mesenchymal tumor-initiating cells (TICs). An epithelial gene signature was characteristic of tumor cells with strong metastatic TIC capacity, whereas a mesenchymal signature was associated with reduced metastatic TIC activity. However, the presence of mesenchymal TICs accelerated and enhanced the metastatic ability of epithelial TICs in vitro and in vivo (33).
In the murine 4T1 MBC model, we did not observe any bias in EMT phenotype in a total of n = 26 CTC cell lines that were reisolated from the blood, which indicates that our model system did not select CTCs with particular EMT status. However, it must be noted that the vast majority of CTC lines originated from animals transplanted with bone marrow–derived DTC1 cells, which were characterized by an E/m phenotype and generally improved tumor and metastases formation capacity. Detailed analysis of the karyotypes of 4T1 and DTC1 cells allowed us to extract genes potentially affected by chromosomal breakpoints with significant differences in frequency between both cell lines. GO term analysis of the extracted genes revealed that the term including the most genes (n = 6) was positive regulation of ERK1 and ERK2 cascade, which is of special interest, given the role of ERK (extracellular signal–regulated kinase) activation status as a central integrator of epidermal growth factor receptor signals to induce either proliferation or induction of EMT (34).
On the basis of the genetic instability of 4T1 cells and their origin from a lung metastasis derived from the 410.4 primary breast carcinoma cell line (28, 29), it was important to verify that the observed changes of EMT phenotype of ex vivo isolated CTCs were not solely a reflection of highly variable phenotypes of subclones of 4T1 and DTC1. Sublines of 4T1 and DTC1 generated in vitro as SCCs were characterized by a more restricted epithelial phenotype than CTC sublines retrieved from the blood of transplanted animals. Furthermore, the phenotype of CTC and DTC lines remained stable over the entire period of experimental assessment, which comprised ≥20 passages. Hence, these results corroborate changes in EMT phenotypes in systemic tumor cells present in the blood of transplanted mice.
The observed phenotypic diversity of CTC lines allowed us to subdivide CTCs more specifically into E/m and M/e phenotypes, which reflects more properly a frequently discussed partial EMT observed in tumors. Emerging evidence suggests that EMT is rarely an “all-or-nothing” condition. Instead, cancer cells often adopt hybrid EMT phenotypes (5, 14, 17, 18, 26, 35–37). Hybrid phenotypes comparable to those characterized in the present study have been described, among others, in breast and ovarian cancer (26, 36). EMT heterogeneity was assessed using similar markers to ours: EpCAM, E-cadherin, keratins, fibronectin, cadherin-2, and serpine1/PAI1 (26), or morphological examination in combination with E-cadherin, pan-cytokeratin, and vimentin (36). Huang et al. (36) and Tan et al. (38) defined identical EMT groups, i.e., epithelial, intermediate epithelial, intermediate mesenchymal, and mesenchymal phenotypes, and gene signatures, respectively, with relevance to tumor progression and patients’ outcome. Validation of the EMT spectrum through mRNA measurement further disclosed a 33-gene signature, where E-cadherin, cytokeratin 19, and vimentin expression confirmed the assignment of cell lines to the various EMT subgroups (36).
Here, we demonstrate that epithelial-type CTCs with a restricted mesenchymal transition compared to parental 4T1 cells (E/m-type cells) bears the strongest capacity to form lung metastases when directly inoculated in the bloodstream (see scheme in Fig. 6). Despite their ability to form metastases mostly in the vicinity of large bones after extended time periods, M/e-type CTCs displayed a poor aptitude to form lung metastases. Tumor-associated deaths are primarily caused by metastases in life-supporting organs such as the lungs and liver. Therefore, enhanced adhesion ability of E/m-type CTCs to endothelial cells could promote the retention at the endothelium and subsequent extravasation, while their enhanced proliferation rate could potentially facilitate renewed outgrowth in lungs to generate life-threatening metastases (Fig. 6). It cannot be excluded that E/m-type CTCs has initially undergone EMT to intravasate in the blood vessels and has subsequently reverted their phenotype through MET during their residency in mice. To clarify this point, options of genetic tracking of EMT during metastases formation are available in animal models (22, 23). However, the plethora of molecules involved in the process cannot be assessed at once, and thus, definitive claims about a lack of requirement for EMT during tumor progression can hardly be made (14, 16). Furthermore, although subcutaneous transplantation of 4T1 cells will rather underestimate metastatic outgrowth, the impact of the two microenvironments encountered following subcutaneous versus orthotopic transplantation might differentially affect EMT regulation. A multitude of parameters including soluble factors, cell-associated ligands, exosomes, and microRNAs can differ between the two primary tumor localizations and might affect the epithelial phenotype of transplanted cells. It can nonetheless be concluded from our data that a primarily EpCAM+ epithelial phenotype endorses systemic tumor cells from MBC with improved MIC capacity to generate lung metastases, which is in line with studies on MBC (13, 19, 20), prostate and bladder carcinomas (33, 39), and pancreatic carcinomas (23).
Fig. 6. Schematic representation of EMT during the metastatic cascade.
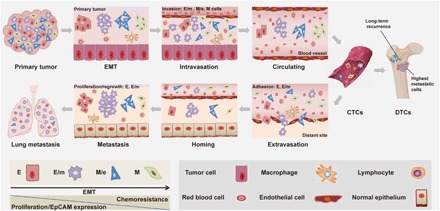
Tumor cells can undergo gradual or full EMT (E, E/m, M/e, and M) that is associated with decreased proliferation, loss of EpCAM expression, and increased migration. In the metastatic cascade, M > M/e > E/m cells have increased ability to intravasate into the lymphovascular system. Once tumor cells intravasate into blood vessels, they are termed CTCs. E- and E/m-type CTCs have enhanced capacity to adhere, hence to extravasate into distant site. After homing into distant organs, including the bone marrow, systemic tumor cells are termed DTCs. E and E/m systemic tumor cells are associated with improved capacity in proliferation and metastatic outgrowth, and M/e- and M-type cells are related to long-term tumor recurrence.
Findings from the 4T1 MBC model were validated in a clinical cohort of patients with stages III and IV MBC (n = 34). Using the EpCAM-independent, multiparameter enrichment SE-iFISH technology (31), we could demonstrate a frequent loss of epithelial phenotype in CTCs and retention of epithelial phenotype in bone marrow–derived DTCs using EpCAM as a robust surrogate marker for EMT. Despite the comparably small number of patients enrolled in the study, we confirmed a significant correlation of the proportion of EpCAM+ CTCs and DTCs with the occurrence of distant metastases and, more specifically, of lung metastases. Furthermore, the proportion of EpCAM+ DTCs accurately predicted a 6-month survival and an overall survival with a cutoff of 15 to 20% of EpCAM+ tumor cells, which was extrapolated from the ROC analyses of the 6-month survival of the patients enrolled in the study.
The presence of single aneuploid circulating CD31+ endothelial cells (CECs) was reported in the blood of patients with cancer (31), which might affect the interpretation of our data. Although not all systemic tumor cells enriched in the present study could be tested for CD31 expression, because the SE-iFISH CEC quantification technology was not finalized when the first patients of the study were enrolled, CD31 staining of all CTCs selected for DNA sequencing was performed and revealed negative. In addition, proportions of EpCAM+ cells were used as a stratification parameter, rather than absolute numbers of systemic tumor cells, to discriminate the patients’ outcome. Thus, depending on the numbers of CECs, the proportions of EpCAM+ CTCs/DTCs will either remain stable or slightly decrease. We argue that this strategy does not overestimate the ability of EpCAM+ systemic cells to predict distant metastases and clinical outcome. Hence, the results from our cohort of patients with MBC fortify the notion that EpCAM+ systemic tumor cells represent the major source of MICs and strongly validate results from the 4T1 animal model.
GO analysis of genes encoded by genomic regions affected by CNVs was obtained from single-cell DNA sequencing from three patients. GO term analysis disclosed that genetic amplifications of genes involved in tight junction (including gene products that reportedly are interaction partners of EpCAM such as claudins), cell cycle regulation, and mammary epithelial cell differentiation were enriched in human EpCAM+ CTCs compared to EpCAM− CTCs. These findings further suggest the importance of epithelial traits, adhesion, and proliferation capacities of systemic tumor cells for the process of metastases generation. It must however be noted that despite indications for an enrichment of epithelial traits in EpCAM+ CTCs, no genetic alterations that would affect genes associated with the induction of a mesenchymal status (e.g., EMT-TFs) were found to be enriched in EpCAM− CTCs. Hence, single-cell DNA sequencing confirmed EpCAM as a valid marker of the epithelial status of systemic tumor cells but did not provide final evidence for the mesenchymal status of CTCs.
Clusters of systemic tumor cells, although rare in the circulation, bear 23- to 50-fold increased metastatic potential compared to single CTCs (40). In accordance, DTCs isolated in stages III and IV patients in the present cohort were characterized by higher cluster formation in line with an enhanced epithelial phenotype.
Last, a central application of CTCs is their usage as liquid biopsy to harvest comprehensive instantaneous information of systemic cancer (6, 8, 25). To this end, EpCAM is so far the sole marker with clearance for clinical approaches within the CELLSEARCH system. Owing to issues of EpCAM loss during EMT, concerns were raised that CTC isolation systems might underestimate numbers and possibly oversee clinically relevant cells. On the basis of our results, we suggest that EpCAM-dependent enrichment systems will underestimate CTC numbers but will quantify clinically relevant cells. Accordingly, numbers of EpCAM+ CTCs predict clinical outcome of patients with MBC and nonmetastatic breast cancer (8, 41). As a synthesis, it would be beneficial to quantify total amounts of CTCs (and DTCs) and to subdivide systemic tumor cells according to their EMT phenotype, to improve the prediction of the metastatic risk, and to support treatment decision-making.
In summary, our data facilitate the understanding of the role of EMT in cancer metastasis using a mouse model of MBC to accurately recapitulate the clinical situation of MBC. We demonstrate in the MBC mouse model and verify in a clinical cohort of patients with stages III and IV MBC that a subpopulation of systemic tumor cells with a hybrid E/m phenotype greatly contributes to the formation of outcome-limiting metastases.
MATERIALS AND METHODS
Experimental design
The objectives of the present study were to assess the association of differing EMT phenotypes in systemic cancer cells of MBC with their ability to form lung metastases in vitro, ex vivo, and in vivo in the 4T1 MBC syngeneic mouse model. Our major focus was on CTCs and DTCs, their EMT phenotypes, proliferation, adhesion, migration, invasion, tumorigenesis, and metastatic potential. In addition, the objective of the study was to analyze EMT phenotypes of systemic CTCs and DTCs from primary patients with MBC and to correlate EMT phenotypes with the metastatic status and clinical outcome of the patients.
Ethical statements
Mouse experiments were conducted with the approval of the Regierung von Oberbayern, Munich, Germany (Az 55.2.1.54-2532-90/12 and 177/15). The clinical study was approved by the Ethics Committee of Shanghai General Hospital (ethics #2018KY153) and was performed according to the Declaration of Helsinki Principles. Written consent to notify blood and bone marrow samples to be applied for future research was obtained for each patient under Institutional Review Board–approved protocol.
Cell culture
Murine 4T1 cells were cultivated in Dulbecco’s modified Eagle medium (DMEM; Biochrom GmbH, Berlin, Germany) supplemented with 10% fetal bovine serum (FBS; Biochrom AG, Heidelberg, Germany) and 1% penicillin/streptomycin (Biochrom GmbH, Berlin, Germany). 4T1 sublines derived from primary tumors, CTCs, DTCs, and metastases were cultured in selection medium containing 60 μM 6-TG (Sigma-Aldrich, Saint Louis, USA) in DMEM with 10% FBS and 1% penicillin/streptomycin (Gibco, Planegg, Germany). DTC1-derived CTC sublines, which grew in a less adhesive manner, were propagated for both adherent and semi-adherent cells. All cell lines were grown in a 5% CO2 atmosphere at 37°C.
Mouse experiments
For tumorigenicity assay, 1.25 × 10⁵ cells in 100 μl of phosphate-buffered saline (PBS) were subcutaneously transplanted into the flank of BALB/c mice (age-matched between 6 and 8 weeks). After an average of 27 days, mice were anesthetized by 0.4% isofluorane inhalation before being sacrificed. Blood collected from the orbital sinus and femurs and tibiae were harvested for isolation of CTCs and DTCs, respectively. Primary tumors and organs including the lung, spleen, kidney, and liver were harvested for cryopreservation (IHC staining) and for the establishment of ex vivo sublines. Passage numbers below five passages were used for all derived cells for reinjection in vivo, and passage numbers below 10 passages were used for functional studies ex vivo.
Alternatively, 1.25 × 10⁵ 4T1 and DTC1 and 5 × 10⁵, 1 × 10⁶, and 2 × 10⁶ CTC1 cells in 100 μl of PBS were subcutaneously transplanted into the flank of BALB/c mice (age-matched between 6 and 8 weeks). After 15 days, mice were sacrificed, and lungs were harvested for metastatic colony formation assay. Metastatic index per cell was calculated as numbers of lung metastatic colonies divided by the numbers of injected cells.
For the ex vivo culture of CTC lines, blood was taken from the retro-orbital sinus under anesthesia. Retrieved blood volumes per mouse were weight dependent and varied within the range of 0.8 to 1 ml per mouse. Thereafter, full volumes of blood were first depleted of red blood cells (RBCs) by an ammonium chloride–based lysing reagent (BD Pharm Lyse, BD Biosciences, Heidelberg, Germany). After washing and centrifugation, cell pellets (containing WBCs and potential CTCs) were suspended in 10 ml of selection medium. Serial dilution with twofold dilution steps was used to plate the isolated cells in 96-well plates with a starting volume of 100 μl. Cell colonies growing to high confluence in 96-well plates were transferred independently to 12-well plates and later to 6-well plates. Eventually, selected cells were scaled up to larger volumes for further maintenance.
For the ex vivo culture of DTC lines, the hip and knee joints were removed from femurs and tibiae, and bone marrows were flushed with sterile PBS. After washing and depleting of red blood cells, cell pellets were resuspended in 10 ml of selection medium, and cell lines were generated as described for CTCs.
For the ex vivo culture of primary tumor and metastasis cell lines, tumors or organs (lung, spleen, kidney, and liver) were minced and homogenized through a 100-μm filter. After washing and centrifugation, cell pellets were resuspended in 10 ml of selection medium and seeded in one culture dish. Selected cells were transferred to flasks for further maintenance upon reaching confluence.
For intravenous metastasis formation assay, 5 × 10⁴ cells in 100 μl of PBS were intravenously injected into the tail vein of BALB/c mice. Mice were sacrificed at day 19, metastases in lungs were counted, and lungs were collected for metastasis colony formation assay. Alternatively, 5 × 10⁴ cells in 100 μl of PBS were intravenously injected into the tail vein of BALB/c mice. Mice were observed daily, and body weights were measured every 1 to 2 days. Signs for end points of the experiment of each group are as follows: (i) substantial weight loss (≥5% in more than two mice), (ii) weakness (i.e., tiredness, unresponsiveness in more than two mice), and (iii) less than two left experimental groups.
Metastasis colony formation assay was performed to quantify 4T1-derived cells in the lungs of transplanted mice. Entire lungs were minced and incubated in RPMI 1640 medium supplemented with collagenase (5 mg/ml; Sigma-Aldrich, Steinheim, Germany) and deoxyribonuclease (1 mg/ml; Sigma-Aldrich, Steinheim, Germany) for 30 min. Thereafter, lung fragments were homogenized through a 100-μm filter and subsequently through a 40-μm filter, which were each rinsed with 5 ml of PBS. After centrifugation, cell pellets were incubated with erythrocyte lysis reagent (BD Pharm Lyse, BD Biosciences, Heidelberg, Germany) for 2 min. Afterward, cells were centrifuged and resuspended in 10 ml of selection medium before being diluted 1:10 and 1:100 in selection medium. Three milliliters of each concentration were pipetted in six-well plates in triplicates. Colonies were stained after 10 days for subcutaneous and after 4 days for intravenous transplantations with 1% crystal violet/70% methanol solution. Clusters of ≥20 cells were defined as a colony. Colony numbers of 1:100 dilutions are shown in fig. S5.
Metaphase preparation and spectral karyotyping analysis
Cells were cultivated to 80% confluency on sterile glass slides in quadriPERM chambers with 5 ml of cell culture medium. For the preparation of chromosome spreads, colcemid (0.1 μg/ml; Roche, Basel, Switzerland) was added to the cell culture medium for an additional 3 hours at 37°C. Afterward, the medium was removed, and cells were washed with PBS. Cells were incubated with 5 ml of 0.075 M KCl for 25 min at 37°C. Subsequently, 5 ml of fixation solution (methanol/acetic acid, 3:1) was added for 20 min. The solution was removed, and 5 ml of fixation solution was added for 20 min. After another fixation step for 20 min, slides were removed from the quadriPERM chamber and air dried. Metaphase preparations were kept at room temperature for at least 1 week. Hybridization was performed, as previously described (42). Briefly, the slides were dehydrated and hybridized with a denatured spectral karyotyping–probe mixture (SkyPaint DNA Kit, Applied Spectral Imaging, Carlsbad, California, USA). After hybridization, slides were washed (0.5× SSC for 5 min at 75°C, 4× SSC/0.1% Tween 20 for 2 min at room temperature, and H2O for 2 min at room temperature), and probes were detected using antidigoxigenin (1:250; Roche), avidin–Cy-5, and avidin–Cy-5.5 antibodies (both 1:100; Biomol, Hamburg, Germany) according to the manufacturer’s protocol. Metaphase spreads were counterstained using 0.1% 4′,6-diamidino-2-phenylindole (DAPI). Spectral imaging analysis was carried out using a fluorescence microscope (ZEISS Axioplan 2) equipped with a SpectreCube device and SkyView software (Applied Spectral Imaging). A minimum of 15 metaphases were analyzed to determine the karyotype of each primary culture. Chromosome aberrations were detectable by color junctions within affected chromosomes. Image analysis was performed using the SkyView imaging software (Applied Spectral Imaging, Mannheim, Germany). A subsequent analysis of GO term enrichment in 4T1 and DTC1 cells is described in Results.
Flow cytometry
Cells were washed three times in fluorescence-activated cell sorting (FACS) buffer (PBS and 3% FBS) before incubation with an EpCAM-specific antibody (rat anti-mouse EpCAM G8.8, BD Biosciences, Heidelberg, Germany; 1:50 in FACS buffer for 15 min) or a CD45-specific antibody (rat anti-mouse CD45 30-F11, BD Biosciences; 1:50 in FACS buffer for 15 min). After centrifugation, cells were incubated with a fluorescein isothiocyanate–conjugated secondary antibody [rabbit anti-rat immunoglobulin G (IgG) (H+L), BD Biosciences, Heidelberg, Germany; 1:50 in FACS buffer for 15 min]. Cells were centrifuged and resuspended in FACS buffer containing propidium iodide (1 mg/ml). Cell surface expression of EpCAM was analyzed in a FACSCalibur cytometer (BD Biosciences, Heidelberg, Germany). Control staining was performed using the secondary antibody [rabbit anti-rat IgG (H+L), BD Biosciences].
Immunocytochemistry, IHC, and EMT scoring
EpEX-specific (rat anti-mouse EpCAM G8.8, BD Biosciences, Heidelberg, Germany) and vimentin-specific antibodies (rabbit monoclonal to vimentin EPR3776, Abcam, Cambridge, UK) were used for IHC. Immunostaining was performed using the avidin-biotin-peroxidase method (VECTASTAIN, Vector Laboratories, Burlingame, CA, USA) according to the manufacturers’ protocol. IHC intensity scores (IHC score) were calculated as the product of intensity (0 to 3+) and the percentage of expressing tumor cells (score: 0 = 0 to 5%, 1 = 5 to 25%, 2 = 25 to 50%, 3 = 50 to 75%, and 4 = 75 to 100%). IHC scores represent averages of values independently assessed by a minimum of two experimenters, who were blinded to sample identity.
EMT scores were calculated as the percentage of mesenchymal, spindle-like cells (0 to 100%) and the level of cell-cell contact (disseminated cells represent 1 = 0 to 25%, 2 = 25 to 50%, 3 = 50 to 75%, and 4 = 75 to 100%). Three experimenters scored independently each cell line at an average confluence of 50 to 80% for three independent passages.
Proliferation assay, MTT assay, and 2D and 3D colony formation assays
For proliferation assays, 5000 cells were plated in six-well plates in duplicates. Cell numbers were manually assessed from days 1 to 5 upon counting in a trypan blue exclusion assay. Cell metabolism was assessed by MTT assay. One thousand cells were plated in 96-well plates in triplicates. At days 1, 3, and 5, MTT solution (Sigma-Aldrich, Saint Louis, USA) in medium was added to a final concentration of 0.5 mg/ml for 4 hours at 37°C. MTT solvent (0.1 N HCl in isopropanol) was added to solubilize formazan crystals before measuring the optical density (OD) at a wavelength of 570 nm with 690 nm as a reference in a microplate reader (Molecular Devices, Sunnyvale, CA, USA).
Chemoresistance was assessed as follows: Cells were seeded in a 96-well plate at 5000 cells per well and grown for 24 hours. Then, cells were treated with 100 μl of medium containing 120, 60, 30, 15, 7.5, 3.75, and 1.875 μM doxorubicin (Sigma-Aldrich, Steinheim, Germany) or cisplatin (Santa Cruz Biotechnology, Heidelberg, Germany) in triplicates for 48 hours. The IC50 values were calculated using GraphPad Prism 5 (GraphPad Software Inc., San Diego, CA, USA). The percentage of cell survivability was calculated according to the following equation:
For 2D colony formation assays, 50, 100, and 200 cells were plated in culture dishes. After 11 days, colonies were stained with 1% crystal violet/70% methanol solution, where clusters of ≥30 cells were defined as a colony. Plating efficiency was calculated by dividing the number of colonies by the number of plated cells. For 3D colony formation assay, 5 and 3.5% low–melting point (LMP) agarose (BD Biosciences, Heidelberg, Germany) in PBS was used to generate 0.5% agarose/medium solutions by mixing 5% agarose with culture medium (1:10). Eight milliliters of the solution was quickly plated into culture dishes as the base layer, and solidification was completed at room temperature for 30 min. Then, 1 × 10⁴ cells were suspended in 9 ml of growth medium and mixed with 1 ml of 3.5% LMP agarose. The resulting mixture representing 1000 cells/ml was added onto each plate for solidification. After 11 days, colony numbers were counted under a microscope, and clusters of ≥30 cells were defined as colony. The size of colonies was measured using ImageJ software. All the experiments were repeated at least three times.
Adhesion, invasion, and scratch assay
For adhesion assays, 96-well flat bottom culture plates were coated with 50 μl of gelatin (0.2%; Sigma-Aldrich) and matrigel (0.9 mg/ml; Corning, Bedford, USA) or kept uncoated. Cells were labeled with 10 μM calcein acetoxymethyl (AM) (Life Technologies Inc., Schwerte, Germany) for 30 min at 37°C and washed three times in PBS. Labeled cells (2.5 × 10⁴) were seeded in 50 μl of medium per well and kept for 2 hours of adhesion time. Thereafter, plates were washed twice with PBS (input control was not washed). Before measurement of calcein AM fluorescence in a Victor Wallac instrument, cells were lysed in 2% Triton X-100 in distilled water. For endothelial cell adhesion assay, 105 bEnd.3 cells were plated in 96-well culture plates in 100 μl of medium and cultured 24 to 48 hours to generate a monolayer. Endothelial cells were stimulated with tumor necrosis factor–α (TNF-α; 10 ng/ml; Thermo Fisher Scientific, Bleiswijk, The Netherlands) for 5 hours before the assay. After removal of TNF-α–containing medium, 2.5 × 10⁴ labeled tumor cells were seeded in 50 μl of medium per well and kept for 2 hours of adhesion time. Further measurements were performed as mentioned above.
Transwell invasion assay was performed using Transwell chambers (8 μm; Falcon, Durham, USA). A total of 105 cells were seeded in the upper chamber of a 24-well plate and coated with growth factor–reduced matrigel (Corning, Bedford, USA) in 200 μl of serum-free medium. The lower chamber was filled with 800 μl of medium containing 10% FBS. The chamber was incubated at 37°C for 16 hours. At the end of incubation, cells in the upper surface of the membrane were removed with a cotton swab. Migrated cells on the lower surface of the membrane were stained with 1% crystal violet/70% methanol solution. Then, membranes were transferred to empty 96 wells, adding 200 μl of acetic acid to dissolve crystal violet–stained cells. After incubating for 10 min on an orbital shaker, OD at 590 nm was measured in a microplate reader (Molecular Devices, Sunnyvale, CA, USA).
For scratch assay, cells were seeded in six-well plates and cultured to a density of 80%. The standard culture medium was replaced by a medium without FBS, and 8 hours later, a scratch was set with a sterile pipette tip. Cells were washed thrice with PBS, and three random sections of two scratches per experimental group were marked. Pictures were taken at the indicated time points under an Axiovert 25 microscope (ZEISS, Jena, Germany) with a Samsung WB750 camera (Samsung, Schwalbach, Germany). To calculate the migration velocity, the gap area was calculated using ImageJ software.
Generation of single cell–derived clones
Cells were counted by trypan blue exclusion assay, and 150 cells were resuspended in 30 ml of medium. Cell suspensions were seeded in 96 wells (100 μl per well, corresponding to 0.5 cells per well). Colonies growing to high confluence in 96-well plates were transferred independently to six-well plates and, later, to larger volumes for further maintenance.
Quantitative real-time polymerase chain reaction
Total mRNA was prepared using the RNeasy Mini Kit and reverse-transcribed with the QuantiTect Reverse Transcription Kit (both from QIAGEN, Hilden, Germany). Complementary DNA was amplified using SYBR Green PCR (polymerase chain reaction) Master Mix (QIAGEN) and gene-specific primers in a LightCycler 480 device (Roche, Mannheim, Germany). Normalization across samples was performed using geometric average of constitutive gene expression of β-glucuronidase. Gene expression levels were calculated according to the equation 2−ΔΔCT, where ΔCT was defined as CTgene of interest − CTendogenous control and ΔΔCT was defined as ΔCTgene of interest − ΔCTreference. ΔCT values were used for statistical comparison. The following primers were used:
Ddr1, 5′-TCCATAGACCAGAGGGATC-3′ (forward) and 5′-CAGGGCATAGCGGCACTTGG-3′ (reverse);
E-cadherin, 5′-CAGGTCTCCTCATGGCTTTGC-3′ (forward) and 5′-CTTCCGAAAAGAAGGCTGTCC-3′ (backward);
Epcam, 5′-CAGTGTACTTCCTATGGTACACAGAATACT-3′ (forward) and 5′-CTAGGCATTAAGCTCTCTGTGGATCTCACC-3′ (backward);
Erbb-2, 5′-TCCCCAGGGAGTATGTGAGG-3′ (forward) and 5′-GAGGCGGGACACATATGGAG-3′ (backward)
Erbb-3, 5′-GCCCAATCCTAACCAGTGCT-3′ (forward) and 5′-AGCCTGTAATCTCCCGGACT-3′ (backward);
Grlh2, 5′-CACCTCTCAAGACTGTTACAAGACT-3′ (forward) and 5′-CGAGATGAGTGGACTTGCTATCTC-3′ (backward);
Gusp, 5′-CAACCTCTGGTGGCCTTACC-3′ (forward) and 5′-GGGTGTAGTAGTCAGTCACA-3′ (backward);
Krt19, 5′-CTACCTTGCTCGGATTGAGGAG-3′ (forward) and 5′-AGTCTCGCTGGTAGCTCAGATG-3′ (backward);
N-cadherin, 5′-AGGGTGGACGTCATTGTAGC-3′ (forward) and 5′-CTGTTGGGGTCTGTC-3′ (backward);
Rab25, 5′-TGAGCCAAGATGGGGAATCG-3′ (forward) and 5′-GGAGAACTCAACCCCGATGG-3′ (backward);
Slug, 5′-TCCCATTAGTGACGAAGA-3′ (forward) and 5′-CCCAGGCTCACATATTCC-3′ (backward);
Snail, 5′-GCGGAAGATCTTCAACTGCAAATATTGTAAC-3′ (forward) and 5′-GCAGTGGGAGCAGGAGAATGGCTTCTCAC-3′ (backward);
Twist, 5′-CGGGTCATGGCTAACGTG-3′ (forward) and 5′-CAGCTTGCCATCTTGGAGTC-3′ (backward);
Vimentin, 5′-CGGAAAGTGGAATCCTTGCA-3′ (forward) and 5′-CACATCGATCTGGACATGCTGT-3′ (backward);
Zeb1, 5′-CCATACGAATGCCCGAACT-3′ (forward) and 5′-ACAACGGCTTGCACCACA-3′ (backward);
Zeb2, 5′-CCGTTGGACCTGTCATTACC-3′ (forward) and 5′-GACGATGAAGAAACACTGTTGTG-3′ (backward).
Patients
Thirty-four patients with tumor stages III and IV MBC were recruited for analysis of CTCs and DTCs at Shanghai General Hospital from September 2015 to April 2017. Metastasis sites were determined by computed tomography, magnetic resonance imaging, and bone scintigraphy. TNM (Tumor-Node-Metastasis) staging was assessed and given according to the Union for International Cancer Control 2009 guidelines. Patients were followed up until January 2018.
SE of CTCs and DTCs
Enrichment of CTCs and DTCs was performed according to the manufacturers’ instructions (Cytelligen, San Diego, CA, USA) (31). For each patient, 6 ml of peripheral blood sample and 3 ml of bone marrow were collected before therapy. The first 2 ml of sample were discarded to avoid epithelial cell contamination. Briefly, samples were washed with PBS and subsequently loaded on the nonhematopoietic cell separation matrix, followed by centrifugation at 450g for 5 min to remove sedimented RBCs. Supernatants containing WBCs and tumor cells were incubated with anti-CD45 monoclonal antibody–coated magnetic beads (Promega, Madison, WI). Beads-bound WBCs were depleted using a magnetic separator. WBC-free supernatants containing tumor cells were centrifuged and resuspended in PBS, followed by spreading onto a Cytelligen-formatted slide and dried overnight at 30° to 32°C for immediate use or stored at −20°C for long-term storage.
Identification of CTCs and DTCs by iFISH
Experiment was performed according to the product manufacturer’s instruction (Cytelligen, San Diego, CA, USA) (31). Briefly, samples on the coated slides were subjected to Vysis Centromere Probe (CEP8) Spectrum Orange (Abbott Laboratories, Abbott Park, IL, USA) hybridization for 3 hours using the S500 StatSpin ThermoBrite Slide Hybridization/Denaturation System (Abbott Molecular, Des Plaines, IL, USA). Samples were subsequently incubated with Alexa Fluor 594–conjugated monoclonal anti-CD45 and Alexa Fluor 488–conjugated monoclonal anti-EpCAM antibodies (Cytelligen, San Diego, CA, USA). Cell nuclei were stained with DAPI (Life Technologies, Carlsbad, CA, USA). Images of the identified tumor cells were automatically acquired using a Metafer-iFISH automated Circulating rare cells (CRCs) image scanning and analysis system (31). CTCs and DTCs were defined as DAPI+, CD45−, heteroploid chromosome 8 cells with or without visible EpCAM or diploid CEP8 signal with visible EpCAM. Cell clusters were defined as ≥2 contacted cells. To avoid bias, blood sample collection and CTC and DTC detection were coperformed by cross-blinded physicians and research scientists.
Collection of single CTC and amplification
Single CTC enriched and identified by SE-iFISH staining was isolated by means of a nonlaser microscopic single-cell manipulator (Cytelligen), followed by transferring into a clean PCR tube containing 7 μl of single-cell lysis buffer on ice from the REPLI-g Single Cell Kit (QIAGEN, Hilden, Germany). Each sample was incubated at 65°C for 10 min. Whole-genome amplification (WGA) was performed using the REPLI-g Single Cell Kit according to the standard protocol in a total volume of 50 μl at 30°C for 8 hours and was terminated at 65°C for 3 min. Amplified DNA products were stored at −20°C.
Quality control of WGA products and library preparation
The concentration of amplified DNA was measured using the Qubit Quantization Platform (Invitrogen, USA), and amplified DNA was purified using Agencourt AMPure XP beads (Beckman Coulter, USA). A total of 41 single-cell samples showed whole-genome DNA successfully amplified and were selected for library preparation.
Whole-genome sequencing, CNV, and GO analysis
One nanogram of amplified DNA was disintegrated by Tn5 at 55°C for 5 min. Products of Tn5 disintegration were used to construct DNA library using the Nextera XT DNA Sample Preparation Index Kit (Illumina, USA) and were subjected to pair-end sequencing on Illumina NextSeq 500 platform with sequence depth of 0.1×. Raw reads (565.5 million) were obtained from 41 cells; low-quality reads and adapter sequences were trimmed by Trimmomatic V0.35 before mapping. Qualified reads were processed with the in-house bioinformatics pipeline, which was followed by best practice treatment suggested by the Genome Analysis Toolkit V 3.7 (https://software.broadinstitute.org/gatk/). Briefly, FASTQ sequences were mapped to the human genome GRCh37 using the Burrows Wheeler Alignment Maximal Exact Matches tool (BWA-MEM; https://sourceforge.net/projects/bio-bwa/files/bwa-0.7.15.tar.bz2/download). In the end, 30 cells (including 10 EpCAM+ and 20 EpCAM− cells) with mapping rates of >50%, a mapping quality of >20, and duplicates of >30 were selected for CNV analysis. The CNVkit software (https://cnvkit.readthedocs.io/en/stable/index.html) was used to analyze sequencing coverage and copy number in the aligned sequencing reads from targeted amplicon sequencing of EpCAM+ and EpCAM− cell samples. Copy number segments were annotated to genes, and regions bearing a log2 ratio of at least ±0.4 were identified as suggestive of shallow deletions or gains. Segments with a log2 of <−1.2 were classified as deep deletions, and those with a log2 of >2 were classified as amplifications. To functionally analyze genes located in our CNVs, we used the DAVID tool (ver. 6.7 beta; http://david.abcc.ncifcrf.gov/) to perform GO classification.
Statistical analysis
Statistical calculations were performed using GraphPad Prism 5 (GraphPad Software, La Jolla, CA, USA), Microsoft Excel (Microsoft, Redmond, WA, USA), and SPSS statistical software ver. 13.0.1 (SPSS Inc., Chicago, IL). The Kolmogorov-Smirnov test was used to test normal distribution of datasets. If datasets were subjected to a normal distribution, then unpaired or paired t test was used for comparing between two groups and one-way analysis of variance (ANOVA) and post hoc Bonferroni t test for multiple comparisons. Mann-Whitney U test was used to compare the difference between two independent groups with a nonparametric data distribution. The Wilcoxon signed-rank test was used to compare two related samples with a nonparametric data distribution. Kruskal-Wallis test with post hoc Dunn’s test was applied for multiple comparisons among groups with a nonparametric data distribution. The correlation between EpCAM expression and EMT score was analyzed using Spearman’s rank test. ROC curves were constructed to calculate the AUC for the capability of the EpCAM positivity rate of cells to predict patients’ outcome. The Kaplan-Meier method was used to analyze patients’ overall survival. Bars and error bars in the histograms represent mean values ± SD of at least three independent experiments. P < 0.05 was considered significant.
Supplementary Material
Acknowledgments
Funding: Parts of the work have been supported by grants GI 540/3-1 and GI 540/3-2 from the Deutsche Forschungsgemeinschaft to (O.G.), by the international doctoral program “i-Target: Immunotargeting of cancer” funded by the Elite Network of Bavaria (to S.K.), by the Marie-Sklodowska-Curie “Training Network for the Immunotherapy of Cancer (IMMUTRAIN)” funded by the H2020 program of the European Union (to S.K.), by the European Research Council Starting Grant (grant number 756017 to S.K.), and by the China National Natural Science Funds grant 81772802 and the Shanghai Science and Technology Innovation Action Plan grant 16ZR1427400 (to H.W). Author contributions: X.L. performed and analyzed all in vitro experiments with the help of Z.H., performed in vivo animal experiments together with B.L.C., A.M., C.V., M.P., Y.H., S.N., D.B., and J.S. J.L. conducted the clinical study under supervision of H.W. and analyzed SE-iFISH results. X.L., B.L.C., A.M., C.V., Z.H., M.P., Y.H., S.N., D.B., and J.S. performed all in vivo animal experiments. P.P.L. and D.D.W. performed SE-iFISH. C.A.R. and B.U. helped with adhesion assays. J.D. and S.Z. performed the sequence data analysis of DNA sequencing. G.K. and D.L. performed IHC and cytochemistry staining. H.Z., I.Z., and H.B. performed karyotyping, gene extraction, and GO term analysis of 4T1 cells and sublines. S.K. supervised animal experiments and helped writing the manuscript. S.K., O.G., and H.W. supervised the study. O.G. generated figures and wrote the manuscript with the help of X.L., S.K. and H.W. and with the support of all other authors. H.W. supervised the clinical and DNA sequencing studies and helped writing the manuscript. Competing interests: All other authors declare that they have no conflicts of interest, except P.P.L. P.P.L. has a financial, management/advisory relationship as president of Cytelligen, San Diego, USA. Data and materials availability: All data needed to evaluate the conclusions in the paper are present in the paper and/or the Supplementary Materials. Additional data related to this paper may be requested from the authors.
SUPPLEMENTARY MATERIALS
Supplementary material for this article is available at http://advances.sciencemag.org/cgi/content/full/5/6/eaav4275/DC1
Fig. S1. EpCAM and CD45 expression, karyotyping, and 6-thioguanine effects on 4T1 cells and sublines.
Fig. S2. Quantification of EMT markers, cell growth, 2D and 3D colony formation, cell adhesion, migration, and invasion of 4T1 cells and sublines CTC1 and DTC1.
Fig. S3. Analysis of tumor growth, metastases formation, EpCAM and vimentin expression, ex vivo cultures, and GO terms and genes associated with DNA breakpoints in 4T1 cells and sublines CTC1 and DTC1.
Fig. S4. Analysis of EMT scores and markers in 4T1 cells, E/m- and M/e-type sublines.
Fig. S5. Analysis of cell proliferation, adhesion, sensitivity to chemotherapy, and metastasis formation in 4T1 cells, E/m-, M/e-, and M-type sublines.
Fig. S6. Analysis of morphology, EMT scores, and EpCAM expression of 4T1-, CTC1-, and DTC1-derived single cell clones, and DTC1-derived CTC sublines.
Fig. S7. EpCAM expression in 4T1- and CTC1-derived primary tumors and metastases, and in primary tumors, lymph node and distant metastases of clinical samples of MBC.
Fig. S8. Patients’ characteristics and ploidy and cell size of CTCs and DTCs from MBC patients.
Fig. S9. Copy number variations in EpCAM+ and EpCAM− CTCs from MBC patients.
Table S1. Enrichment analysis of GO biological process terms of CNVs from EpCAM+ and EpCAM− CTCs.
REFERENCES AND NOTES
- 1.DeSantis C. E., Ma J., Goding Sauer A., Newman L. A., Jemal A., Breast cancer statistics, 2017, racial disparity in mortality by state. CA Cancer J. Clin. 67, 439–448 (2017). [DOI] [PubMed] [Google Scholar]
- 2.Lim B., Hortobagyi G. N., Current challenges of metastatic breast cancer. Cancer Metastasis Rev. 35, 495–514 (2016). [DOI] [PubMed] [Google Scholar]
- 3.Kang Y., Pantel K., Tumor cell dissemination: Emerging biological insights from animal models and cancer patients. Cancer Cell 23, 573–581 (2013). [DOI] [PMC free article] [PubMed] [Google Scholar]
- 4.Pantel K., Alix-Panabières C., Riethdorf S., Cancer micrometastases. Nat. Rev. Clin. Oncol. 6, 339–351 (2009). [DOI] [PubMed] [Google Scholar]
- 5.Lambert A. W., Pattabiraman D. R., Weinberg R. A., Emerging biological principles of metastasis. Cell 168, 670–691 (2017). [DOI] [PMC free article] [PubMed] [Google Scholar]
- 6.Joosse S. A., Gorges T. M., Pantel K., Biology, detection, and clinical implications of circulating tumor cells. EMBO Mol. Med. 7, 1–11 (2015). [DOI] [PMC free article] [PubMed] [Google Scholar]
- 7.Chaffer C. L., Weinberg R. A., A perspective on cancer cell metastasis. Science 331, 1559–1564 (2011). [DOI] [PubMed] [Google Scholar]
- 8.Janni W. J., Rack B., Terstappen L. W. M. M., Pierga J.-Y., Taran F.-A., Fehm T., Hall C., de Groot M. R., Bidard F.-C., Friedl T. W. P., Fasching P. A., Brucker S. Y., Pantel K., Lucci A., Pooled analysis of the prognostic relevance of circulating tumor cells in primary breast cancer. Clin. Cancer Res. 22, 2583–2593 (2016). [DOI] [PubMed] [Google Scholar]
- 9.Cristofanilli M., Circulating tumor cells, disease progression, and survival in metastatic breast cancer. Semin. Oncol. 33, S9–S14 (2006). [DOI] [PubMed] [Google Scholar]
- 10.Janni W., Vogl F. D., Wiedswang G., Synnestvedt M., Fehm T., Jückstock J., Borgen E., Rack B., Braun S., Sommer H., Solomayer E., Pantel K., Nesland J., Friese K., Naume B., Persistence of disseminated tumor cells in the bone marrow of breast cancer patients predicts increased risk for relapse—A European pooled analysis. Clin. Cancer Res. 17, 2967–2976 (2011). [DOI] [PubMed] [Google Scholar]
- 11.Müller V., Riethdorf S., Rack B., Janni W., Fasching P. A., Solomayer E., Aktas B., Kasimir-Bauer S., Pantel K., Fehm T. DETECT study group , Prognostic impact of circulating tumor cells assessed with the CellSearch System™ and AdnaTest Breast™ in metastatic breast cancer patients: The DETECT study. Breast Cancer Res. 14, R118 (2012). [DOI] [PMC free article] [PubMed] [Google Scholar]
- 12.Pantel K., Alix-Panabières C., Circulating tumour cells in cancer patients: Challenges and perspectives. Trends Mol. Med. 16, 398–406 (2010). [DOI] [PubMed] [Google Scholar]
- 13.Baccelli I., Schneeweiss A., Riethdorf S., Stenzinger A., Schillert A., Vogel V., Klein C., Saini M., Bäuerle T., Wallwiener M., Holland-Letz T., Höfner T., Sprick M., Scharpff M., Marmé F., Sinn H. P., Pantel K., Weichert W., Trumpp A., Identification of a population of blood circulating tumor cells from breast cancer patients that initiates metastasis in a xenograft assay. Nat. Biotechnol. 31, 539–544 (2013). [DOI] [PubMed] [Google Scholar]
- 14.Brabletz T., Kalluri R., Nieto M. A., Weinberg R. A., EMT in cancer. Nat. Rev. Cancer 18, 128–134 (2018). [DOI] [PubMed] [Google Scholar]
- 15.Thiery J. P., Lim C. T., Tumor dissemination: An EMT affair. Cancer Cell 23, 272–273 (2013). [DOI] [PubMed] [Google Scholar]
- 16.Ye X., Brabletz T., Kang Y., Longmore G. D., Nieto M. A., Stanger B. Z., Yang J., Weinberg R. A., Upholding a role for EMT in breast cancer metastasis. Nature 547, E1–E3 (2017). [DOI] [PMC free article] [PubMed] [Google Scholar]
- 17.Pastushenko I., Brisebarre A., Sifrim A., Fioramonti M., Revenco T., Boumahdi S., van Keymeulen A., Brown D., Moers V., Lemaire S., de Clercq S., Minguijón E., Balsat C., Sokolow Y., Dubois C., de Cock F., Scozzaro S., Sopena F., Lanas A., D’Haene N., Salmon I., Marine J.-C., Voet T., Sotiropoulou P. A., Blanpain C., Identification of the tumour transition states occurring during EMT. Nature 556, 463–468 (2018). [DOI] [PubMed] [Google Scholar]
- 18.Thompson E. W., Nagaraj S. H., Transition states that allow cancer to spread. Nature 556, 442–444 (2018). [DOI] [PubMed] [Google Scholar]
- 19.Chao Y., Wu Q., Acquafondata M., Dhir R., Wells A., Partial mesenchymal to epithelial reverting transition in breast and prostate cancer metastases. Cancer Microenviron. 5, 19–28 (2012). [DOI] [PMC free article] [PubMed] [Google Scholar]
- 20.Korpal M., Ell B. J., Buffa F. M., Ibrahim T., Blanco M. A., Celià-Terrassa T., Mercatali L., Khan Z., Goodarzi H., Hua Y., Wei Y., Hu G., Garcia B. A., Ragoussis J., Amadori D., Harris A. L., Kang Y., Direct targeting of Sec23a by miR-200s influences cancer cell secretome and promotes metastatic colonization. Nat. Med. 17, 1101–1108 (2011). [DOI] [PMC free article] [PubMed] [Google Scholar]
- 21.Hay E. D., An overview of epithelio-mesenchymal transformation. Acta Anat. 154, 8–20 (1995). [DOI] [PubMed] [Google Scholar]
- 22.Fischer K. R., Durrans A., Lee S., Sheng J., Li F., Wong S. T. C., Choi H., el Rayes T., Ryu S., Troeger J., Schwabe R. F., Vahdat L. T., Altorki N. K., Mittal V., Gao D., Epithelial-to-mesenchymal transition is not required for lung metastasis but contributes to chemoresistance. Nature 527, 472–476 (2015). [DOI] [PMC free article] [PubMed] [Google Scholar]
- 23.Zheng X., Carstens J. L., Kim J., Scheible M., Kaye J., Sugimoto H., Wu C.-C., LeBleu V. S., Kalluri R., Epithelial-to-mesenchymal transition is dispensable for metastasis but induces chemoresistance in pancreatic cancer. Nature 527, 525–530 (2015). [DOI] [PMC free article] [PubMed] [Google Scholar]
- 24.Aiello N. M., Brabletz T., Kang Y., Nieto M. A., Weinberg R. A., Stanger B. Z., Upholding a role for EMT in pancreatic cancer metastasis. Nature 547, E7–E8 (2017). [DOI] [PMC free article] [PubMed] [Google Scholar]
- 25.Wang H., Stoecklein N. H., Lin P. P., Gires O., Circulating and disseminated tumor cells: Diagnostic tools and therapeutic targets in motion. Oncotarget 8, 1884–1912 (2017). [DOI] [PMC free article] [PubMed] [Google Scholar]
- 26.Yu M., Bardia A., Wittner B. S., Stott S. L., Smas M. E., Ting D. T., Isakoff S. J., Ciciliano J. C., Wells M. N., Shah A. M., Concannon K. F., Donaldson M. C., Sequist L. V., Brachtel E., Sgroi D., Baselga J., Ramaswamy S., Toner M., Haber D. A., Maheswaran S., Circulating breast tumor cells exhibit dynamic changes in epithelial and mesenchymal composition. Science 339, 580–584 (2013). [DOI] [PMC free article] [PubMed] [Google Scholar]
- 27.Bednarz-Knoll N., Alix-Panabières C., Pantel K., Plasticity of disseminating cancer cells in patients with epithelial malignancies. Cancer Metastasis Rev. 31, 673–687 (2012). [DOI] [PubMed] [Google Scholar]
- 28.Aslakson C. J., Miller F. R., Selective events in the metastatic process defined by analysis of the sequential dissemination of subpopulations of a mouse mammary tumor. Cancer Res. 52, 1399–1405 (1992). [PubMed] [Google Scholar]
- 29.Miller B. E., Miller F. R., Heppner G. H., Interactions between tumor subpopulations affecting their sensitivity to the antineoplastic agents cyclophosphamide and methotrexate. Cancer Res. 41, 4378–4381 (1981). [PubMed] [Google Scholar]
- 30.Santarius T., Shipley J., Brewer D., Stratton M. R., Cooper C. S., A census of amplified and overexpressed human cancer genes. Nat. Rev. Cancer 10, 59–64 (2010). [DOI] [PubMed] [Google Scholar]
- 31.Lin P. P., Gires O., Wang D. D., Li L., Wang H., Comprehensive in situ co-detection of aneuploid circulating endothelial and tumor cells. Sci. Rep. 7, 9789 (2017). [DOI] [PMC free article] [PubMed] [Google Scholar]
- 32.Gires O., Stoecklein N. H., Dynamic EpCAM expression on circulating and disseminating tumor cells: Causes and consequences. Cell. Mol. Life Sci. 71, 4393–4402 (2014). [DOI] [PMC free article] [PubMed] [Google Scholar]
- 33.Celià-Terrassa T., Kang Y., Distinctive properties of metastasis-initiating cells. Genes Dev. 30, 892–908 (2016). [DOI] [PMC free article] [PubMed] [Google Scholar]
- 34.Pan M., Schinke H., Luxenburger E., Kranz G., Shakhtour J., Libl D., Huang Y., Gaber A., Pavšič M., Lenarčič B., Kitz J., Jakob M., Schwenk-Zieger S., Canis M., Hess J., Unger K., Baumeister P., Gires O., EpCAM ectodomain EpEX is a ligand of EGFR that counteracts EGF-mediated epithelial-mesenchymal transition through modulation of phospho-ERK1/2 in head and neck cancers. PLOS Biol. 16, e2006624 (2018). [DOI] [PMC free article] [PubMed] [Google Scholar]
- 35.Jordan N. V., Johnson G. L., Abell A. N., Tracking the intermediate stages of epithelial-mesenchymal transition in epithelial stem cells and cancer. Cell Cycle 10, 2865–2873 (2011). [DOI] [PMC free article] [PubMed] [Google Scholar]
- 36.Huang R. Y.-J., Wong M. K., Tan T. Z., Kuay K. T., Ng A. H. C., Chung V. Y., Chu Y.-S., Matsumura N., Lai H.-C., Lee Y. F., Sim W.-J., Chai C., Pietschmann E., Mori S., Low J. J. H., Choolani M., Thiery J. P., An EMT spectrum defines an anoikis-resistant and spheroidogenic intermediate mesenchymal state that is sensitive to e-cadherin restoration by a src-kinase inhibitor, saracatinib (AZD0530). Cell Death Dis. 4, e915 (2013). [DOI] [PMC free article] [PubMed] [Google Scholar]
- 37.Sikandar S. S., Kuo A. H., Kalisky T., Cai S., Zabala M., Hsieh R. W., Lobo N. A., Scheeren F. A., Sim S., Qian D., Dirbas F. M., Somlo G., Quake S. R., Clarke M. F., Role of epithelial to mesenchymal transition associated genes in mammary gland regeneration and breast tumorigenesis. Nat. Commun. 8, 1669 (2017). [DOI] [PMC free article] [PubMed] [Google Scholar]
- 38.Tan T. Z., Miow Q. H., Miki Y., Noda T., Mori S., Huang R. Y.-J., Thiery J. P., Epithelial-mesenchymal transition spectrum quantification and its efficacy in deciphering survival and drug responses of cancer patients. EMBO Mol. Med. 6, 1279–1293 (2014). [DOI] [PMC free article] [PubMed] [Google Scholar]
- 39.de Wit S., Manicone M., Rossi E., Lampignano R., Yang L., Zill B., Rengel-Puertas A., Ouhlen M., Crespo M., Berghuis A. M. S., Andree K. C., Vidotto R., Trapp E. K., Tzschaschel M., Colomba E., Fowler G., Flohr P., Rescigno P., Fontes M. S., Zamarchi R., Fehm T., Neubauer H., Rack B., Alunni-Fabbroni M., Farace F., de Bono J., IJzerman M. J., Terstappen L. W. M. M., EpCAMhigh and EpCAMlow circulating tumor cells in metastatic prostate and breast cancer patients. Oncotarget 9, 35705–35716 (2018). [DOI] [PMC free article] [PubMed] [Google Scholar]
- 40.Aceto N., Bardia A., Miyamoto D. T., Donaldson M. C., Wittner B. S., Spencer J. A., Yu M., Pely A., Engstrom A., Zhu H., Brannigan B. W., Kapur R., Stott S. L., Shioda T., Ramaswamy S., Ting D. T., Lin C. P., Toner M., Haber D. A., Maheswaran S., Circulating tumor cell clusters are oligoclonal precursors of breast cancer metastasis. Cell 158, 1110–1122 (2014). [DOI] [PMC free article] [PubMed] [Google Scholar]
- 41.Rack B., Schindlbeck C., Jückstock J., Andergassen U., Hepp P., Zwingers T., Friedl T. W. P., Lorenz R., Tesch H., Fasching P. A., Fehm T., Schneeweiss A., Lichtenegger W., Beckmann M. W., Friese K., Pantel K., Janni W. SUCCESS Study Group , Circulating tumor cells predict survival in early average-to-high risk breast cancer patients. J. Natl. Cancer Inst. 106, dju066 (2014). [DOI] [PMC free article] [PubMed] [Google Scholar]
- 42.Zitzelsberger H., Lehmann L., Hieber L., Weier H.-U., Janish C., Fung J., Negele T., Spelsberg F., Lengfelder E., Demidchik E. P., Salassidis K., Kellerer A. M., Werner M., Bauchinger M., Cytogenetic changes in radiation-induced tumors of the thyroid. Cancer Res. 59, 135–140 (1999). [PubMed] [Google Scholar]
Associated Data
This section collects any data citations, data availability statements, or supplementary materials included in this article.
Supplementary Materials
Supplementary material for this article is available at http://advances.sciencemag.org/cgi/content/full/5/6/eaav4275/DC1
Fig. S1. EpCAM and CD45 expression, karyotyping, and 6-thioguanine effects on 4T1 cells and sublines.
Fig. S2. Quantification of EMT markers, cell growth, 2D and 3D colony formation, cell adhesion, migration, and invasion of 4T1 cells and sublines CTC1 and DTC1.
Fig. S3. Analysis of tumor growth, metastases formation, EpCAM and vimentin expression, ex vivo cultures, and GO terms and genes associated with DNA breakpoints in 4T1 cells and sublines CTC1 and DTC1.
Fig. S4. Analysis of EMT scores and markers in 4T1 cells, E/m- and M/e-type sublines.
Fig. S5. Analysis of cell proliferation, adhesion, sensitivity to chemotherapy, and metastasis formation in 4T1 cells, E/m-, M/e-, and M-type sublines.
Fig. S6. Analysis of morphology, EMT scores, and EpCAM expression of 4T1-, CTC1-, and DTC1-derived single cell clones, and DTC1-derived CTC sublines.
Fig. S7. EpCAM expression in 4T1- and CTC1-derived primary tumors and metastases, and in primary tumors, lymph node and distant metastases of clinical samples of MBC.
Fig. S8. Patients’ characteristics and ploidy and cell size of CTCs and DTCs from MBC patients.
Fig. S9. Copy number variations in EpCAM+ and EpCAM− CTCs from MBC patients.
Table S1. Enrichment analysis of GO biological process terms of CNVs from EpCAM+ and EpCAM− CTCs.