Abstract
This study uses data from the Place of Last Drink database and Google maps to assess the association of blood alcohol concentration with distance traveled and driver’s age among intoxicated drivers in Minnesota.
The National Highway Traffic Safety Administration reported 37 133 motor vehicle crash fatalities in the United States in 2017, of which 10 874 (29.3%) involved alcohol-impaired drivers.1 Trauma systems frequently care for intoxicated drivers involved in motor vehicle crashes; however, these drivers represent only a small fraction of those at risk. According to data from the early 1990s, the estimated distance traveled by intoxicated drivers was 9.7 miles (to convert miles to kilometers, multiply by 1.6)2; however, data on the empirical vehicle miles traveled (VMT) are lacking. Accordingly, this study used the Place of Last Drink (POLD) database,3 created by the Partnership for Change, to estimate the miles driven by intoxicated drivers.
Methods
The POLD database collected information from 30 municipal police departments and the Minnesota State Patrol. The database was queried to identify individuals with a blood alcohol concentration (BAC) greater than or equal to 0.08 mg/dL, arrested for driving under the influence or driving while intoxicated (DUI/DWI) between January 2014 and December 2017. Individuals with incomplete POLD records were excluded. This study was approved by the institutional review board of North Memorial Health, Robbinsdale, Minnesota. The information studied included driver’s age and gender, POLD location, location and time of citation, and driver’s BAC. We selected 200 records by using a data analysis random sample tool (Excel; Microsoft Corp), geographic database information, and the “suggested route” by Google Maps (https://maps.google.com) to estimate the VMT (Figure 1). We calculated the statistical significance at P = .05 (2-sided) by the χ2 or unpaired, 2-tailed t tests.
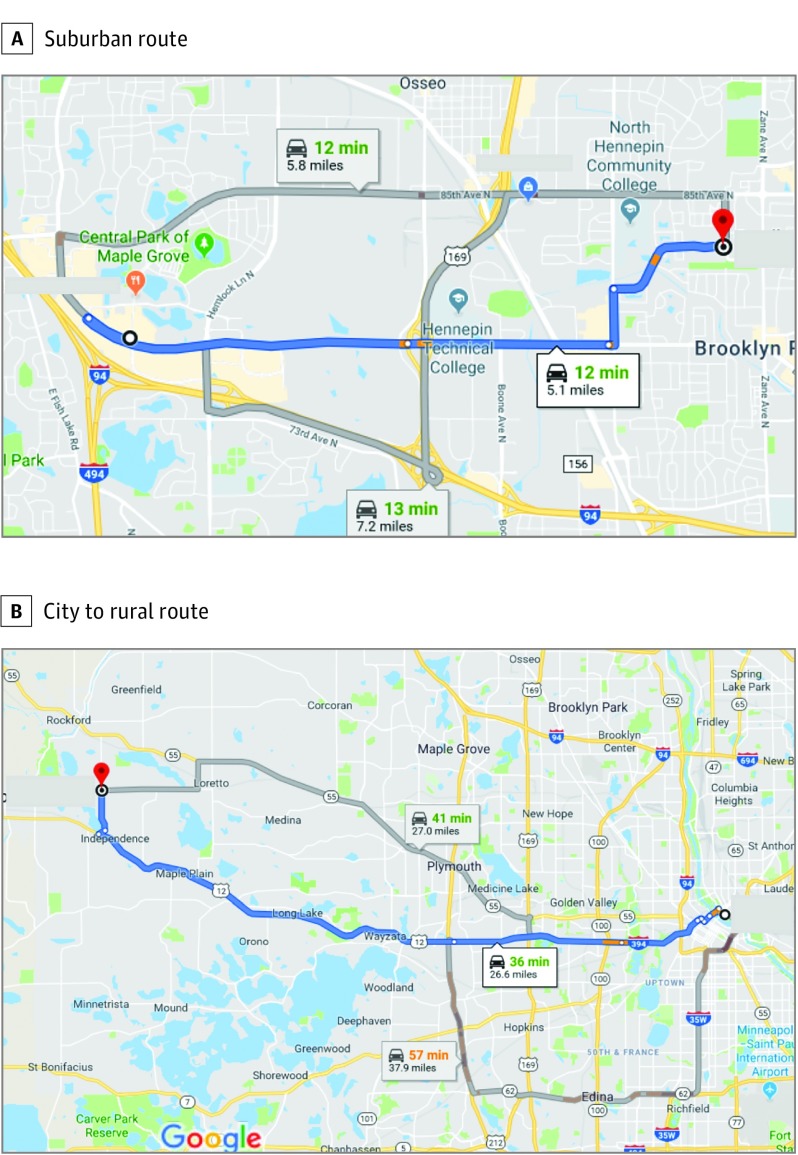
Figure 1. Examples of Use of Google Maps to Estimate Route and Miles Driven.
A, “Suggested route” options identified 3 preferred routes between a suburban place of last drink and the location of the police citation, ranging from 5.1 to 7.2 miles, with approximately 1.2 miles on highway and travel times between 12 and 13 minutes. B, Example of suggested routes for travel from a downtown place of last drink to a rural offense location requiring driving distances that ranged from 26.6 to 37.9 miles, including more than 25 miles of highway travel (using either I-394 and Highway 12 or on Highway 55) or more than 35 miles highway travel (on I-35W, I-494, and Highway 12). To convert miles to kilometers, multiply by 1.6.
Results
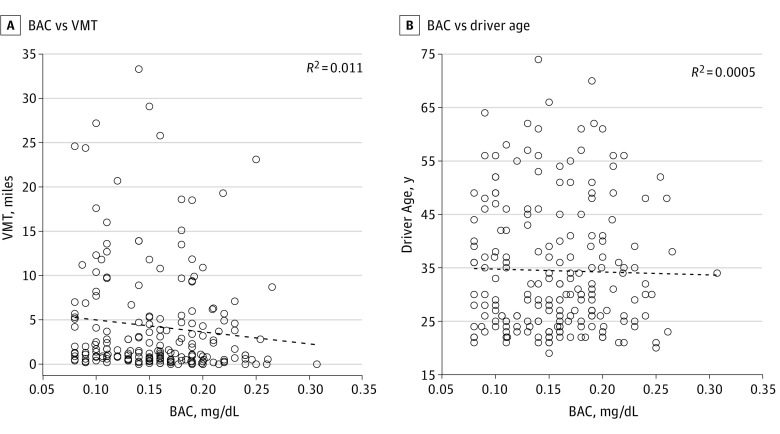
Of the 1794 records that met the study criteria, 67.5% of the total were male, the mean (SD) BAC was 0.147 (0.001) mg/dL (697 individuals had a BAC ≥0.160 mg/dL), and the age was 35.0 (0.3) years. The VMT estimation sample (n = 200) had a slightly higher mean (SD) BAC (0.156 [0.003] mg/dL; P = .004), but age (mean [SD], 34.5 [0.9] years; P = .58) and the proportion of males (137 of 200 [68.5%]; P = .81) were similar to those of all intoxicated drivers (N = 1794). The total VMT for the study sample was 910 miles (mean [SD], 4.6 [0.5]; range, 0-67.7 miles). Of the 200 citations, 174 [87.0%] were issued for travel outside of Minneapolis city limits, and 120 arrests (60.0%) took place between 10 pm and 2 am. Figure 2 shows that neither VMT nor age was significantly associated with BAC. In addition, no gender-specific differences were found in the mean age, BAC, or VMT (data not shown).
Figure 2. Association of Blood Alcohol Concentration (BAC) With Vehicle Miles Traveled (VMT) and Driver Age.
The variables BAC, VMT, and age were analyzed to assess the presence of associations among these variables. Because initial sample selections were based on BAC, this variable is plotted on the x-axis. A, Scatterplot and trend line of VMT vs BAC shows no statistically significant association between VMT and BAC. B, Scatterplot and trend line of age vs BAC shows no statistically significant association between driver age and BAC.
Discussion
The present study used information from the POLD database to estimate the VMT using a random sample of intoxicated drivers arrested in Minnesota. We found that many intoxicated drivers traveled considerable distances despite having a high BAC. These data are unique in that law enforcement information confirmed that those cited were the drivers and because all of them had a BAC of 0.08 mg/dL or greater. To date, successful POLD initiatives have focused on decreasing retailer service to intoxicated individuals,3 but our VMT estimates suggest that these efforts are insufficient. Our analysis may alter some stereotypes since we found that neither the VMT nor age was significantly associated with BAC, which is information that may help to inform prevention efforts. We found that most citations occurred between 10 pm and 2 am and also found a higher proportion of intoxicated female drivers compared with prior reports.4
The economic costs of alcohol-impaired driving are staggering, with an estimated inflation-adjusted annual cost of $50.9 billion in the United States, as of February 2019 (the cost was estimated at $44 billion in 2010, which was entered into the Consumer Price Index inflation calculator [https://www.bls.gov/data] to obtain the current value).4 The National Highway Traffic Safety Administration found that as of 2017, 84% of the alcohol-impaired drivers involved in a fatal crash had a BAC of 0.08 mg/dL or greater.1 In addition, the Centers for Disease Control and Prevention reported 121 million alcohol-impaired driving episodes during 2012.2 This same report estimated that in 2012 only 1 of 625 DWI trips resulted in a crash, and arrests occurred in less than 1 of 1700 trips that did not result in a crash.2 Thus, several initiatives need to be undertaken to address this challenge. Deploying additional police probably would not solve the problem, since we found that some intoxicated drivers traveled many miles before their arrest. An economic analysis from 2001 postulated that increasing the first-offense fine to an inflation-adjusted $14 000 would alter behavior.5 Another analysis, using economic data from 2010, calculated the external costs of drunk driving at more than $43 per trip; consequently, communities may find it cost-effective to cover cab or ride-share fees.2 Other investigators support increasing marginal penalties and standardizing DUI policies across states.6 Innovative approaches are urgently needed to address the public health concerns posed by intoxicated drivers.
References
- 1.Alcohol-impaired driving. Traffic Safety Facts, 2017 data. NHTSA’s National Center for Statistics and Analysis Motor Vehicle Traffic Crash Data website. https://crashstats.nhtsa.dot.gov/Api/Public/ViewPublication/812630. Published November 2018. Accessed May 8, 2019.
- 2.Miller TR, Spicer RS, Levy DT. How intoxicated are drivers in the United States? estimating the extent, risks and costs per kilometer of driving by blood alcohol level. Accid Anal Prev. 1999;31(5):515-523. doi: 10.1016/S0001-4575(99)00008-1 [DOI] [PubMed] [Google Scholar]
- 3.Place of Last Drink (POLD) website. http://poldsystem.com. Accessed March 20, 2019.
- 4.Jewett A, Shults RA, Banerjee T, Bergen G. Alcohol-impaired driving among adults—United States, 2012. MMWR Morb Mortal Wkly Rep. 2015;64(30):814-817. doi: 10.15585/mmwr.mm6430a2 [DOI] [PMC free article] [PubMed] [Google Scholar]
- 5.Levitt SD, Porter J. How dangerous are drinking drivers? J Polit Econ. 2001;109:1198-1237. doi: 10.1086/323281 [DOI] [Google Scholar]
- 6.Grant D. A structural analysis of U.S. drunk driving policy. Int Rev Law Econ. 2016;45:14-22. doi: 10.1016/j.irle.2015.10.002 [DOI] [Google Scholar]


